. 2016 Oct 18;7(42):68803-68820.
doi: 10.18632/oncotarget.11931.

A highly invasive subpopulation of MDA-MB-231 breast cancer cells shows accelerated growth, differential chemoresistance, features of apocrine tumors and reduced tumorigenicity in vivo

Affiliations

A highly invasive subpopulation of MDA-MB-231 breast cancer cells shows accelerated growth, differential chemoresistance, features of apocrine tumors and reduced tumorigenicity in vivo

Adriana Amaro et al. Oncotarget. .

Abstract

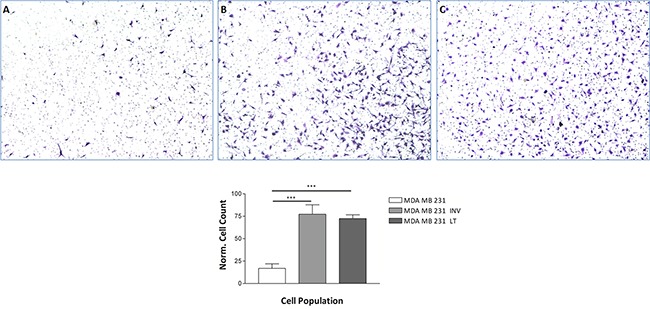
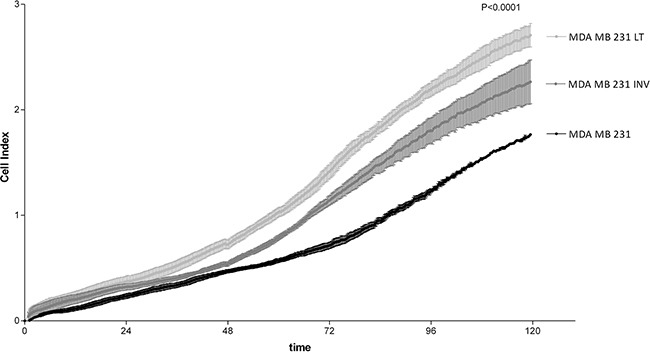
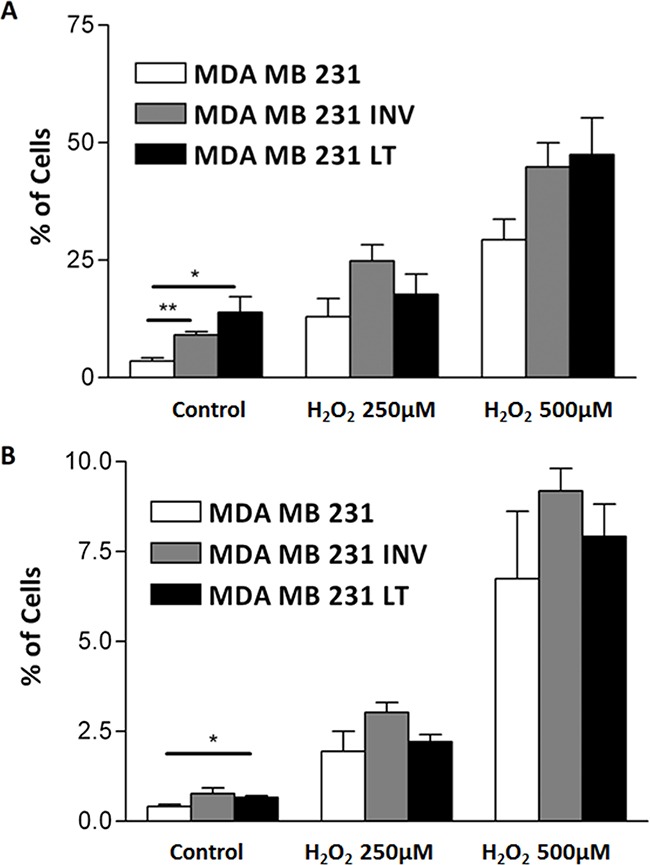
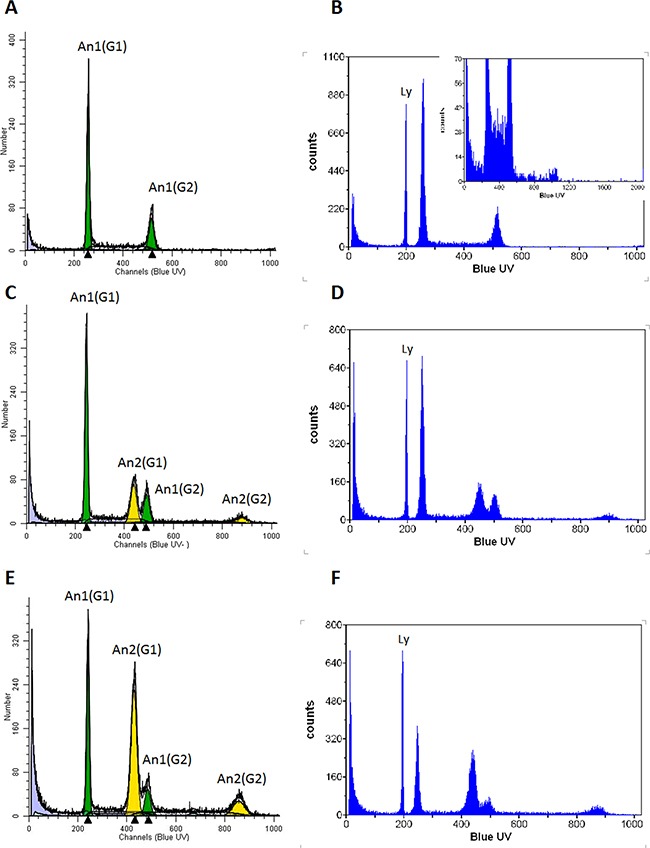
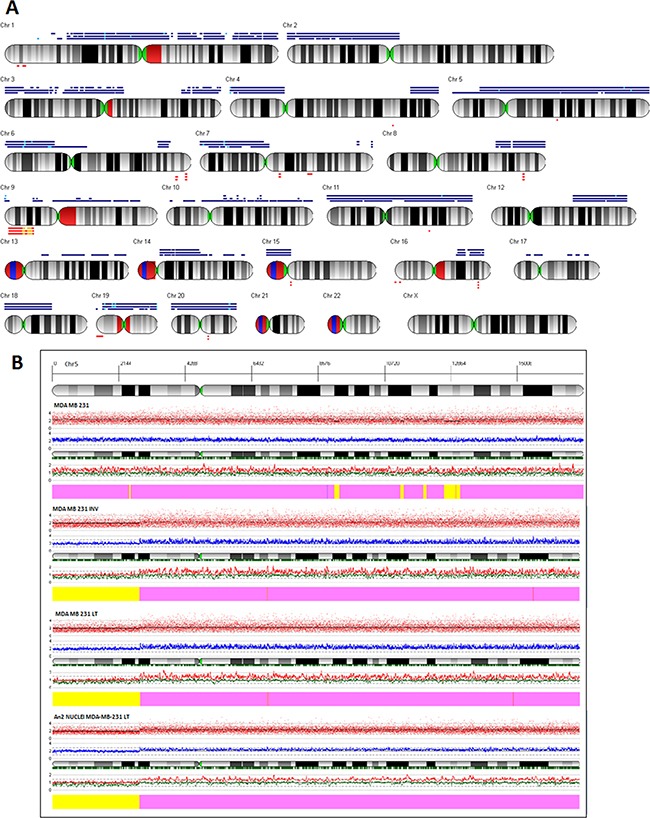
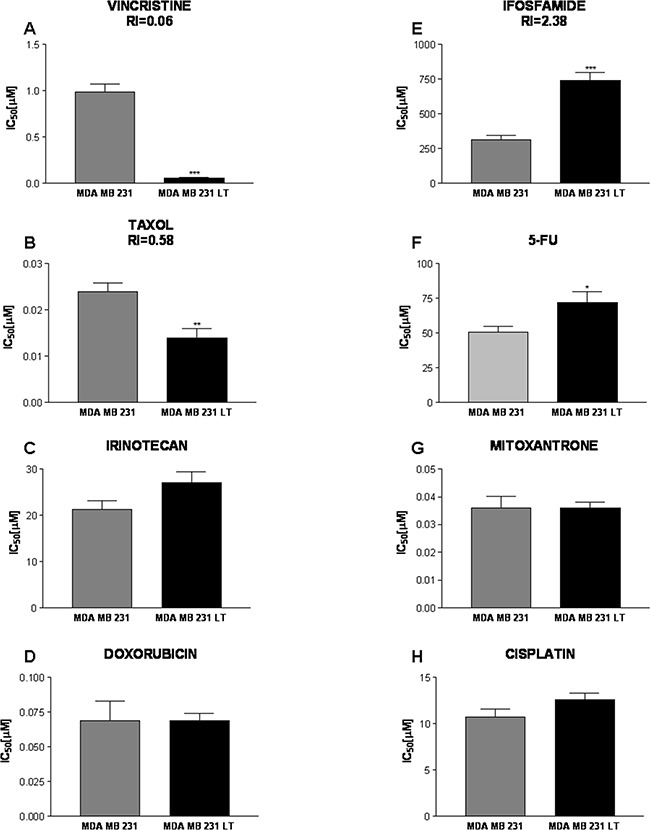
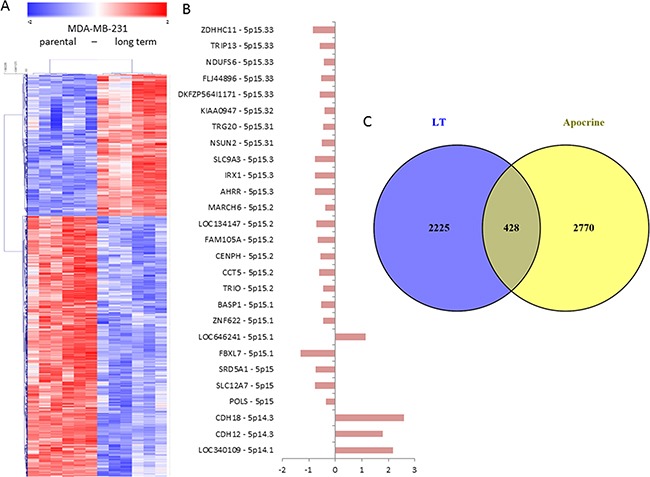
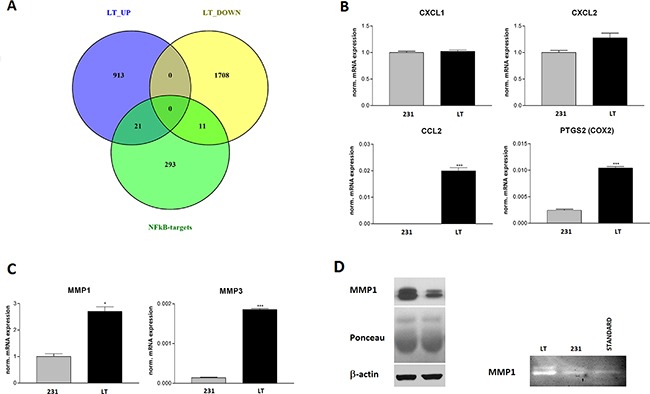
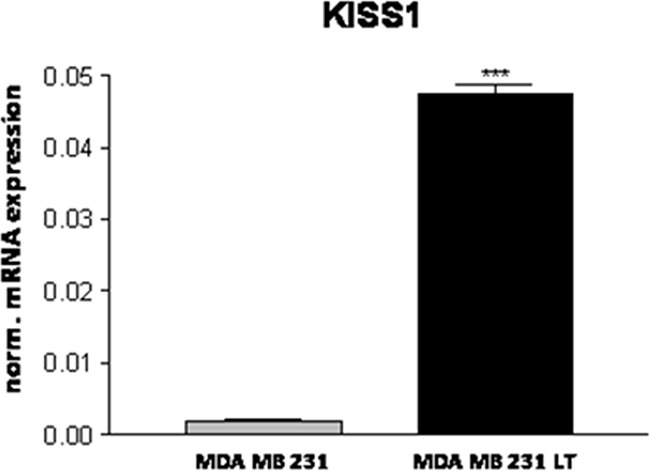
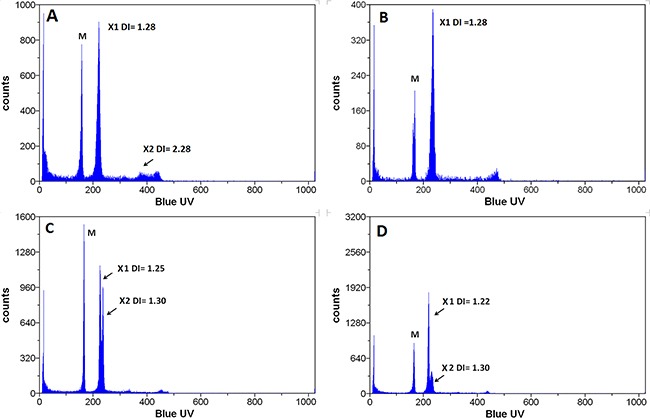
The acquisition of an invasive phenotype is a prerequisite for metastasization, yet it is not clear whether or to which extent the invasive phenotype is linked to other features characteristic of metastatic cells. We selected an invasive subpopulation from the triple negative breast cancer cell line MDA-MB-231, performing repeated cycles of preparative assays of invasion through Matrigel covered membranes. The invasive sub-population of MDA-MB-231 cells exhibits stronger migratory capacity as compared to parental cells confirming the highly invasive potential of the selected cell line. Prolonged cultivation of these cells did not abolish the invasive phenotype. ArrayCGH, DNA index quantification and karyotype analyses confirmed a common genetic origin of the parental and invasive subpopulations and revealed discrete structural differences of the invasive subpopulation including increased ploidy and the absence of a characteristic amplification of chromosome 5p14.1-15.33. Gene expression analyses showed a drastically altered expression profile including features of apocrine breast cancers and of invasion related matrix-metalloproteases and cytokines. The invasive cells showed accelerated proliferation, increased apoptosis, and an altered pattern of chemo-sensitivity with lower IC50 values for drugs affecting the mitotic apparatus. However, the invasive cell population is significantly less tumorigenic in orthotopic mouse xenografts suggesting that the acquisition of the invasive capacity and the achievement of metastatic growth potential are distinct events.

Keywords: aneuploidy; apocrine breast cancer; breast cancer; invasion; metastasis.


Conflict of interest statement

CONFLICTS OF INTEREST

The authors have no conflict of interest to declare.

Figures

Figure 1
Figure 1. Invasion through Matrigel
The invasive potential of MDA-MB-231 cells, 231, A. the invasive subpopulation, MDA-MB-INV cells, selected therefrom after three cycles of selection INV, B. and the selected cells after continuous growth for six months, MDA-MB-LT cells LT, C. was analyzed in Matrigel covered Transwell chambers. Invaded cells were counted. INV and LT cells show a significantly increased invasion potential as compared to 231 cells. The numbers of invaded cells counted was normalized for proliferation at 24 hrs. using the proliferation assay shown in Figure 2.
Figure 2
Figure 2. Analysis of cell growth
231, INV and LT cells were analyzed for cell growth by real time electrical impedance measurements (xCELLigence System). INV and LT grow significantly more rapidly than 231 cells. The difference between LT and INV cells is also highly significant (p <0.0001 for all comparisons).
Figure 3
Figure 3. Analysis of spontaneous and induced apoptosis
Spontaneous (Control) and with 250μM or 500μM H2O2 induced apoptosis A. and necrosis B. were measured by flow cytometry after Annexin-V-FLUOS staining of 231, INV and LT cells. INV and LT cells show significantly increased spontaneous apoptosis as compared to 231 cells. The response to superoxide also showed a slight increase that did not reach significance.
Figure 4
Figure 4. Flow cytometric determination of DNA content
231 A, B. INV C, D. and LT E, F. cells were analyzed after DAPI staining for their DNA content. The G1 peak of 231 cells shows 1.3 times the content of normal human lymphocytes (Ly; indicated in panels B,D,F), compatible with reports of the chromosome content of these cells (aneuploid clone 1, AN1). The inclusion of channels over 1000 for cells with higher DNA content (insert in B) shows the presence of a small population with higher DNA content approximately twice that of the G2/M phase of AN1 (aneuploidy clone 2, AN2). The AN1 population is shown in green, the AN2 population in yellow. Both populations show their G1 and G2/M peaks. The panels B,D and F show the same analysis with the addition of human female lymphocytes with the normal diploid human genome for comparison.
Figure 5
Figure 5. Virtual karyotyping
A. The virtual karyotype obtained through SNP-array analysis is shown for LT, INV and 231 cells. Blue bars above the chromosome scheme indicate regions of copy number gain, red bars below them indicate copy number loss. Bars are from top to bottom: LT, INV, 231 cells. In addition to several minor differences a major difference between INV and LT cells as compared to 231 cells is observed for chromosome 5p where 231 cells show a copy number gain that is not observed for the other two populations. B. ArrayCGH diagram of chromosome 5 for (from top to bottom) 231, INV, and LT cells as well as for DNA obtained from nuclei of LT cells after flow cytometric isolation of the AN2 population. The whole chromosome 5 except for the distal half of the short arm 5p shows a copy number gain in all cells analyzed. Only 231 cells show a gain also for 5p. The diagram shows (from top to bottom) the coordinates of chromosome 5, the banding pattern, the actual copy number values for each single probeset (red dots), the deduced copy number applying a 10 SNP window (blue line), the position of the single probesets on the chromosome (vertical bars), the copy numbers of the two alleles (red and black lines), the interpretation (thick bar at the bottom, yellow = copy number 2N, pink = copy number gain).
Figure 6
Figure 6. Response to chemotherapeutic drugs
The effects of Vincristine A. Taxol B. Irinotecan C. Doxorubicin D. Ifosfamide E. 5-Fluorouracile F. Mitoxantrone G. and Cisplatin H. were assessed for 231 and LT cells. IC50 [μM] values are shown. LT cells showed a significantly increased sensitivity to Vincristine and Irinotecan (response index 0.06 and 0.58, respectively) and were more resistant to Ifosfamide (RI=2.38). LT cells also show a slightly reduced sensitivity to 5-Fluorouracile as compared to 231 cells. No significant differences were observed for the other drugs.
Figure 7
Figure 7. Gene expression profiling of 231 and LT cells
A. Microarray gene expression profiles of 231 and LT cells were analyzed using SAM statistics. The expression values for significantly differentially expressed genes were clustered using hierarchical clustering (Pearson correlation distance measure, average linkage). Each column represents a single replicate of 231 or LT cells, each row represents a single probeset. Genes with expression values over the mean are shown in red, those with values below the mean in blue, mean = white. Clearly distinct expression patterns are observed for the two cell populations. B. The analysis of the genes from chromosome 5p among the significantly differentially expressed genes shows that most of them show reduced expression (left side of the axis) in LT cells as compared to 231 cells in concordance with the observed copy number gain in 231 cells. C. The analysis of bona fide targets of the inflammatory transcription factor NFkB among the genes that are significantly differentially expressed in LT cells shows that 12 of them are upregulated and 11 are down-regulated in LT cells as compared to 231 cells. D. The comparison of the genes differentially expressed in 231 cells with genes differentially expressed in apocrine breast cancers as compared to breast cancer of different subtypes [32] shows 428 genes that are common in both gene lists.
Figure 8
Figure 8. NFkB target validation
A. Venn diagram of genes up- and down-regulated in LT versus 231 cells showing the overlap with experimentally validated NFkB target genes. B. Semi-quantitative real time PCR validation of the expression of the chemokines CXCL1 and -2, CCL2 and of COX2 (PTGS2) that are regulated by NFkB. C. Semi-quantitative real time PCR validation of MMP1 and MMP3 expression. D. Validation of MMP1 expression by Western blotting (loading controls: Poinceau red staining of the blot and β-actin Western blot). E. Zymography of serum free cell supernatants on gelatin containing gels. Standard = purified MMP1.
Figure 9
Figure 9. Expression of the metastasis suppressor KISS1
Figure 10
Figure 10. Cell populations ex vivo
Flow cytometric analysis of the DNA content of cells isolated from tumors formed in nude mice after injection of LT cells. The cell population with a high DI index (AN2) was drastically reduced in the tumors grown in vivo as compared to the population injected indicating that this population is less tumorigenic.

References

    1. Vogelstein B, Fearon ER, Hamilton SR, Kern SE, Preisinger AC, Leppert M, Nakamura Y, White R, Smits AM, Bos JL. Genetic alterations during colorectal-tumor development. N Engl J Med. 1988;319:525–532. - PubMed
    1. Allred DC, Mohsin SK, Fuqua SA. Histological and biological evolution of human premalignant breast disease. Endocr Relat Cancer. 2001;8:47–61. - PubMed
    1. Lee S, Stewart S, Nagtegaal I, Luo J, Wu Y, Colditz G, Medina D, Allred DC. Differentially Expressed Genes Regulating the Progression of Ductal Carcinoma in Situ to Invasive Breast Cancer. Cancer Res. 2012 - PMC - PubMed
    1. Ma XJ, Salunga R, Tuggle JT, Gaudet J, Enright E, McQuary P, Payette T, Pistone M, Stecker K, Zhang BM, Zhou YX, Varnholt H, Smith B, et al. Gene expression profiles of human breast cancer progression. Proc Natl Acad Sci U S A. 2003;100:5974–5979. - PMC - PubMed
    1. Weigelt B, Hu Z, He X, Livasy C, Carey LA, Ewend MG, Glas AM, Perou CM, Van't Veer LJ. Molecular portraits and 70-gene prognosis signature are preserved throughout the metastatic process of breast cancer. Cancer Res. 2005;65:9155–9158. - PubMed

MeSH terms