. 2016 Dec 1;116(6):2594-2603.
doi: 10.1152/jn.00499.2016. Epub 2016 Sep 14.

Slow gamma rhythms in CA3 are entrained by slow gamma activity in the dentate gyrus

Affiliations

Slow gamma rhythms in CA3 are entrained by slow gamma activity in the dentate gyrus

Yi-Tse Hsiao et al. J Neurophysiol. .

Abstract

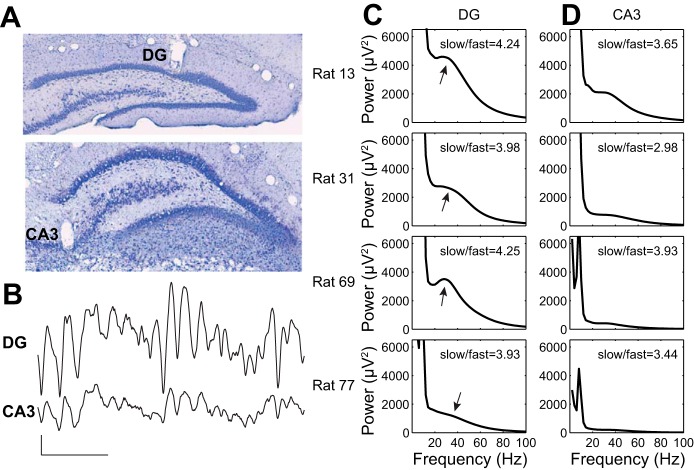
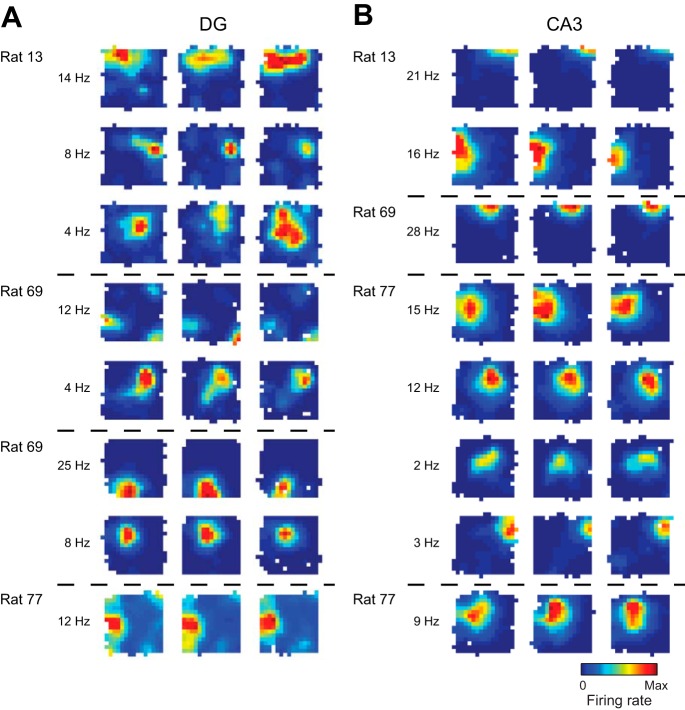
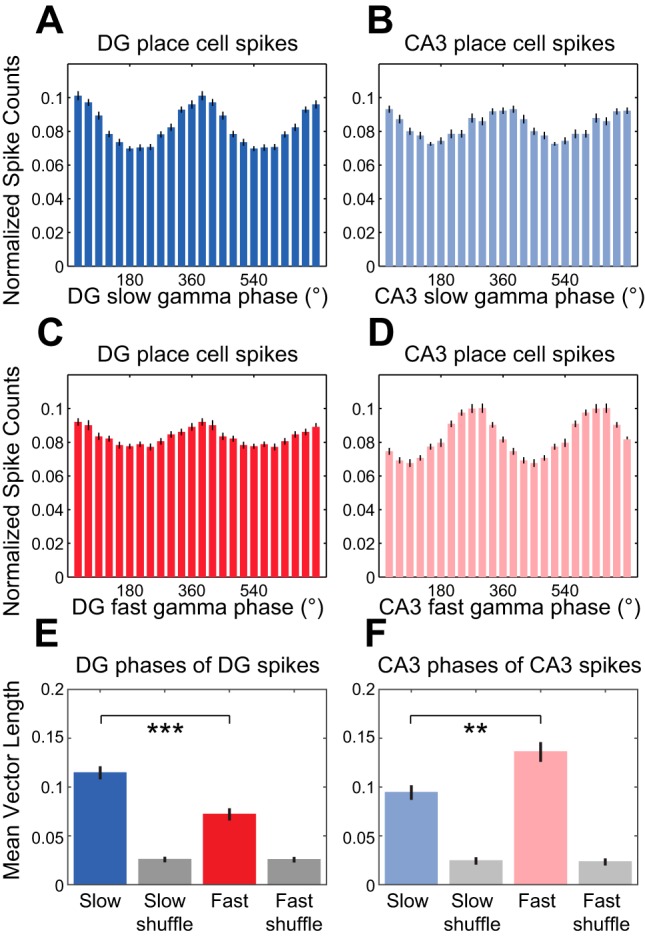
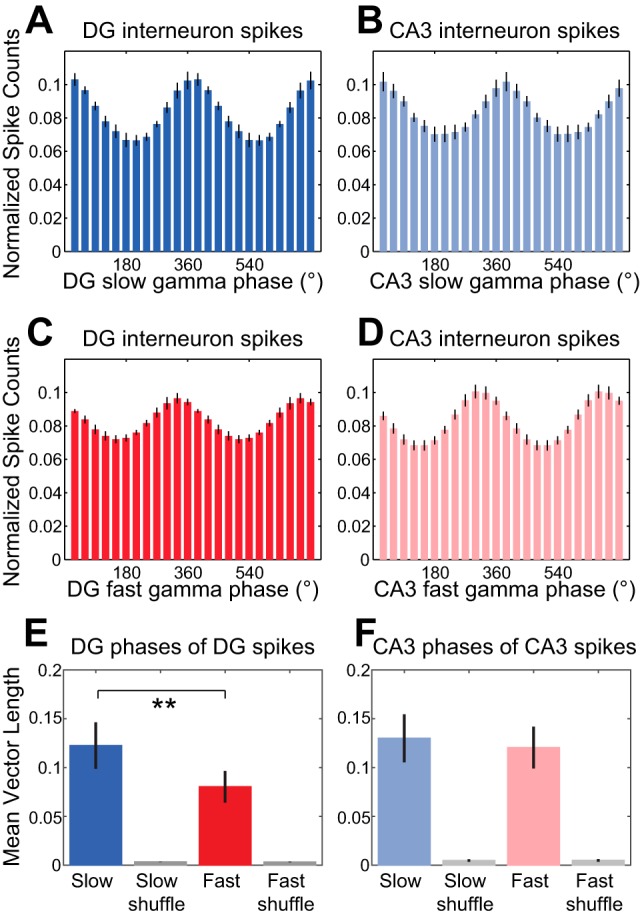
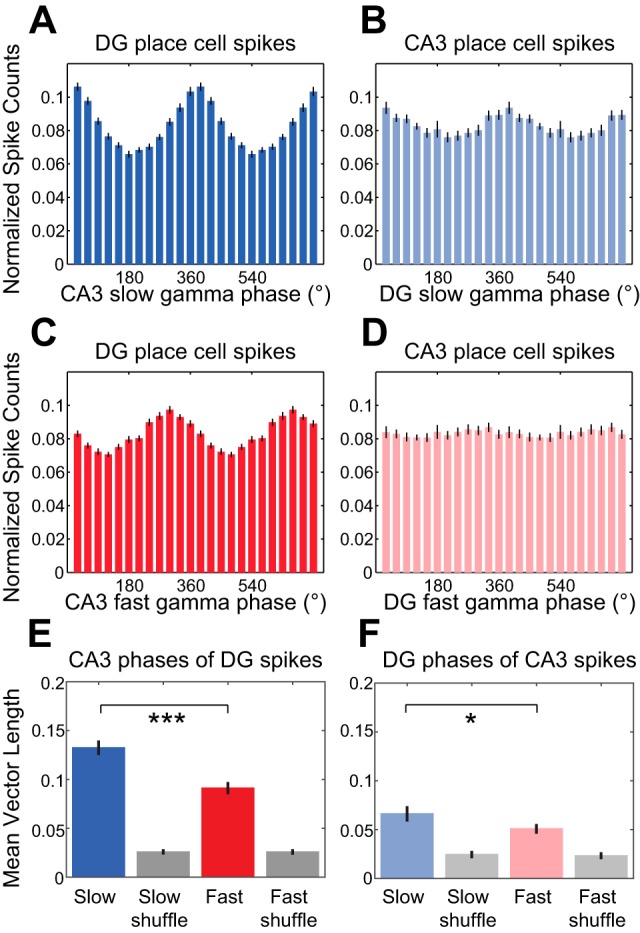
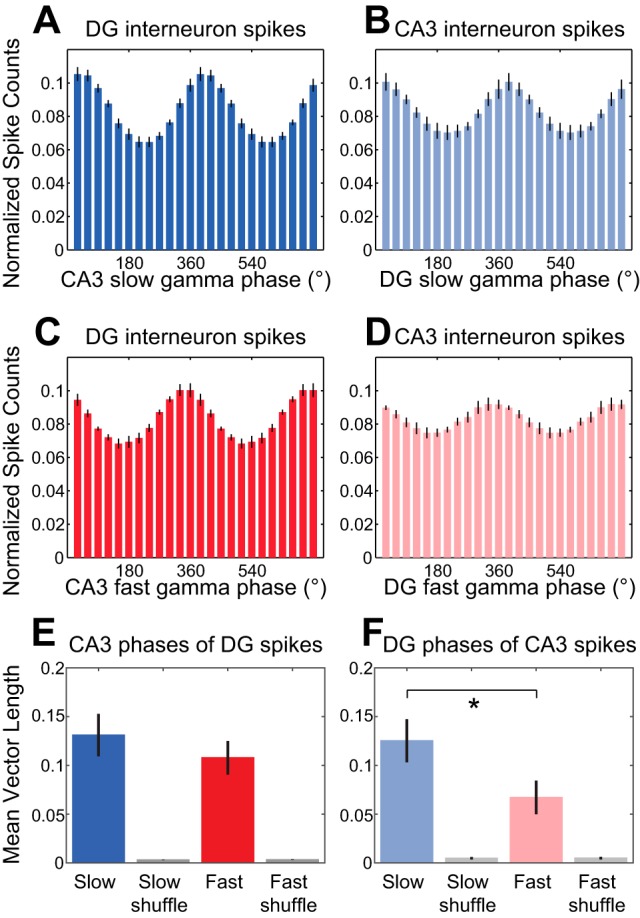
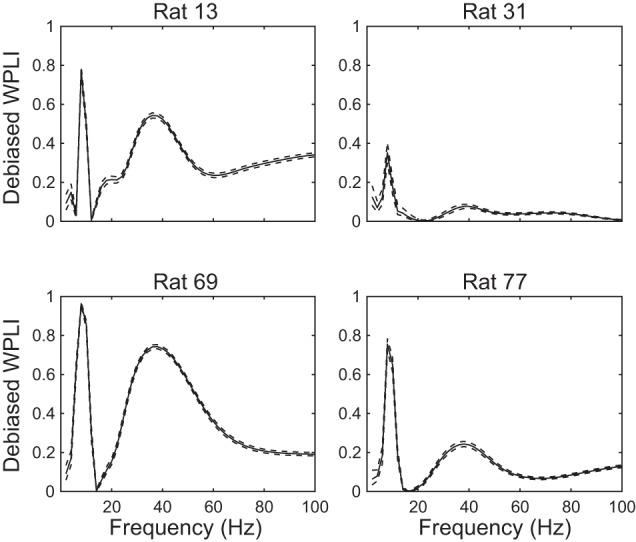
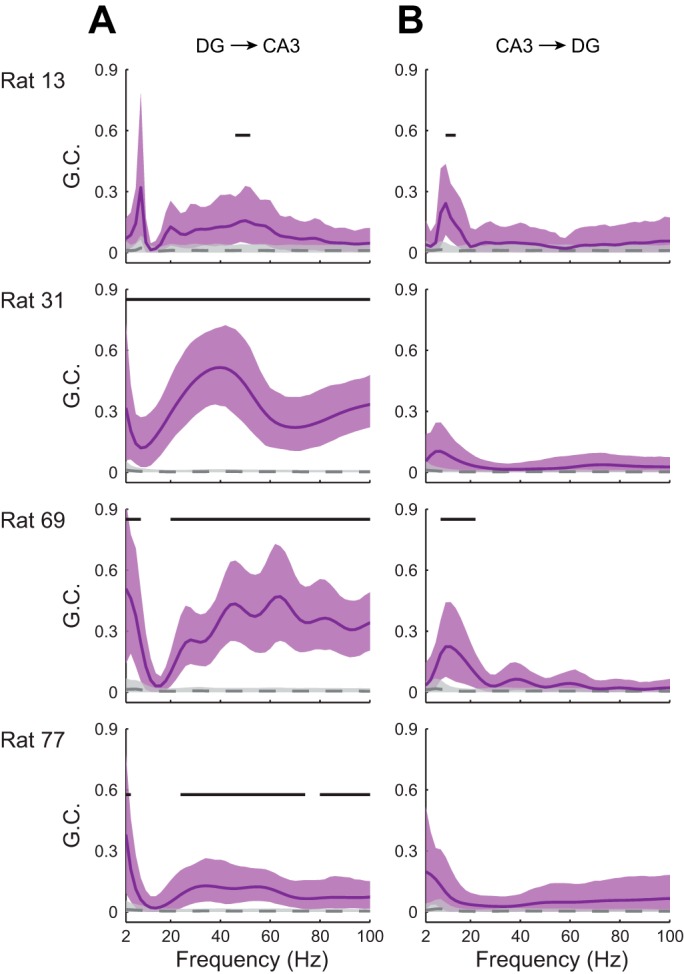
In hippocampal area CA1, slow (∼25-55 Hz) and fast (∼60-100 Hz) gamma rhythms are coupled with different CA1 afferents. CA1 slow gamma is coupled to inputs from CA3, and CA1 fast gamma is coupled to inputs from the medial entorhinal cortex (Colgin LL, Denninger T, Fyhn M, Hafting T, Bonnevie T, Jensen O, Moser MB, Moser EI. Nature 462: 353-357, 2009). CA3 gives rise to highly divergent associational projections, and it is possible that reverberating activity in these connections generates slow gamma rhythms in the hippocampus. However, hippocampal gamma is maximal upstream of CA3, in the dentate gyrus (DG) region (Bragin A, Jando G, Nadasdy Z, Hetke J, Wise K, Buzsaki G. J Neurosci 15: 47-60, 1995). Thus it is possible that slow gamma in CA3 is driven by inputs from DG, yet few studies have examined slow and fast gamma rhythms in DG recordings. Here we investigated slow and fast gamma rhythms in paired recordings from DG and CA3 in freely moving rats to determine whether slow and fast gamma rhythms in CA3 are entrained by DG. We found that slow gamma rhythms, as opposed to fast gamma rhythms, were particularly prominent in DG. We investigated directional causal influences between DG and CA3 by Granger causality analysis and found that DG slow gamma influences CA3 slow gamma. Moreover, DG place cell spikes were strongly phase-locked to CA3 slow gamma rhythms, suggesting that DG excitatory projections to CA3 may underlie this directional influence. These results indicate that slow gamma rhythms do not originate in CA3 but rather slow gamma activity upstream in DG entrains slow gamma rhythms in CA3.

Keywords: CA3; dentate gyrus; gamma rhythms.


Figures

Fig. 1.
Fig. 1.
Paired recordings from DG and CA3 in freely behaving rats. A: example histological sections showing recording sites in DG and CA3. B: example pair of recordings from DG and CA3. Scale bars: 100 ms, 0.4 mV. C: DG power spectra from the 4 rats in the study. For each, the ratio of slow gamma power to fast gamma power is indicated. Arrows indicate slow gamma peaks or shoulders in the spectra. D: power spectra from simultaneous recordings from CA3 in the 4 rats. Again, the ratio of slow gamma power to fast gamma power is indicated for each recording.
Fig. 2.
Fig. 2.
Example place cell rate maps from DG and CA3. For each region, color-coded firing rate maps are shown for 4 example tetrodes from 4 different recording days for 3 different rats (the 4th rat in the study ran on a linear track, not in the open field apparatus). For each example, place maps for all place cells that were detected on a given tetrode are shown across the 3 recording sessions. For each example cell, maps are shown scaled to the peak firing rate across all 3 sessions (red indicates peak rate and dark blue indicates no firing). White pixels indicate areas that were not sufficiently visited during the session. The peak firing rate across the 3 sessions for each cell is presented on left of maps. Dashed horizontal lines separate cells from different tetrodes recorded on different days.
Fig. 3.
Fig. 3.
Phase-locking of DG and CA3 place cell spikes to local slow and fast gamma rhythms. A–D: spike counts were normalized and averaged across cells. Histograms show DG place cell spike counts across DG slow gamma phases (A), CA3 place cell spike counts across CA3 slow gamma phases (B), DG place cell spike counts across DG fast gamma phases (C), and CA3 place cell spike counts across CA3 fast gamma phases (D). E: group data showing averaged mean vector lengths of DG slow and fast gamma phase distributions for DG place cell spikes. Grouped mean vector lengths for phase distributions from shuffled data are shown in gray. F: same as E for CA3 slow and fast gamma phases of CA3 place cell spikes. **P ≤ 0.01, ***P < 0.001.
Fig. 4.
Fig. 4.
Phase-locking of DG and CA3 interneuron spikes to local slow and fast gamma rhythms. A–D: spike counts were normalized and averaged across cells. Histograms show DG interneuron spike counts across DG slow gamma phases (A), CA3 interneuron spike counts across CA3 slow gamma phases (B), DG interneuron spike counts across DG fast gamma phases (C), and CA3 interneuron spike counts across CA3 fast gamma phases (D). E: group data showing averaged mean vector lengths of DG slow and fast gamma phase distributions for DG interneuron spikes. Grouped mean vector lengths for phase distributions from shuffled data are shown in gray. F: same as E for CA3 slow and fast gamma phases of CA3 interneuron spikes. **P ≤ 0.01.
Fig. 5.
Fig. 5.
Phase estimates of nonlocal slow and fast gamma rhythms at DG and CA3 place cell spike times. A–D: spike counts were normalized and averaged across cells. Histograms show DG place cell spike counts across CA3 slow gamma phases (A), CA3 place cell spike counts across DG slow gamma phases (B), DG place cell spike counts across CA3 fast gamma phases (C), and CA3 place cell spike counts across DG fast gamma phases (D). E: group data showing averaged mean vector lengths of CA3 slow and fast gamma phase distributions for DG place cell spikes. Corresponding measures calculated from shuffled data are shown in gray. F: same as E for DG slow and fast gamma phases of CA3 place cell spikes. *P < 0.05, ***P < 0.001.
Fig. 6.
Fig. 6.
Phase estimates of nonlocal slow and fast gamma rhythms at DG and CA3 interneuron spike times. A–D: spike counts were normalized and averaged across cells. Histograms show DG interneuron spike counts across CA3 slow gamma phases (A), CA3 interneuron spike counts across DG slow gamma phases (B), DG interneuron spike counts across CA3 fast gamma phases (C), and CA3 interneuron spike counts across DG fast gamma phases (D). E: group data showing averaged mean vector lengths of CA3 slow and fast gamma phase distributions for DG interneuron spikes. Corresponding measures calculated from shuffled data are shown in gray. F: same as E for DG slow and fast gamma phases of CA3 interneuron spikes. *P < 0.05.
Fig. 7.
Fig. 7.
Phase synchronization across paired DG-CA3 recordings from the 4 rats in this study. Debiased WPLI measures show that theta and slow gamma phases are consistently correlated across DG and CA3 for all 4 rats. Note that slow gamma phase synchronization was greater than fast gamma phase synchronization for all 4 rats. Solid lines indicate mean WPLI, and dashed lines indicate 95% confidence intervals.
Fig. 8.
Fig. 8.
Directed interactions between DG and CA3 rhythmic activity for the 4 rats in this study. Directional influences were estimated with Granger causality. Granger causality estimates (GC) for original and surrogate data sets (see materials and methods) are depicted in purple and gray, respectively. Solid lines (original data) and dashed lines (surrogate data) indicate mean Granger causality, and shaded areas indicate 95% confidence intervals. Horizontal bars indicate frequency ranges exhibiting significant Granger causality. A: directional influences of DG rhythmic activity on CA3 rhythmic activity. B: directional influences of CA3 rhythmic activity on DG rhythmic activity.

References

    1. Acquas E, Wilson C, Fibiger HC. Conditioned and unconditioned stimuli increase frontal cortical and hippocampal acetylcholine release: effects of novelty, habituation, and fear. J Neurosci 16: 3089–3096, 1996. - PMC - PubMed
    1. Ahmed OJ, Mehta MR. Running speed alters the frequency of hippocampal gamma oscillations. J Neurosci 32: 7373–7383, 2012. - PMC - PubMed
    1. Barnett L, Seth AK. The MVGC multivariate Granger causality toolbox: a new approach to Granger-causal inference. J Neurosci Methods 223: 50–68, 2014. - PubMed
    1. Bieri KW, Bobbitt KN, Colgin LL. Slow and fast gamma rhythms coordinate different spatial coding modes in hippocampal place cells. Neuron 82: 670–681, 2014. - PMC - PubMed
    1. Bokil H, Andrews P, Kulkarni JE, Mehta S, Mitra PP. Chronux: a platform for analyzing neural signals. J Neurosci Methods 192: 146–151, 2010. - PMC - PubMed

Publication types

LinkOut - more resources