

The electron donating capacity of biochar is dramatically underestimated
- PMID: 27628746
- PMCID: PMC5024093
- DOI: 10.1038/srep32870
The electron donating capacity of biochar is dramatically underestimated
Abstract
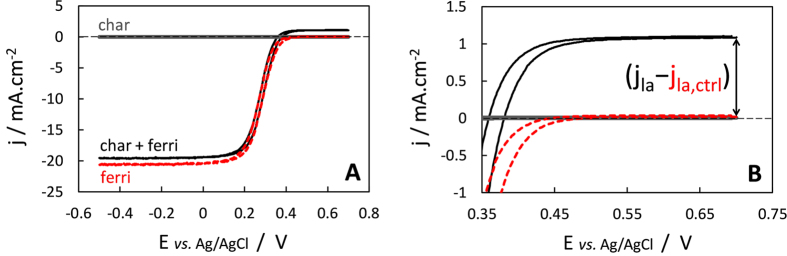
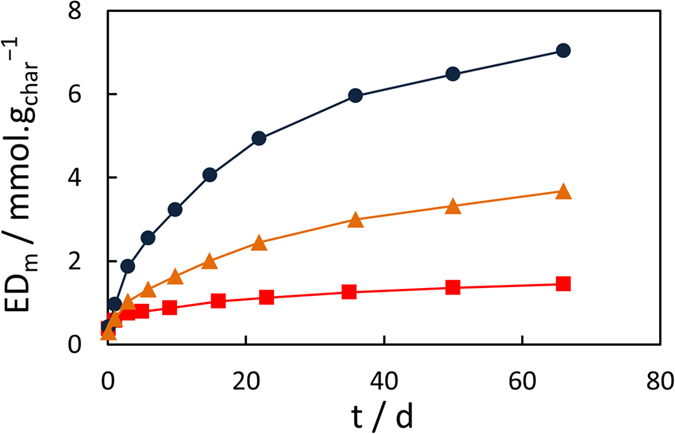
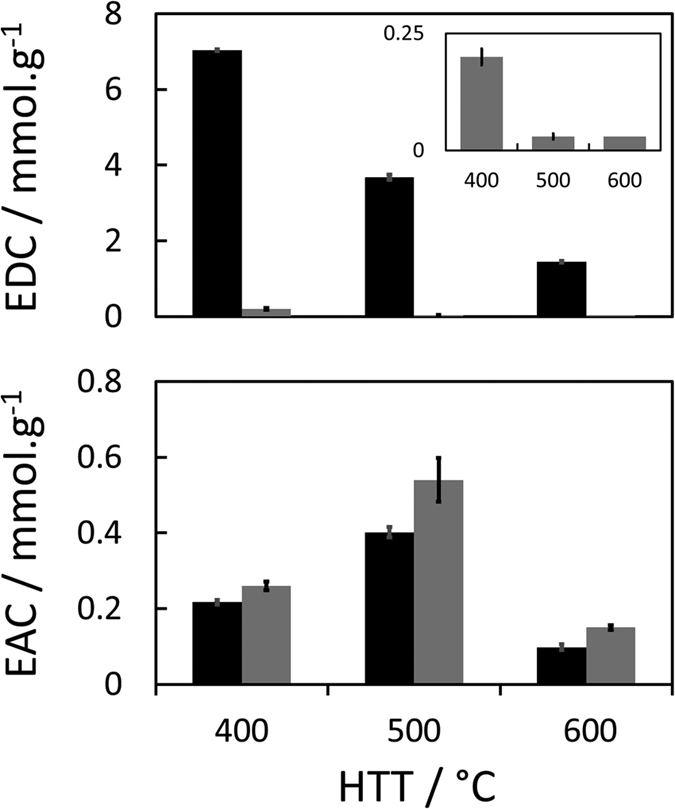
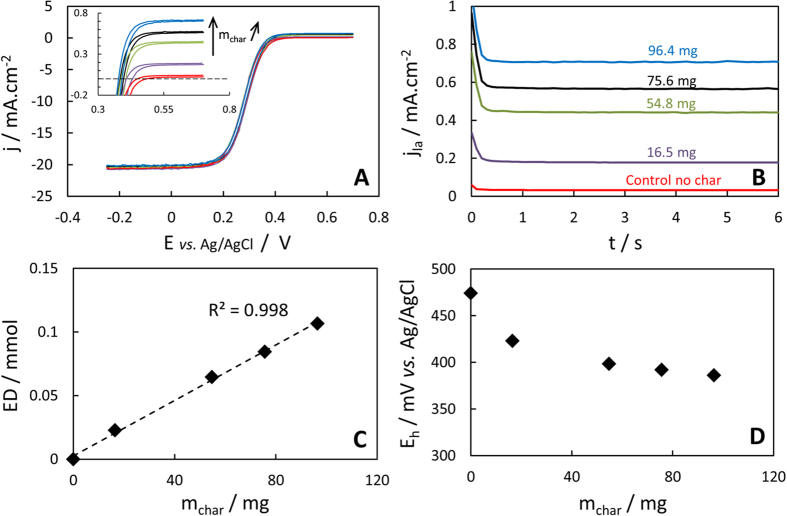
Biochars have gathered considerable interest for agronomic and engineering applications. In addition to their high sorption ability, biochars have been shown to accept or donate considerable amounts of electrons to/from their environment via abiotic or microbial processes. Here, we measured the electron accepting (EAC) and electron donating (EDC) capacities of wood-based biochars pyrolyzed at three different highest treatment temperatures (HTTs: 400, 500, 600 °C) via hydrodynamic electrochemical techniques using a rotating disc electrode. EACs and EDCs varied with HTT in accordance with a previous report with a maximal EAC at 500 °C (0.4 mmol(e(-)).gchar(-1)) and a large decrease of EDC with HTT. However, while we monitored similar EAC values than in the preceding study, we show that the EDCs have been underestimated by at least 1 order of magnitude, up to 7 mmol(e(-)).gchar(-1) for a HTT of 400 °C. We attribute this existing underestimation to unnoticed slow kinetics of electron transfer from biochars to the dissolved redox mediators used in the monitoring. The EDC of other soil organic constituents such as humic substances may also have been underestimated. These results imply that the redox properties of biochars may have a much bigger impact on soil biogeochemical processes than previously conjectured.
Figures
References
-
- Lehmann J. & Joseph S. Biochar for Environmental Management: Science, Technology and Implementation (2nd ed.) (Routledge, Abingdon, UK, 2015).
-
- Xie T., Reddy K. R., Wang C., Yargicoglu E. & Spokas K. Characteristics and Applications of Biochar for Environmental Remediation: A Review. Crit. Rev. Environ. Sci. Technol. 45, 939–969 (2015).
-
- Novak J. M. et al.. Impact of biochar amendment on fertility of a southeastern coastal plain soil. Soil science 174, 105–112 (2009).
-
- Van Zwieten L. et al.. Effects of biochar from slow pyrolysis of papermill waste on agronomic performance and soil fertility. Plant Soil 327, 235–246 (2010).
-
- Nguyen B. T. & Lehmann J. Black carbon decomposition under varying water regimes. Org. Geochem. 40, 846–853 (2009).
Publication types
MeSH terms
Substances
LinkOut - more resources
Full Text Sources
Other Literature Sources
