. 2016 Sep 14;283(1838):20161312.
doi: 10.1098/rspb.2016.1312.

Explaining the geographical origins of seasonal influenza A (H3N2)

Affiliations

Explaining the geographical origins of seasonal influenza A (H3N2)

Frank Wen et al. Proc Biol Sci. .

Abstract

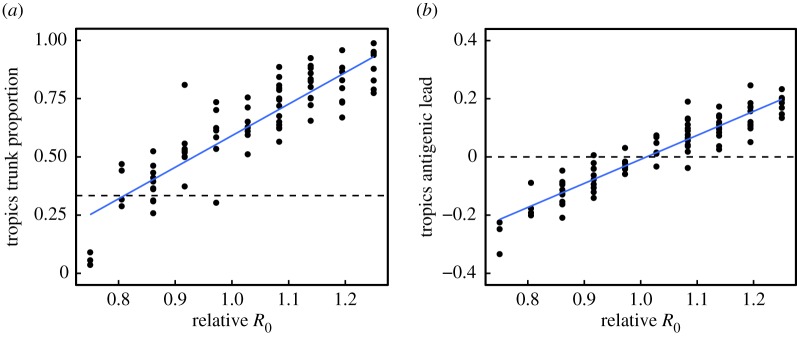
Most antigenically novel and evolutionarily successful strains of seasonal influenza A (H3N2) originate in East, South and Southeast Asia. To understand this pattern, we simulated the ecological and evolutionary dynamics of influenza in a host metapopulation representing the temperate north, tropics and temperate south. Although seasonality and air traffic are frequently used to explain global migratory patterns of influenza, we find that other factors may have a comparable or greater impact. Notably, a region's basic reproductive number (R0) strongly affects the antigenic evolution of its viral population and the probability that its strains will spread and fix globally: a 17-28% higher R0 in one region can explain the observed patterns. Seasonality, in contrast, increases the probability that a tropical (less seasonal) population will export evolutionarily successful strains but alone does not predict that these strains will be antigenically advanced. The relative sizes of different host populations, their birth and death rates, and the region in which H3N2 first appears affect influenza's phylogeography in different but relatively minor ways. These results suggest general principles that dictate the spatial dynamics of antigenically evolving pathogens and offer predictions for how changes in human ecology might affect influenza evolution.

Keywords: R0; molecular epidemiology; source–sink; viral migration.


Figures

Figure 1.
Figure 1.
Representative output showing influenza-like behaviour from a sample simulation using the default parameters (table 2). Statistics reported here are based on 53 replicate simulations. (a) The phylogeny of the pathogen is reconstructed explicitly from the recorded ancestry of simulated strains. Branches are coloured by region indicated in panel (d). The trunk is determined by tracing the recorded ancestry of surviving strains at the end of the simulation. Side branches show lineages that go extinct. (b) Viruses evolve antigenically away from the founding strain in a canalized manner. On average, the antigenic distance from the founding strain follows the trajectory indicated by the black LOESS spline fitted to viruses from all three regions. At any given point in time, strains above this line have drifted farther from the founder compared with average, and are thus considered antigenically leading. Conversely, strains below this line are considered antigenically lagging. Antigenic lead is calculated as the distance to the spline in antigenic units. (c) Prevalence of infection over time for each region. (d) Depiction of the totally connected model population, composed of the temperate north, tropics and temperate south.
Figure 2.
Figure 2.
Seasonal amplitude ε in the temperate populations increases the tropics' contribution to the most evolutionarily successful lineage but alone does not affect regional differences in antigenic advancement. Transmission rates β in the temperate north and south oscillate sinusoidally in opposite phase, with amplitude ε. All other parameters remain at their default values (table 2). (a) Effects of seasonality on the fraction of the trunk in the tropics (Pearson's r = 0.85, p < 0.001; R2 = 0.72). Each point shows the fraction of time that the phylogenetic trunk was located in the tropics during the course of one simulation. The dashed line represents the null hypothesis where tropical strains comprise one-third of the phylogenetic trunk. (b) Effects on seasonality on the antigenic lead of the tropics (Pearson's r = −0.12, p = 0.20, R2 = 0.01). Each point shows the average antigenic lead of tropical strains over time from one simulation. The dashed line represents the null hypothesis where tropical strains are neither antigenically ahead or behind. Blue lines represent linear least-squares regression.
Figure 3.
Figure 3.
Increased R0 in the tropics increases the tropics' contribution to the most evolutionarily successful lineage and the antigenic advancement of tropical strains. Relative R0 is calculated as R0 in the tropics divided by R0 in the temperate regions. R0 in the tropics was varied while R0 in the temperate regions was kept at its default. Other parameters were also kept at their default values (table 2). (a) Effect of R0 in the tropics on the fraction of the trunk in the tropics (Pearson's r = 0.88, p < 0.001; R2 = 0.78). Each point shows the fraction of phylogenetic trunk located in the tropics during one simulation. The dashed line represents the null hypothesis where tropical strains comprise one-third of the phylogenetic trunk. (b) Effect of R0 in the tropics on the antigenic lead in the tropics (Pearson's r = 0.93, p < 0.001; R2 = 0.87). Each point shows the average antigenic lead of tropical strains over time from one simulation. The dashed line represents the null hypothesis where tropical strains are neither antigenically ahead or behind. Blue lines represent linear least-squares regression.
Figure 4.
Figure 4.
Seasonality in temperate populations has an equalizing effect on antigenic differences. Relative R0 is calculated as R0 in the tropics divided by R0 in the temperate regions. (a) Effects of seasonality and R0 on the fraction of the trunk in the tropics. Blue indicates that the phylogenetic trunk is located in the tropics less than one-third of the time, and red indicates that the trunk is in the tropics more than one-third of the time. (b) Effects of seasonality and R0 on antigenic lead in the tropics. Blue indicates that tropical strains are on average ahead antigenically relative to other global strains and red indicates that tropical strains are behind antigenically. Each square averages 1–17 replicate simulations.

References

    1. Shortridge KF, Stuart-Harris CH. 1982. An influenza epicentre? Lancet 320, 812–813. ( 10.1016/S0140-6736(82)92693-9) - DOI - PubMed
    1. Webster RG, Bean WJ, Gorman OT, Chambers TM, Kawaoka Y. 1992. Evolution and ecology of influenza A viruses. Microbiol. Rev. 56, 152–179. - PMC - PubMed
    1. Cox NJ, Brammer TL, Regnery HL. 1994. Influenza: global surveillance for epidemic and pandemic variants. Eur. J. Epidemiol. 10, 467–470. ( 10.1007/bf01719678) - DOI - PubMed
    1. Cox NJ, Subbarao K. 2000. Global epidemiology of influenza: past and present. Annu. Rev. Med. 51, 407–421. ( 10.1146/annurev.med.51.1.407) - DOI - PubMed
    1. World Health Organization. 2016 FluNet, global influenza surveillance and response system (GISRS). See www.who.int/flunet.