. 2017 Jul;37(7):2485-2493.
doi: 10.1177/0271678X16669366. Epub 2016 Jan 1.

Inverse relationship between brain glucose and ketone metabolism in adults during short-term moderate dietary ketosis: A dual tracer quantitative positron emission tomography study

Affiliations

Inverse relationship between brain glucose and ketone metabolism in adults during short-term moderate dietary ketosis: A dual tracer quantitative positron emission tomography study

Alexandre Courchesne-Loyer et al. J Cereb Blood Flow Metab. 2017 Jul.

Abstract

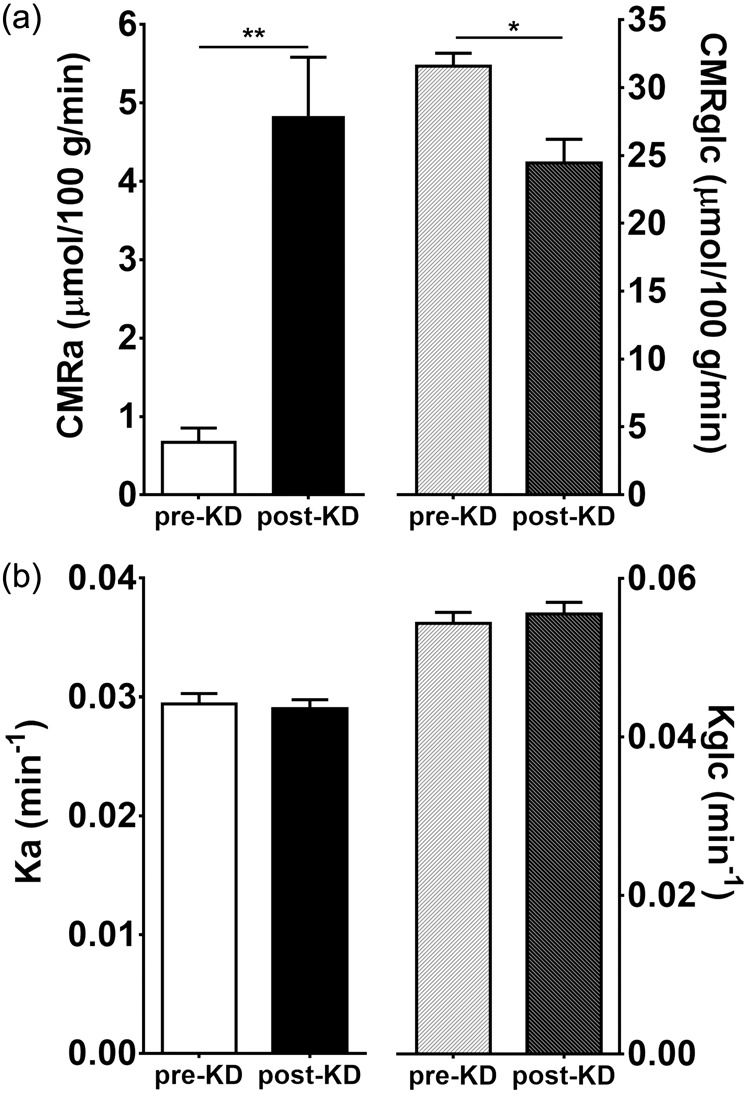
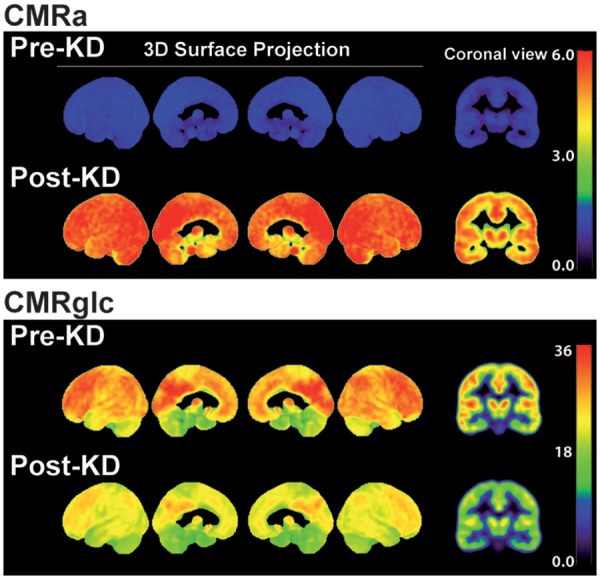
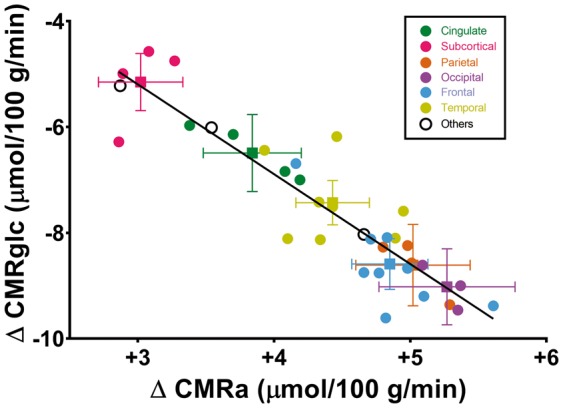
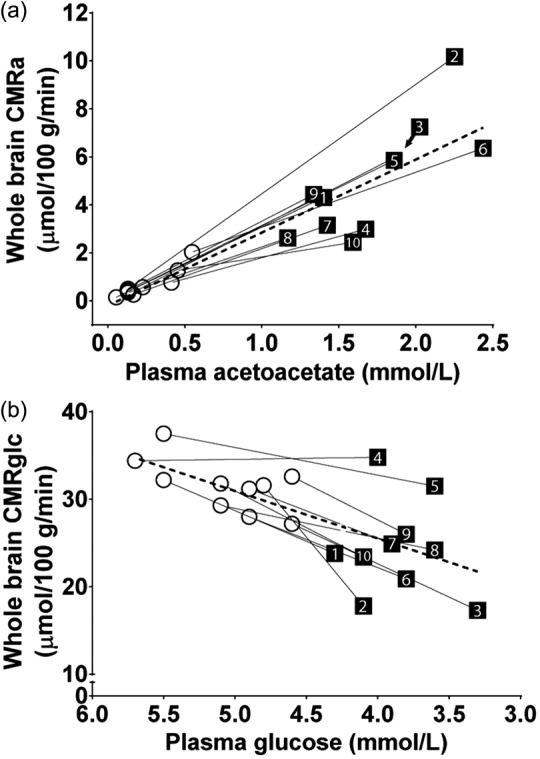
Ketones (principally β-hydroxybutyrate and acetoacetate (AcAc)) are an important alternative fuel to glucose for the human brain, but their utilisation by the brain remains poorly understood. Our objective was to use positron emission tomography (PET) to assess the impact of diet-induced moderate ketosis on cerebral metabolic rate of acetoacetate (CMRa) and glucose (CMRglc) in healthy adults. Ten participants (35 ± 15 y) received a very high fat ketogenic diet (KD) (4.5:1; lipid:protein plus carbohydrates) for four days. CMRa and CMRglc were quantified by PET before and after the KD with the tracers, 11C-AcAc and 18F-fluorodeoxyglucose (18F-FDG), respectively. During the KD, plasma ketones increased 8-fold ( p = 0.005) while plasma glucose decreased by 24% ( p = 0.005). CMRa increased 6-fold ( p = 0.005), whereas CMRglc decreased by 20% ( p = 0.014) on the KD. Plasma ketones were positively correlated with CMRa (r = 0.93; p < 0.0001). After four days on the KD, CMRa represented 17% of whole brain energy requirements in healthy adults with a 2-fold difference across brain regions (12-24%). The CMR of ketones (AcAc and β-hydroxybutyrate combined) while on the KD was estimated to represent about 33% of brain energy requirements or approximately double the CMRa. Whether increased ketone availability raises CMR of ketones to the same extent in older people as observed here or in conditions in which chronic brain glucose hypometabolism is present remains to be determined.

Keywords: Metabolism; acetoacetate; glucose; ketogenic diet; ketone; neuroimaging.


Figures

Figure 1.
Figure 1.
(a) Whole brain cerebral metabolic rates of acetoacetate (CMRa) and glucose (CMRglc) before and after the ketogenic diet (KD). (b) Whole brain rate constants of acetoacetate (Ka) and glucose (Kglc) before and after the KD. Means ± SD; n = 10. *p < 0.05, **p < 0.01; Wilcoxon rank-sum test.
Figure 2.
Figure 2.
(a) Regional increase in cerebral metabolic rate of acetoacetate (CMRa; white bars), and decrease in cerebral metabolic rate of glucose (CMRglc; blue bars). (b) Regional% contribution of ketones to brain metabolism before (pre-KD; yellow bars) and at the end (post-KD; black bars) of four days on a ketogenic diet. Means; n = 10/region. Error bars not shown; mean SD for all 35 regions were 4.2 and 2.5 µmol/100 g/min (CMRglc and CMRa respectively; (a)) and 1.9 and 9.0% (pre-KD and post-KD, respectively; (b)). Repeated measures two-way ANOVA were used to assess the differences between regions; significant at p < 0.05. Brain regions: (1) caudate; (2) white matter; (3) hippocampus; (4) putamen; (5) thalamus; (6) rostral anterior cingulate; (7) insula; (8) caudal anterior cingulate; (9) parahippocampus; (10) posterior cingulate; (11) transverse temporal; (12) medial orbital frontal; (13) isthmus cingulate; (14) fusiform; (15) superior temporal; (16) temporal pole; (17) entorhinal; (18) grey matter; (19) precentral; (20) lateral orbital frontal; (21) superior frontal; (22) supramarginal; (23) caudal middle frontal; (24) paracentral; (25) middle temporal; (26) inferior temporal; (27) inferior parietal; (28) inferior frontal; (29) precuneus; (30) lingual; (31) rostral middle frontal; (32) superior parietal; (33) cuneus; (34) lateral occipital; (35) frontal pole.
Figure 3.
Figure 3.
Voxel-wise three-dimensional view of the medial and lateral brain surfaces and a representative coronal slice showing the cerebral metabolic rate of acetoacetate (CMRa) and glucose (CMRglc) pre- and post-ketogenic diet (KD). Scale is shown on the right (umol/100 g/min).
Figure 4.
Figure 4.
Inverse correlation between the regional change in cerebral metabolic rate of acetoacetate (ΔCMRa) and cerebral metabolic rate of glucose (ΔCMRglc) pre- to post-ketogenic diet (n = 10/data point). Brain regions are grouped by colour as the mean ± SEM of the major anatomic regions (squares) with circles representing the main sub-regions of each major region. Black circles represent (from left to right) overall white matter, the insula and overall grey matter, respectively. The regression equation is y = −1.69x−0.06 (r = −0.91; p < 0.0001).
Figure 5.
Figure 5.
Correlation between whole brain cerebral metabolic rate of acetoacetate (CMRa) and plasma acetoacetate (a), and between whole brain cerebral metabolic rate of glucose (CMRglc) and plasma glucose (b) in each participant (numbered 1 to 10). The dotted lines represent the mean of all 10 participants (A: y = 3.04x + 0.07; r = 0.94; p < 0.0001; B: y = 5.42x − 0.70; r = 0.64; p = 0.002).

References

    1. Garber AJ, Menzel PH, Boden G, et al. Hepatic ketogenesis and gluconeogenesis in humans. J Clin Invest 1974; 54: 981–989. - PMC - PubMed
    1. Foster DW. Studies in the ketosis of fasting. J Clin Invest 1967; 46: 1283–1296. - PMC - PubMed
    1. Neal EG, Chaffe H, Schwartz RH, et al. The ketogenic diet for the treatment of childhood epilepsy: a randomised controlled trial. Lancet Neurol 2008; 7: 500–506. - PubMed
    1. Pascual JM, Liu P, Mao D, et al. Triheptanoin for glucose transporter type I deficiency (G1D): modulation of human ictogenesis, cerebral metabolic rate, and cognitive indices by a food supplement. JAMA Neurol 2014; 71: 1255–1265. - PMC - PubMed
    1. Phelps ME, Huang SC, Hoffman EJ, et al. Tomographic measurement of local cerebral glucose metabolic rate in humans with (F-18)2-fluoro-2-deoxy-D-glucose: validation of method. Ann Neurol 1979; 6: 371–388. - PubMed