. 2016 Sep 15:6:33079.
doi: 10.1038/srep33079.

Amyloid structure exhibits polymorphism on multiple length scales in human brain tissue

Affiliations

Amyloid structure exhibits polymorphism on multiple length scales in human brain tissue

Jiliang Liu et al. Sci Rep. .

Abstract

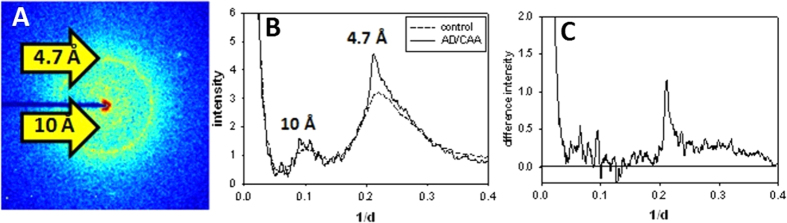
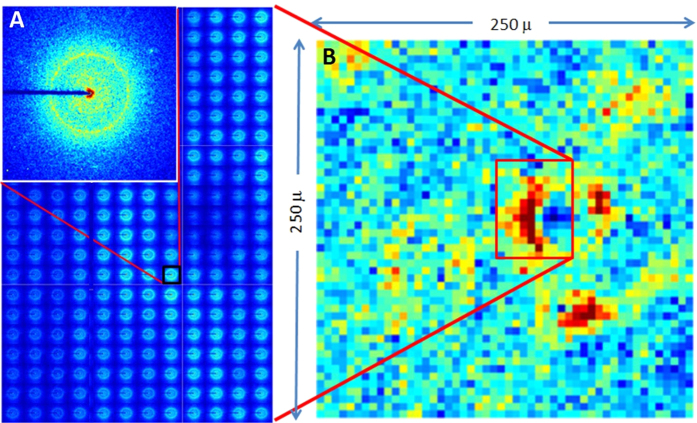
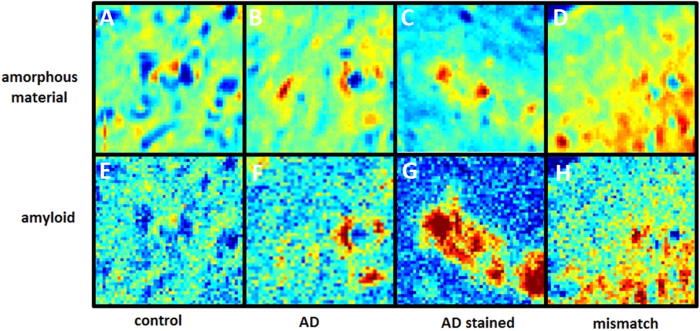
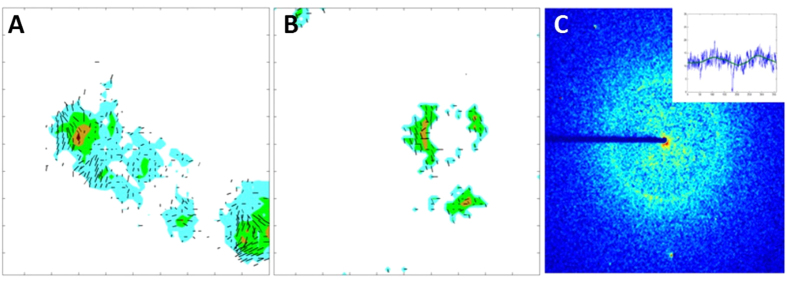
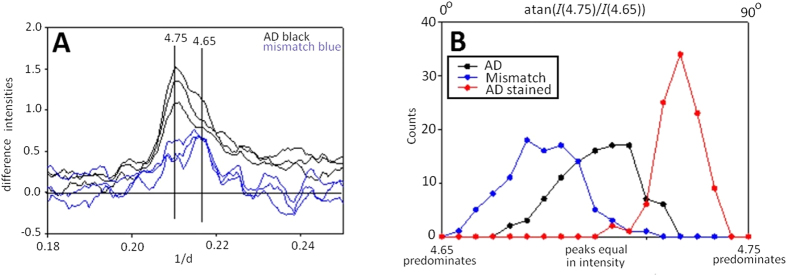
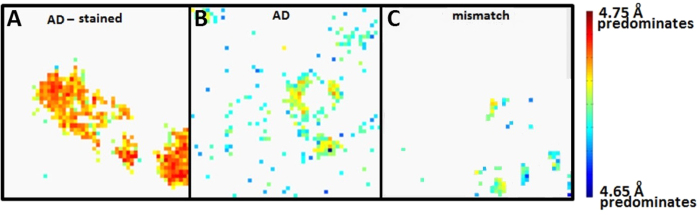
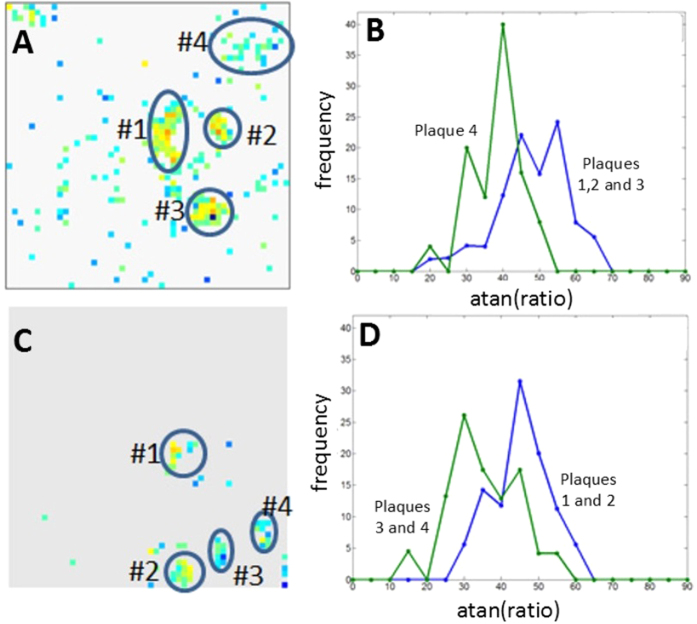
Aggregation of Aβ amyloid fibrils into plaques in the brain is a universal hallmark of Alzheimer's Disease (AD), but whether plaques in different individuals are equivalent is unknown. One possibility is that amyloid fibrils exhibit different structures and different structures may contribute differentially to disease, either within an individual brain or between individuals. However, the occurrence and distribution of structural polymorphisms of amyloid in human brain is poorly documented. Here we use X-ray microdiffraction of histological sections of human tissue to map the abundance, orientation and structural heterogeneities of amyloid. Our observations indicate that (i) tissue derived from subjects with different clinical histories may contain different ensembles of fibrillar structures; (ii) plaques harboring distinct amyloid structures can coexist within a single tissue section and (iii) within individual plaques there is a gradient of fibrillar structure from core to margins. These observations have immediate implications for existing theories on the inception and progression of AD.


Figures

Figure 1
Figure 1. X-ray microdiffraction from thin sections of human brain tissue:
(A) X-ray scattering pattern from a thin section of human AD brain tissue after subtraction of background scattering from mica substrate and air. A sharp reflection from amyloid at ~4.7 Å spacing can be seen as a yellow ring. Diffuse scattering in the 10 Å region can be seen as a yellow halo closer to the center. The dark blue bar to the left is a shadow of the beam stop holder. (B) Circularly averaged intensity of a scattering pattern from tissue containing an amyloid plaque (solid line) and a control region without amyloid (dashed line). (C) Scattering from plaque minus control region.
Figure 2
Figure 2. Scanning microdiffraction data set.
(A) A single diffraction pattern from an amyloid containing region superposed on a montage of 180 diffraction patterns, part of 2500 diffraction patterns collected from a section of AD brain tissue. (B) Mapping of the sharp ~4.7 Å scattering intensity in 2500 patterns collected on a 5 μ grid. Dark blue corresponds to weak scattering; dark red, the strongest 4.7 Å intensity. Field of view includes two amyloid plaques in the margin of a blood vessel, a third plaque 40–50 μ below it and two regions of diffuse amyloid in the upper corners of the field of view.
Figure 3
Figure 3. Distribution of intensity in 10,000 diffraction patterns collected from 250 × 250 μ fields of view in thin sections of human brain tissue.
Each pixel in these images represents the average intensity from one diffraction pattern as calculated from the (top) amorphous scattering in the 4.7 Å region and (bottom) the sharp 4.7 Å reflection from amyloid. Data from samples that include (A,E) an age-matched control; (B,F) typical AD case; (C,G) typical AD case stained with Congo Red; and (D,H) mismatch case. Diffuse scattering intensity (A–D) provides an overall visualization of the distribution of cellular material in each thin section. Dark blue corresponds to regions of very low density including small blood vessels; red corresponds to relatively high density regions. Location of amyloid deposits are indicated by dark red in the lower panels.
Figure 4
Figure 4. Mapping the orientation of fibrils in plaques.
The average direction of orientation of fibrils (as indicated by dark lines - longer lines indicate better orientation) is overlaid on a mapping of the intensity of the 4.7 Å peak (indicated by colors with blue, green, brown and red progressively indicative of stronger scattering). (A) CR stained tissue from an AD subject. (B) Unstained tissue from an AD subject. (C) X-ray pattern from region exhibiting modest orientation – inset is intensity of 4.7 Å scattering as a function of angle about the center of the pattern.
Figure 5
Figure 5. Shape of the 4.7 Å reflection from amyloid plaques in a typical AD subject and in a mismatch case.
(A) The 4.7 Å peak appears as a doublet and the ratio of intensity at ~4.75 Å and 4.65 Å is variable, even within a single amyloid plaque. The variation in ratio is evident in the differences among the three patterns shown from a typical AD subject (black). One pattern has a significantly higher 4.65 Å shoulder than the other two. In scattering from amyloid in the mismatch case (blue), the ratio of intensities is reversed, indicating a different structural organization. (B) The ensemble of structures in the mismatch case is significantly shifted in histograms of the ratio of intensities [plotted as a function of atan(I(4.75 Å)/I(4.65 Å)) - angle whose tangent is the ratio of the intensities of the 4.75 Å and 4.65 Å peaks] for the strongest 4.7 Å peaks in the AD case (black), mismatch (blue) and compared to the Congo Red stained AD case (red). Staining with Congo Red results in a significant strengthening of the 4.75 Å peak relative to the 4.65 Å shoulder.
Figure 6
Figure 6
Mapping of ratio of intensity in the 4.75 Å and 4.65 Å peaks in (A) a typical AD subject - section stained with Congo Red; (B) a typical AD subject with a small blood vessel and no staining; and (C) a mismatch case. Color is coded as atan(I(4.75 Å)/I(4.65 Å)) [angle whose tangent is the ratio of the intensities of the 4.75  Å and 4.65 Å peaks] with red corresponding to 4.75 Å dominating; blue to 4.65 Å dominating and green to equal intensities. 250 × 250 μ fields of view. Regions without color (gray background) are regions with no detectable 4.7  Å peak (intensity of Gaussian peak less than 3 σ- see Methods).
Figure 7
Figure 7
Mapping of ratio of intensity in the 4.75 Å and 4.65 Å peaks in (A) a typical AD subject with a small blood vessel and (C) a mismatch case. (B) contains the average of histograms of the three densest plaques from the AD field of view in (A), compared to the histogram of the diffuse amyloid region (labeled #4). Although there is substantial overlap of the histograms, the 4.75 Å sub-peak dominates in the majority of the dense plaques (I(4.75 Å)/I(4.65 Å) > 1.); the 4.65 Å sub-peak dominates in the diffuse amyloid (I(4.75 Å)/I (4.65 Å)) < 1. (D) contains a histogram of the two diffuse plaques (#3 and #4) in the mismatch case compared to that of the denser plaques observed in this field of view (#1 and #2).

References

    1. Hardy J. & Selkoe D. J. The amyloid hypothesis of Alzheimer’s disease: Progress and problems on the road to therapeutics. Science 297, 353–356 (2002). - PubMed
    1. Selkoe D. J. Resolving controversies on the path to Alzheimer’s therapeutics. Nature medicine, 17, 1060–1065 (2011). - PubMed
    1. Benilova I., Karran E. & De S. B. The toxic Abeta oligomer and Alzheimer’s disease: an emperor in need of clothes. Nat. Neurosci. 15, 349–357 (2012). - PubMed
    1. Price J. L. & Morris J. C. Tangles and plaques in nondemented aging and “preclinical” Alzheimer’s disease. Ann. Neurol. 45, 358–368 (1999). - PubMed
    1. Dickson D. W. et al.. Identification of normal and pathological aging in prospectively studied non-demented elderly humans. Neurobiol. Aging 13, 179–189 (1992). - PubMed

Publication types