. 2016 Sep 14;36(37):9618-32.
doi: 10.1523/JNEUROSCI.0208-16.2016.

The Role of Striatal Feedforward Inhibition in the Maintenance of Absence Seizures

Affiliations

The Role of Striatal Feedforward Inhibition in the Maintenance of Absence Seizures

Takafumi Arakaki et al. J Neurosci. .

Abstract

Absence seizures are characterized by brief interruptions of conscious experience accompanied by oscillations of activity synchronized across many brain areas. Although the dynamics of the thalamocortical circuits are traditionally thought to underlie absence seizures, converging experimental evidence supports the key involvement of the basal ganglia (BG). In this theoretical work, we argue that the BG are essential for the maintenance of absence seizures. To this end, we combine analytical calculations with numerical simulations to investigate a computational model of the BG-thalamo-cortical network. We demonstrate that abnormally strong striatal feedforward inhibition can promote synchronous oscillatory activity that persists in the network over several tens of seconds as observed during seizures. We show that these maintained oscillations result from an interplay between the negative feedback through the cortico-subthalamo-nigral pathway and the striatal feedforward inhibition. The negative feedback promotes epileptic oscillations whereas the striatal feedforward inhibition suppresses the positive feedback provided by the cortico-striato-nigral pathway. Our theory is consistent with experimental evidence regarding the influence of BG on seizures (e.g., with the fact that a pharmacological blockade of the subthalamo-nigral pathway suppresses seizures). It also accounts for the observed strong suppression of the striatal output during seizures. Our theory predicts that well-timed transient excitatory inputs to the cortex advance the termination of absence seizures. In contrast with the thalamocortical theory, it also predicts that reducing the synaptic transmission along the cortico-subthalamo-nigral pathway while keeping constant the average firing rate of substantia nigra pars reticulata reduces the incidence of seizures.

Significance statement: Absence seizures are characterized by brief interruptions of consciousness accompanied by abnormal brain oscillations persisting tens of seconds. Thalamocortical circuits are traditionally thought to underlie absence seizures. However, recent experiments have highlighted the key role of the basal ganglia (BG). This work argues for a novel theory according to which the BG drive the oscillatory patterns of activity occurring during the seizures. It demonstrates that abnormally strong striatal feedforward inhibition promotes synchronous oscillatory activity in the BG-thalamo-cortical network and relate this property to the observed strong suppression of the striatal output during seizures. The theory is compatible with virtually all known experimental results, and it predicts that well-timed transient excitatory inputs to the cortex advance the termination of absence seizures.

Keywords: bistability; computational model; dynamics; fast spiking interneuron; oscillations; spike-and-wave discharges.


Figures

Figure 1.
Figure 1.
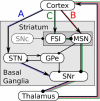
The architecture of the BG-thalamo-cortical network model. The model consists of seven neuronal populations: the pyramidal neurons of the somatosensory cortex, the striatal FSIs, the striatal MSNs, the STN, the SNr, the GPe, and the thalamocortical neurons. The substantia nigra pars compacta (SNc) is not included in the model. The cortical, FSI, MSN, STN, SNr, and thalamic populations are the essential components of our theory. They form three parallel feedback loops: the hyperdirect feedback loop (blue), the direct feedback loop (red), and the feedback loop through FSI (green). Arrows indicate excitatory connections. Dots indicate inhibitory connections. Dashed lines indicate population and connections that are not included in the model. A–C are the gains of the hyperdirect, direct, and “through FSI” feedback loops.
Figure 2.
Figure 2.
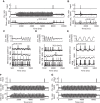
Bistability between asynchronous activity and collective oscillations in the spiking BG-thalamo-cortical network model. A, Simulation of the spiking network model with the parameters in Table 2. The dynamics are bistable: a state in which the neurons in all the populations fire irregularly and asynchronously coexists with a state in which the activity oscillates in synchrony in all the populations. Transient excitatory inputs to the cortex initiate and terminate the oscillations. Top, The external input to the cortex (in mV). Middle, Population average firing rate in the cortex. Bottom, The voltage trace of one MSN. The firing rate of the neuron is low before and after the oscillatory episode and that during this episode the neuron is hyperpolarized and its activity is suppressed. The amplitude and the duration for initiation and termination are 2 mV, 8 ms and 50 ms, respectively. B, Simulation of the spiking network model with the parameters in Table 2, except for the feedforward inhibition, which is reduced by 80% (JMSN FSI = −30 mV). The network dynamics are monostable: the only stable state is the asynchronous state. Panels represent the same quantities as in A. C, Zoom on the dynamics around the initiation of the oscillatory episode in A. Top to bottom, The average cortical population activity, the membrane potentials of one FSI, one MSN, one neuron in the STN, and one neuron in the SNr. The activity of the FSI is very sparse before the initiation of the oscillations and rises rapidly when the transient excitation occurs in the cortex. During the oscillations, the MSN exhibits subthreshold oscillations (dotted line indicates threshold). The SNr neuron does not change its activity level much (25 spikes/s before, 33 spikes/s after), but its firing pattern is burstier during the oscillations. D, Zoom on the dynamics around the termination of the oscillatory episode. Top to bottom, The cortical activity and the membrane potential of one FSI, one MSN, one neuron in the STN, and one neuron in the SNr. The activity of the FSI is bursty before the termination of the oscillatory epoch and is rapidly suppressed when the transient excitation occurs in the cortex. The MSN increases its activity after the end of this epoch. E, Zoom on the dynamics during a seizure. Top to bottom, The cortical activity and the membrane potential of one FSI and one MSN. Bottom, The voltage trace is plotted for one MSN for which the FSI inhibition was selectively blocked, whereas inhibition to all other MSNs was kept intact. The membrane potential of the MSN remains below threshold during the oscillations because of the strong inhibition from FSI. This results in bursting activity, in phase with cortical oscillations. F, G, Transient excitations of the STN (F) or the thalamus (G) can trigger or suppress the oscillations in the bistable regimen. Bottom, Firing rate of these populations. The amplitude and the duration for initiation and termination were 2 mV, 8 ms and 50 ms for STN stimulation (F) and 2.5 mV, 8 ms and 40 ms for thalamic stimulation (G), respectively.
Figure 3.
Figure 3.
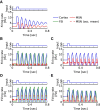
The collective dynamics of the BG-thalamo-cortical rate model depend on the balance between hyperdirect and direct feedback. A, Bifurcation diagram of the network as a function of the gains of the direct and hyperdirect feedback loops. Depending on the balance between the hyperdirect and the direct feedback loops, the dynamics can be monostable or bistable. In the first case, the stationary state can be an FP (B), or an oscillatory state (OSC; C). In the second case, a stable fixed point coexists with stable oscillations (BST; D). The size of the bistable region increases with JMSN FSI. The striped region represents the bistability when feedforward inhibition is blocked (JMSN FSI = 0). This region extends into the gray domain when JMSN FSI = 56 (default). When the gain of the direct feedback loop is too strong an instability that occurs leading to saturation or inactivation of the cortex (U). Solid lines indicate results of the analytical calculations. Dotted lines indicate results of the numerical simulations (see Materials and Methods). Parameters used in D and Figure 4, A, B, and D, are indicated by ,˙ +, and ×, respectively. B, When the gains of the hyperdirect, A, and direct, B, feedback loops are in an appropriate balance, the dynamics exhibit only one stable stationary state, namely, a stable fixed point. An external input to the cortex (in Hz) evokes short transient oscillations for a few cycles before the dynamics return to the fixed point. Parameter: JSTN Ctx = 1.0. C, When the gain of the hyperdirect feedback A is large compared with the direct feedback B, the activity is oscillatory. The activity oscillations are synchronized across the whole network, and there is no other stationary state. A brief input to the cortex only perturbs the oscillations transiently. Parameter: JSTN Ctx = 205. D, The network can exhibit bistability between a fixed point and an oscillatory state. For t < 0.4 s, the network is at a fixed point. Following the transient input to the cortex at t = 0.4 s, the network settles into an oscillatory state. The network remains in this state until a second transient input to the cortex at t = 3.5 s. Note the damped oscillations in the activity subsequent to the latter input. Parameter: JSTN Ctx = 1.7.
Figure 4.
Figure 4.
Nonlinear strong striatal feedforward inhibition suppresses MSN during oscillations and promotes bistability in the rate model. A, Activities of cortical and MSN populations in response to a transient input to the cortex for JSTN Ctx = 1.7, JMSN Ctx = 0.53, JMSN FSI = 0. For these parameters, the network dynamics are monostable (fixed point). B, Dynamics of cortical, MSN, and FSI populations for JSTN Ctx = 1.7, JMSN Ctx = 5.9, JMSN FSI = −4. The value of A and B + C is the same as in A, but the network is now bistable because of the sufficiently strong feedforward inhibition of the MSN. Dashed red line indicates the time-averaged activity of the MSN during the oscillations. The activity of the MSN is suppressed during the oscillations. C, Dynamics in the bistable region when the feedforward inhibition of the MSN is blocked. Parameters: JSTN Ctx = 2.1, JMSN Ctx = 0.63, JMSN FSI = 0. In the oscillatory state, the MSNs are highly active because of the increase in cortical excitation. D, Dynamics in the bistable region when the FSI feedforward inhibition of MSN is weak compared with the direct excitation. Parameters: B = JSTN Ctx = 2.3, JMSN Ctx = 7.4. The MSN population is on average more active in the oscillatory state than at the fixed point because the inhibition of the MSN by the FSI does not sufficiently compensate for the increase in the direct cortical excitation delivered to the MSN. E, Dynamics in the bistable region when the FSI feedforward inhibition is slow. Parameters: JSTN Ctx = 5.9, JMSN Ctx = 1.8, τFSI = 5 ms. The striatal feedforward inhibition of the MSN does not arrive in time to compensate for the direct cortical excitation in the oscillatory state. Thus, the activity of the MSN is not suppressed. A–E, Blue represents cortex. Red represents MSN. Green represents FSI.
Figure 5.
Figure 5.
The mechanism underlying the promotion of bistability and the suppression of MSN activity during oscillations in the rate network. A, Filled regions represent bistable regimens in different conditions. Black represents that FSI feedforward inhibition is blocked (JMSN FSI = 0). Gray represents that the input–output relationship of the FSI is given by Equation 2 (JMSN FSI = −4). Black stripe indicates that the input–output relationship of the FSI is linear FSI (JMSN FSI = −4, GFSI(x) = [x]+). When increasing the striatal inhibition, the bifurcation diagram shifts upward because additional positive feedback B is required to stabilize the network. With a linear FSI input–output relationship, increasing feedforward striatal inhibition does not change the size of the bistable region (the sizes of the black and black striped regions are the same). B, Input–output relationship of the neuronal populations in the rate model are threshold-linear, except for the FSI, for which it exhibits an expanding nonlinearity around the origin while behaving linearly when the firing rate is high (compare with straight dashed line). Black dots represent activity of the neuronal populations at the fixed point. C, The net input (direct excitation + feedforward inhibition) to MSN plotted versus the cortical output. Dashed line indicates input when feedforward inhibition is blocked (IMSN = JMSN Ctx mCtx + hMSN); Solid line indicates input in the presence of nonlinear feedforward inhibition (IMSN = JMSN Ctx mCtx + JMSN FSI GFSI (JFSI CtxmCtx + hFSI) + hMSN). Vertical dotted line indicates cortical activity at the fixed point. Horizontal dotted line indicates threshold of MSN. The input to MSN varies nonmonotonically with the cortical output (for definitions, see Materials and Methods). D, The frequency of the oscillations versus the overall delay of the hyperdirect feedback loop. Dots indicate results of the numerical simulations. Solid line indicates numerical solution of Equation 6. Vertical dotted line indicates value of the delay used in Figure 4.
Figure 6.
Figure 6.
Bistability and MSN activity suppression exhibit the same mechanism in the BG-thalamo-cortical spiking and rate networks. A, Bifurcation diagram of the spiking model with the parameters as in Table 2. Gray represents that the network is bistable. Dot indicates parameters used in Figures 2 and 7. B, C, Bifurcation diagram of the spiking network with all parameters as in Table 2, except for the nonlinearity of the feedforward inhibition, which is reduced by 50% (η = 0.5, JMSN FSI = −300 mV, JFSI Ctx = 150 mV) in B and 75% (η = 0.5, JMSN FSI = −600 mV, JFSI Ctx = 75 mV) in C. D, Bifurcation diagram of the spiking network with all parameters as in Table 2, except for the feedforward inhibition, which is reduced by 90% (JMSN FSI = −15 mV). ASYNC, Asynchronous activity; OSC, monostable oscillatory state. E, The net input to MSN is a nonmonotonic function of the average cortical activity (compare with Fig. 5C). Solid line indicates net input for three values of the nonlinearity parameter η (0.25, 0.5, and 1, top to bottom). Dashed line indicates that feedforward inhibition is blocked. Horizontal dotted line indicates threshold. Vertical dotted line indicates cortical activity at rest. F, Input–output relationships for the different populations in the network. Black dots represent where the different populations operate when the network is at a fixed point. Parameters are given in Table 2.
Figure 7.
Figure 7.
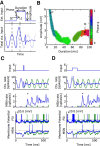
A transient excitatory input to the cortex with an appropriate phase-amplitude-duration relationship terminates the seizures. A, The transient excitation of the cortex (top) and its effect on the activity of the cortex (bottom, solid). Dashed line indicates the unperturbed oscillation. The network operates in the bistable regimen. The phase of the transient excitation is zero if it occurs at the trough of the oscillation in the cortical activity. B, The phase-amplitude-duration relationship for successful terminations of the oscillations. Black dots indicate the input parameters used in C, D. C, A transient excitation of the cortex with short duration and large amplitude terminates the oscillations if it occurs at phase φ ∼ 0.5. Top to bottom, The input to the cortical population (amplitude 7 mV), average population activity of cortical neurons and MSN, and voltage traces of one FSI and one MSN. Green represents unperturbed traces. Blue represents traces following the transient input. The activity of the MSN population increases briefly after the transient input is over (*). This is reflected as a rebound of activity at the single-neuron level (Fig. 2A,D). D, Another example of successful termination of the oscillations.
Figure 8.
Figure 8.
Bistable dynamics in the spiking network model with the GPe included. A, Simulation of the spiking network model. The parameters as in Table 2 (as in Fig. 2A), except for the following: JSTN Ctx = 85 mV, JMSN Ctx = 550 mV, JGPe MSN = −20 mV, JGPeSTN = 20 mV, JSNrGPe = −10 mV, JSTN Ctx = −10 mV, νGPe = 20 spikes/s. Stimulations with same duration and intensity as in Figure 2A can initiate and terminate the oscillations. Top, The external input to the cortex (in mV). Middle, Population average firing rate in the cortex. Bottom, The voltage trace of one MSN. B, Bifurcation diagram of the spiking model as a function of JSTN Ctx and JMSN Ctx. Other parameters are as in A. Gray represents the region where the network dynamics are bistable. Dot indicates parameters used in A. C, D, Zoom on the dynamics around the initiation (C) and termination (D) of the oscillatory episode in A. Top to bottom, The cortical activity and the membrane potential of one FSI, one MSN, one neuron in the STN, one neuron in the SNr, and one neuron in the GPe. Overall, the dynamics are qualitatively identical to the one without GPe shown in Figure 2C,D.

References

    1. Alexander GE, DeLong MR, Strick PL. Parallel organization of functionally segregated circuits linking basal ganglia and cortex. Annu Rev Neurosci. 1986;9:357–381. doi: 10.1146/annurev.ne.09.030186.002041. - DOI - PubMed
    1. Arakaki T, Leblois A, Charpier S, Hansel D. Persistence and termination of absence epileptic seizures: the role of striatal feedforward inhibition. Neuroscience 2013 Abstracts, San Diego, Program 53.20. Society for Neuroscience. 2013 - PubMed
    1. Avanzini G, de Curtis M, Marescaux C, Panzica F, Spreafico R, Vergnes M. Role of the thalamic reticular nucleus in the generation of rhythmic thalamo-cortical activities subserving spike and waves. J Neural Transm Suppl. 1992;35:85–95. - PubMed
    1. Avanzini G, Vergnes M, Spreafico R, Marescaux C. Calcium-dependent regulation of genetically determined spike and waves by the reticular thalamic nucleus of rats. Epilepsia. 1993;34:1–7. doi: 10.1111/j.1528-1157.1993.tb02369.x. - DOI - PubMed
    1. Avanzini G, de Curtis M, Franceschetti S, Sancini G, Spreafico R. Cortical versus thalamic mechanisms underlying spike and wave discharges in GAERS. Epilepsy Res. 1996;26:37–44. doi: 10.1016/S0920-1211(96)00037-X. - DOI - PubMed

Publication types

LinkOut - more resources