. 2016 Sep 15:7:12757.
doi: 10.1038/ncomms12757.

MBOAT7 rs641738 increases risk of liver inflammation and transition to fibrosis in chronic hepatitis C

Collaborators, Affiliations

MBOAT7 rs641738 increases risk of liver inflammation and transition to fibrosis in chronic hepatitis C

Khaled Thabet et al. Nat Commun. .

Abstract

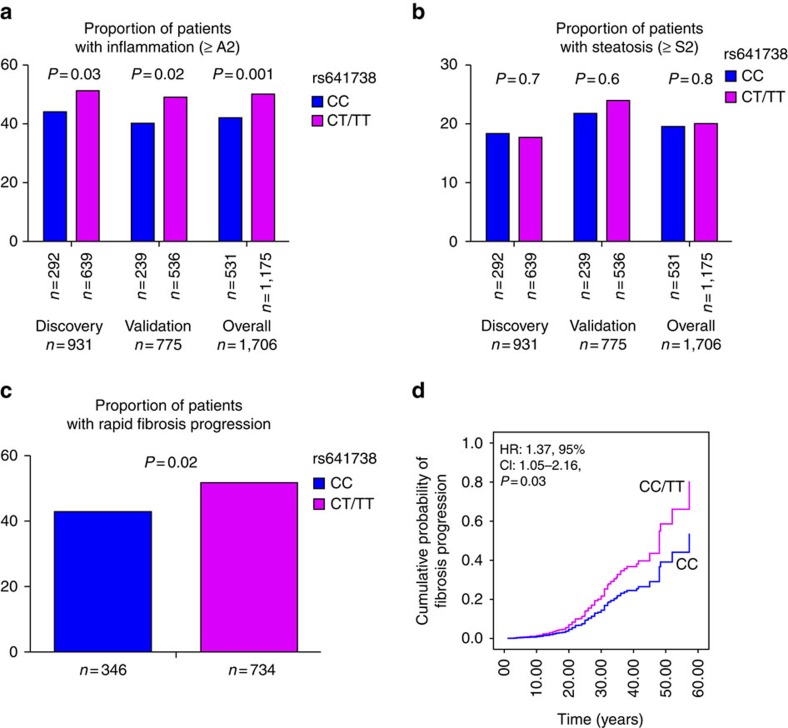
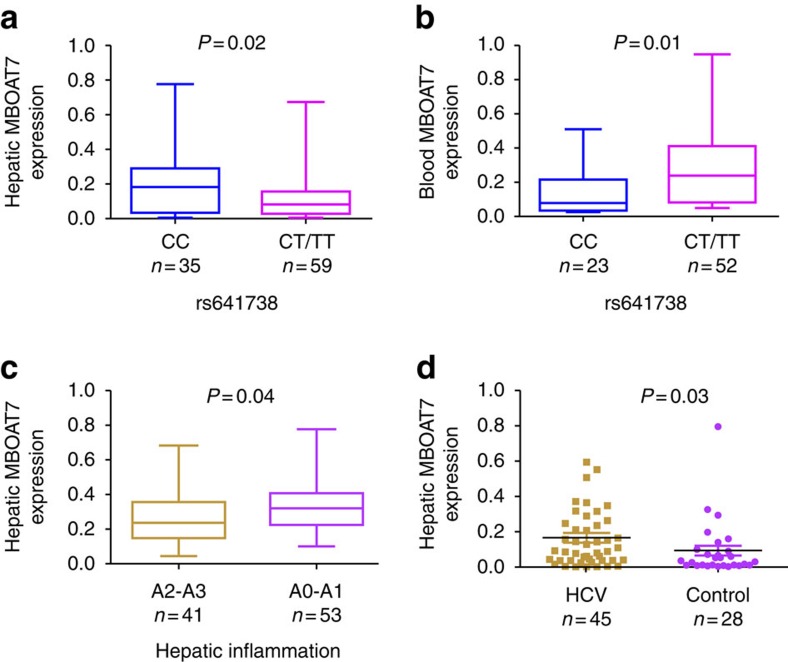
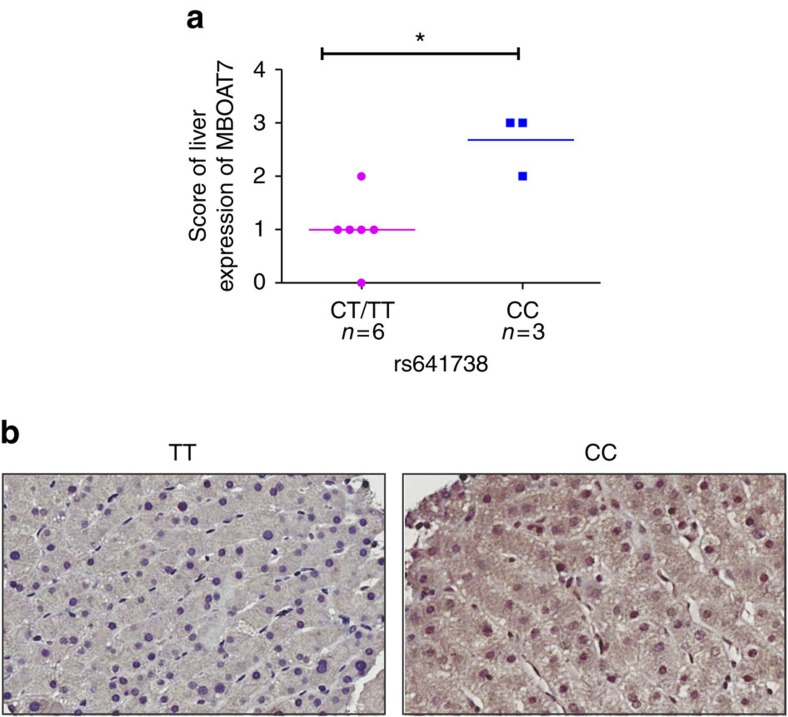
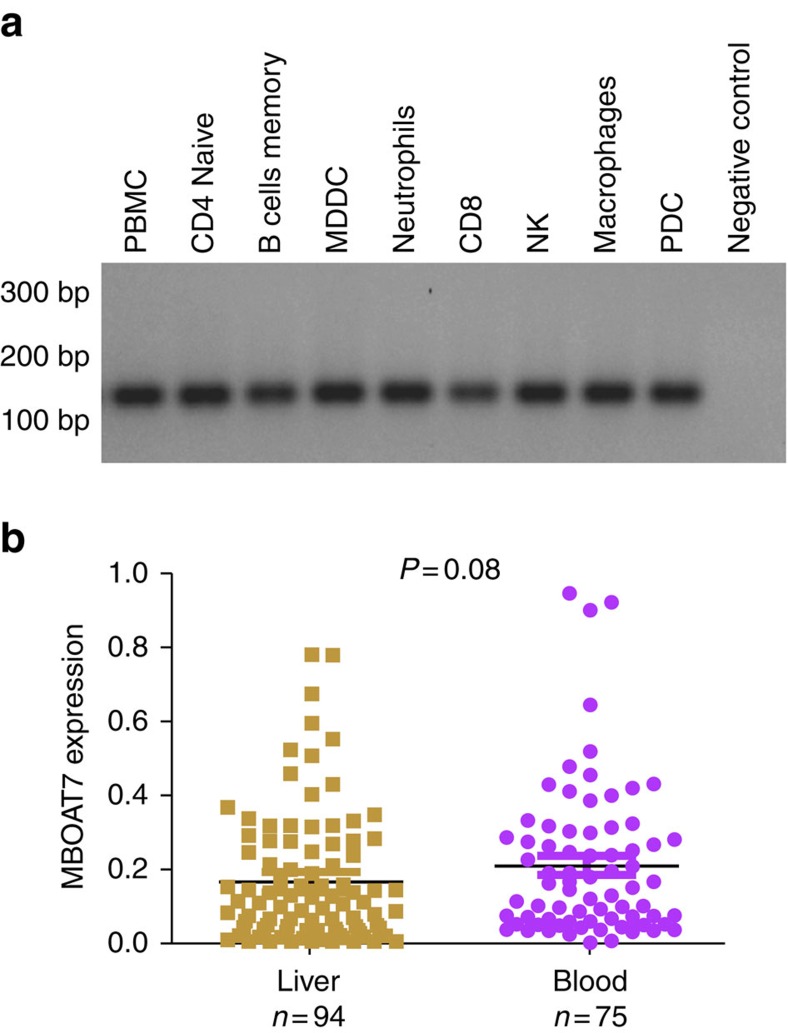
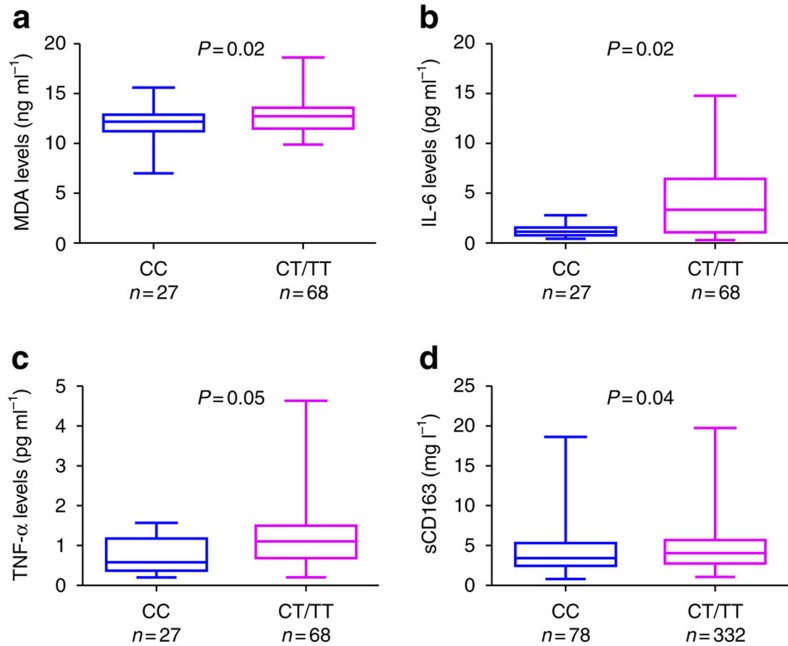
Cirrhosis likely shares common pathophysiological pathways despite arising from a variety of liver diseases. A recent GWAS identified rs641738, a polymorphism in the MBOAT7 locus, as being associated with the development of alcoholic cirrhosis. Here we explore the role of this variant on liver inflammation and fibrosis in two cohorts of patients with chronic hepatitis C. In 2,051 patients, rs641738 associated with severe hepatic inflammation and increased risk of fibrosis, as well as fast fibrosis progression. At functional level, rs641738 associated with MBOAT7 transcript and protein levels in liver and blood, and with serum inflammatory, oxidative stress and macrophage activation markers. MBOAT7 was expressed in immune cell subsets, implying a role in hepatic inflammation. We conclude that the MBOAT7 rs641738 polymorphism is a novel risk variant for liver inflammation in hepatitis C, and thereby for liver fibrosis.


Figures

Figure 1
Figure 1. Association of rs641738 genotype with liver injury.
Association of rs641738 genotype with necroinflammation (a) and steatosis degree (b) by discovery (n=931), validation (n=775) and overall cohorts (n=1706). P values are univariate and provided for the dominant model of inheritance. Association of rs641738 genotype with FPR in the sub-cohort with an estimated date of infection (n=1,080) (c) with fast fibrosis progression. (d) Multivariate Cox regression analysis of rs641738 genotypes on the cumulative probability of progression to any fibrosis (≥F1), adjusted for age, gender, BMI, PNPLA3 rs738409, TM6SF2 rs58542926 and IFNL rs12979860 genotype. HR, hazard ratio.
Figure 2
Figure 2. Association of rs641738 genotype with MBOAT7 mRNA expression.
Association between MBOAT7 rs641738 genotype and hepatic (n=94) (a) and blood (n=75) (b) MBOAT7 mRNA levels. Clinical and anthropometric characteristics of these patients are shown in Supplementary Table 8. The x axis shows the genotypes at rs641738 using the dominant model of inheritance (CC=35 and CT/TT=59 in the liver biopsy cohort, and CC=23 and CT/TT=52 in the blood cohort) and the y axis shows the MBOAT7 expression level relative to GAPDH by quantitative real-time PCR. (c) Hepatic MBOAT7 mRNA levels according to hepatic inflammation. The x axis shows hepatic inflammation dichotomized as absent/mild (METAVIR score A0–A1) (n=53) or moderate/severe (METAVIR score A2–A3) (n=41), and the y axis shows hepatic MBOAT7 expression as fold change. The number of independent samples tested in each group is shown in parentheses. Each group is shown as a box plot and the median values are shown as thick dark horizontal lines. The box covers the twenty-fifth to seventy-fifth percentiles. We tested the difference in the median values among genotypes using the two-tailed Mann–Whitney tests. We plotted the box plots using Graphpad prism 5. (d) Comparison of hepatic MBOAT7 mRNA levels in hepatitis C patients with no or mild fibrosis (F0–F1) (n=45) and control (n=28). The number of independent samples tested in each group is shown in parentheses. Median and interquartile range are shown and P value was calculated using the two-tailed Mann–Whitney test.
Figure 3
Figure 3. Association of rs641738 genotype with MBOAT7 protein expression.
Association between hepatic MBOAT7 rs641738 genotype and MBOAT7 protein expression assessed using immunohistochemistry (IHC). (a) Scores for liver protein expression of MBOAT7 was evaluated using IHC according to grouping of rs641738 genotype using the dominant model of inheritance. The x axis shows the genotypes at rs641738 using the dominant model of inheritance (CC=3 and CT/TT=6) and the y axis shows the score of liver protein expression of MBOAT7. The number of independent samples tested in each group is shown in parentheses. (b) Representative liver expression pattern of MBOAT7 in patients carrying the rs641738 CC or TT genotype, respectively. MBOAT7 immunoreactivity was examined using light microscopy of liver sections. Original magnification × 400.
Figure 4
Figure 4. Expression of MBOAT7 in immune cells.
(a) Expression of MBOAT7 on circulating immune cells (PBMCs, T and B lymphocytes, monocytes, macrophages, natural killer cells, dendritic cells (plasmacytoid dendritic cells (PDCs) and monocyte-derived dendritic cells (MDDC)) and neutrophils). (b) Comparison of the expression of MBOAT7 in blood (n=75) and liver (n=94) in patients with CHC. The number of independent samples tested in each group is shown in parentheses. Median and interquartile range are shown; P value was calculated using the two-tailed Mann–Whitney test.
Figure 5
Figure 5. Association between rs641738 genotype and inflammatory, oxidative stress and macrophage activation markers.
rs641738 genotype correlation with MDA, an oxidative stress marker (a), IL-6 (b) and TNF-α, as inflammatory markers (c). Clinical and anthropometric characteristics of these patients are shown in Supplementary Table 8 (n=95). The x axis shows the genotypes at rs641738 using the dominant model of inheritance (CC=27 and CT/TT=68) and the y axis shows serum MDA as ng ml−1 (a), IL-6 as pg ml−1, TNF-α as pg ml−1. (d) Association between MBOAT7 rs641738 genotype and the macrophage activation marker sCD163 (n=510). The x axis shows the genotypes at rs641738 using the dominant model of inheritance (CC=178 and CT/TT=332) and the y axis shows sCD163 as mg ml−1. The number of independent samples tested in each group is shown in parentheses. Each group is shown as a box plot and the median values are shown as thick dark horizontal lines. The box covers the twenty-fifth to seventy-fifth percentiles. We tested the difference in the median values among genotypes using the two-tailed Mann–Whitney test. We plotted the box plots using Graphpad prism 5.

References

    1. Seeff L. B. Natural history of chronic hepatitis C. Hepatology 36, (5 Suppl 1): S35–S46 (2002). - PubMed
    1. Iredale J. P. Models of liver fibrosis: exploring the dynamic nature of inflammation and repair in a solid organ. J. Clin. Invest. 117, 539–548 (2007). - PMC - PubMed
    1. Buch S. et al. A genome-wide association study confirms PNPLA3 and identifies TM6SF2 and MBOAT7 as risk loci for alcohol-related cirrhosis. Nat. Genet. 47, 1443–1448 (2015). - PubMed
    1. Mancina R. M. et al. The MBOAT7-TMC4 variant rs641738 increases risk of nonalcoholic fatty liver disease in individuals of European descent. Gastroenterology 150, 1219–1230.e6 (2016). - PMC - PubMed
    1. Masumoto N. et al. Membrane bound O-acyltransferases and their inhibitors. Biochem. Soc. Trans. 43, 246–252 (2015). - PubMed

Publication types

MeSH terms