Review
. 2016 Aug 31:10:82.
doi: 10.3389/fncom.2016.00082. eCollection 2016.

Modeling of Cerebral Oxygen Transport Based on In vivo Microscopic Imaging of Microvascular Network Structure, Blood Flow, and Oxygenation

Affiliations
Review

Modeling of Cerebral Oxygen Transport Based on In vivo Microscopic Imaging of Microvascular Network Structure, Blood Flow, and Oxygenation

Louis Gagnon et al. Front Comput Neurosci. .

Abstract

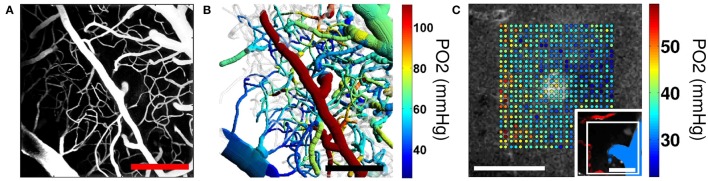
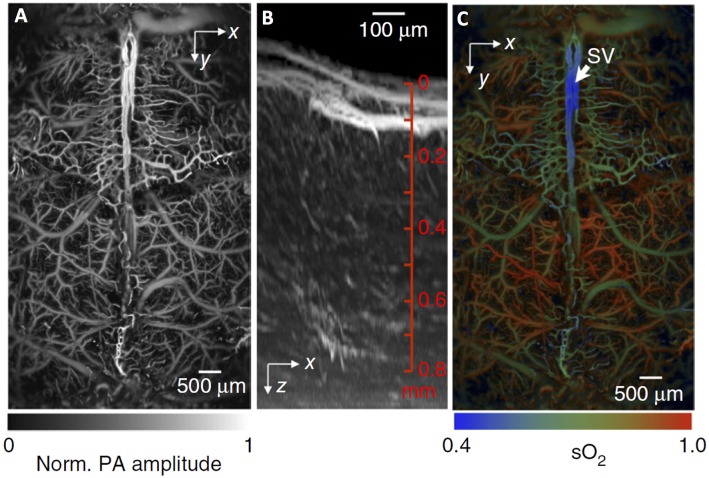
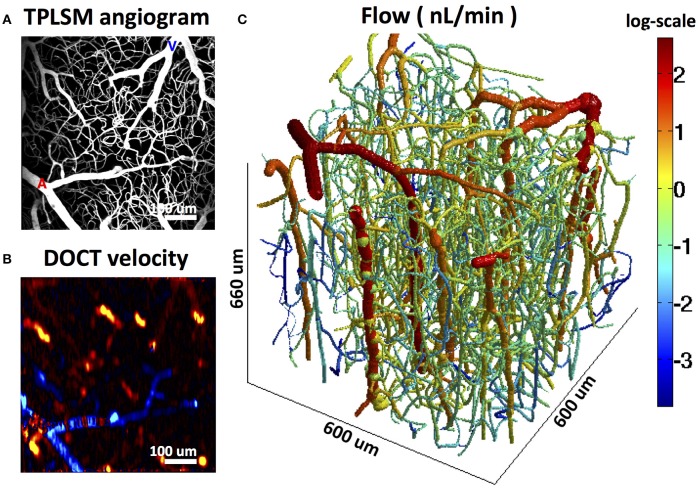
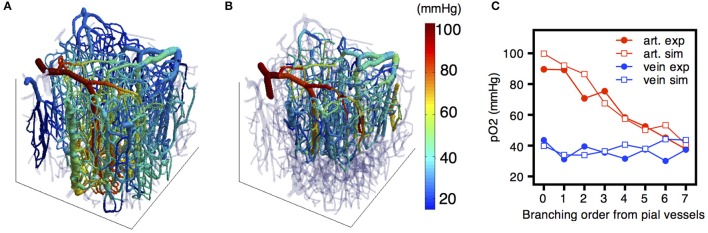
Oxygen is delivered to brain tissue by a dense network of microvessels, which actively control cerebral blood flow (CBF) through vasodilation and contraction in response to changing levels of neural activity. Understanding these network-level processes is immediately relevant for (1) interpretation of functional Magnetic Resonance Imaging (fMRI) signals, and (2) investigation of neurological diseases in which a deterioration of neurovascular and neuro-metabolic physiology contributes to motor and cognitive decline. Experimental data on the structure, flow and oxygen levels of microvascular networks are needed, together with theoretical methods to integrate this information and predict physiologically relevant properties that are not directly measurable. Recent progress in optical imaging technologies for high-resolution in vivo measurement of the cerebral microvascular architecture, blood flow, and oxygenation enables construction of detailed computational models of cerebral hemodynamics and oxygen transport based on realistic three-dimensional microvascular networks. In this article, we review state-of-the-art optical microscopy technologies for quantitative in vivo imaging of cerebral microvascular structure, blood flow and oxygenation, and theoretical methods that utilize such data to generate spatially resolved models for blood flow and oxygen transport. These "bottom-up" models are essential for the understanding of the processes governing brain oxygenation in normal and disease states and for eventual translation of the lessons learned from animal studies to humans.

Keywords: brain imaging methods; cerebral blood flow (CBF); cerebral blood flow measurement; cerebrovascular circulation; modeling and simulations.


Figures

Figure 1
Figure 1
Schematic illustration of cortical vasculature, showing network structures involved in neurovascular coupling. The cerebral cortex receives its blood supply from a mesh of pial arteries and veins lying on the cortical surface. Penetrating arterioles and venules branch off the pial vessels and traverse the thickness of the cortex, supplying dense arrays of capillaries. Transient activation of neuronal signaling leads to an increased metabolic demand in a tissue region, necessitating increased blood flow, which is achieved by adjustment of vascular diameters in the upstream vessels feeding that region and possibly also in the capillaries and downstream vessels. Open arrows indicate direction of blood flow.
Figure 2
Figure 2
MPM microangiography. In vivo multi-photon fluorescence microscopy images of the cortical microvasculature in a 3-month old non-transgenic mouse. Acquired in the primary somatosensory cortex, this maximum intensity projection image (A) shows penetrating arterioles running vertically down from the cortical surface (top of the bottom row image) as well as ascending venules interspersed with a dense capillary network. (B) A tubular model obtained by segmentation of the branching vessel network shown in (A). The color bar indicates the coding of average vessel diameters. Top row images are parallel with the cortical surface, while bottom row images are perpendicular to the cortical surface. Adapted with permission from Dorr et al. (2012).
Figure 3
Figure 3
(A) The depth-projected vasculature within the first 2 mm of mouse brain bearing a xenotransplanted U87 human glioblastoma multiforme tumor imaged with OFDI. Depth is denoted by color: yellow (superficial) to red (deep). Scale bar, 500 μm. Right panels: Validation of the morphological measurements obtained from OFDI and MPM. (B,C) Normal brain vasculature acquired by OFDI (B) and MPM (C). The automated vascular tracing was applied to registered vascular data sets to quantify the resolution of OFDI angiography and (D) validation of the morphological measurements obtained from OFDI. Scale bars, 250 μm. Adapted with permission from Vakoc et al. (2009).
Figure 4
Figure 4
TPM flow. Simultaneous measurement of lumen diameter and red blood cell velocity in multiple vessels using spatially optimized line scans. (A) Image of fluorescein-dextran-labeled vessels in the rat somatosensory cortex taken with a 4X objective. (B) High-magnification image of a surface arteriole and venule in the forelimb region collected with a 40X objective. The pattern of the two-photon scanning laser is superimposed. Portions of the scan path along the length of the vessel are used to calculate red blood cell (RBC) velocity, whereas portions moving across the width of the vessels are used to calculate lumen diameter (Driscoll et al., 2011). Scans were acquired at a rate of 733 scan cycles per second. (C) The scan path is colored to show the error between the desired scan path and the actual path the mirrors traversed. The error along linear portions of the image is typically < 1 μm and increases when the mirrors undergo rapid acceleration. The error between successive scans of the same path is < 0.15 μm, several times lower than the point-spread function of a two-photon laser scanning microscopy. (D) The upper traces show the scan path and mirror speed as a function of time. Note that portions used to acquire diameter and velocity data are constant speed. The line scans generated from the path can be stacked sequentially as a space–time plot as shown in the lower image panels. Each image panel shows ~100 ms of data collected before, during, and after an electrical stimulation of the contralateral forelimb of the anesthetized rat. The stimulus was a 1 mA current, delivered for 3 s at 3 Hz with a 100-ms pulse width (Devor et al., 2007). (E) Vessel diameter is calculated as the full-width at half-maximum of a time-average of several scans across the width of a vessel (left). Red blood cell velocity is calculated from the angle of the RBC streaks (right; Drew et al., 2010). (F) Data traces of lumen diameter, RBC velocity, and RBC flux for the arteriole and venule after processing to remove heartbeat and smoothing with a running window. Figure adapted from Driscoll et al. (, Book chapter).
Figure 5
Figure 5
OCT RBC flow. (A) The enface MIP of the 3D angiogram with color indicating the depth from the cortical surface. Bar = 100 μm. (B–D) Estimated RBC speed, flux, and density are presented as color spots on the MIP angiogram. We used relatively comparable ranges (median ± 40%) for all quantities. (E) Histograms (top) and depth profiles (bottom) of the RBC speed, flux, and density measured from three animals (n = 2; 259 measures in total). Comparable histogram ranges (median ± 40%) are used. In the depth profiles, data are presented as mean ± s.d. (F) Correlations between the flux vs. the speed and density (n = 2259). Dashed lines indicate median ± 40% of the density (left) and speed (right). Adapted with permission from Lee et al. (2013).
Figure 6
Figure 6
Two-photon microscopy imaging of PO2. (A) Maximum intensity projection (MIP) of the 200−μm-thick cortical microvascular stack obtained by TPM. Blood plasma was labeled by FITC. (B) Top-view projection of the segmented microvasculature with the intravascular PO2 measurements obtained by TPM. Mean vascular segment PO2 measurements were color-coded and overlaid on the segmented microvascular structure. Scale bars, 200 μm. Adapted with permission from (Sakadžić et al., 2014). (C) Simultaneous measurement of PO2 in cortical vasculature and tissue. Measured PO2 values overlaid with the gray scale phosphorescence intensity image at 60 μm depth. Measurements were performed at the location of an ascending venule. Measurement location is marked with the white rectangle in the inset (bottom right), showing MIP of 80 μm-thick FITC-labeled microvasculature stack. Ascending venule (blue) and branches of the descending arteriole (red) are color-coded for easier identification. Scale bars, 50 μm. Adapted with permission from Sakadžić et al. (2010).
Figure 7
Figure 7
Fast functional photoacoustic microscopy (PAM) of the mouse brain. (A) Representative xy projected brain vasculature image through an intact skull. (B) Representative enhanced xz projected brain vasculature image acquired over a 0.6 × 0.6 mm2 region with depth scanning, where the signal amplitude was normalized depthwise. (C) PAM of oxygen saturation of hemoglobin (SO2) in the same mouse brain as in (A), acquired by using the single-wavelength pulse-width-based method (PW-SO2) with two lasers. SV, skull vessel. Adapted with permission from Yao et al. (2015).
Figure 8
Figure 8
OCT measurement of SO2. Quantification of chromophores in the mouse brain in an en face view. (A) Maximum intensity projection of R2 values from the fit (Equation 19) shows the highest values near the centers of vessels, with a decrease at the edges. (B) The parameter Φ accounts for RBC scattering effects. (C) Saturation map, showing clear distinctions between arteries and veins. (D) Map of the maximum of the product of oxygenated hemoglobin concentration and distance shows that veins and arteries contain oxyhemoglobin. (E) By comparison, under the given experimental conditions, most of deoxyhemoglobin is contained in the veins. (F) The map of the maximum of the product of total hemoglobin concentration and distance shows larger values in larger vessels, with localized increases at vessel crossings. It should be noted that quantitative measurements of chromophores can be achieved by integrating the maps (D–F) in the transverse plane (x and y dimensions). All maps were displayed with transparency based on the local R2 values at each transverse location, averaged over depth. An artery (a) and vein (v) are labeled. Adapted with permission from Chong et al. (2015b).
Figure 9
Figure 9
Reconstruction of microvascular cerebral blood flow in the mouse cortex using Doppler OCT flow measurements in outflowing venules to constrain the computation. (A) MPM angiogram. (B) Doppler OCT velocity projection map. (C) Reconstructed flow. Adapted with permission from Gagnon et al. (2015a).
Figure 10
Figure 10
(A) Distribution of the partial pressure of oxygen (PO2) simulated across the vascular network using the FEM model. (B) MPM experimental measurement of PO2 in vivo. (C) Quantitative comparison of simulated and experimental PO2 and SO2 distributions across the vascular network. Adapted with permission from Gagnon et al. (2015b).
Figure 11
Figure 11
(A) Spatiotemporal evolution of SO2 changes following a 2 s forepaw stimulus. (B) Comparison of simulated SO2 changes (n = 6 animals) with experimental SO2 changes (n = 10 animals) measured in pial vessels during a forepaw stimulus with confocal microscopy. Adapted with permission from Gagnon et al. (2015b).

References

    1. Ances B. M., Greenberg J. H., Detre J. A. (2001). The effects of graded hypercapnia on the activation flow coupling response due to forepaw stimulation in alpha-chloralose anesthetized rats. Brain Res. 911, 82–88. 10.1016/S0006-8993(01)02721-4 - DOI - PubMed
    1. Angleys H., Østergaard L., Jespersen S. N. (2015). The effects of capillary transit time heterogeneity (CTH) on brain oxygenation. J. Cereb. Blood Flow Metab. 35, 806–817. 10.1038/jcbfm.2014.254 - DOI - PMC - PubMed
    1. Arciero J. C., Carlson B. E., Secomb T. W. (2008). Theoretical model of metabolic blood flow regulation: roles of ATP release by red blood cells and conducted responses. Am. J. Physiol. Heart Circ. Physiol. 295, H1562–H1571. 10.1152/ajpheart.00261.2008 - DOI - PMC - PubMed
    1. Armulik A., Genové G., Betsholtz C. (2011). Pericytes: developmental, physiological, and pathological perspectives, problems, and promises. Dev. Cell 21, 193–215. 10.1016/j.devcel.2011.07.001 - DOI - PubMed
    1. Attwell D., Iadecola C. (2002). The neural basis of functional brain imaging signals. Trends Neurosci. 25, 621–625. 10.1016/S0166-2236(02)02264-6 - DOI - PubMed

LinkOut - more resources