. 2016 Aug 31:7:1346.
doi: 10.3389/fmicb.2016.01346. eCollection 2016.

Transcriptional and Physiological Changes during Mycobacterium tuberculosis Reactivation from Non-replicating Persistence

Affiliations

Transcriptional and Physiological Changes during Mycobacterium tuberculosis Reactivation from Non-replicating Persistence

Peicheng Du et al. Front Microbiol. .

Abstract

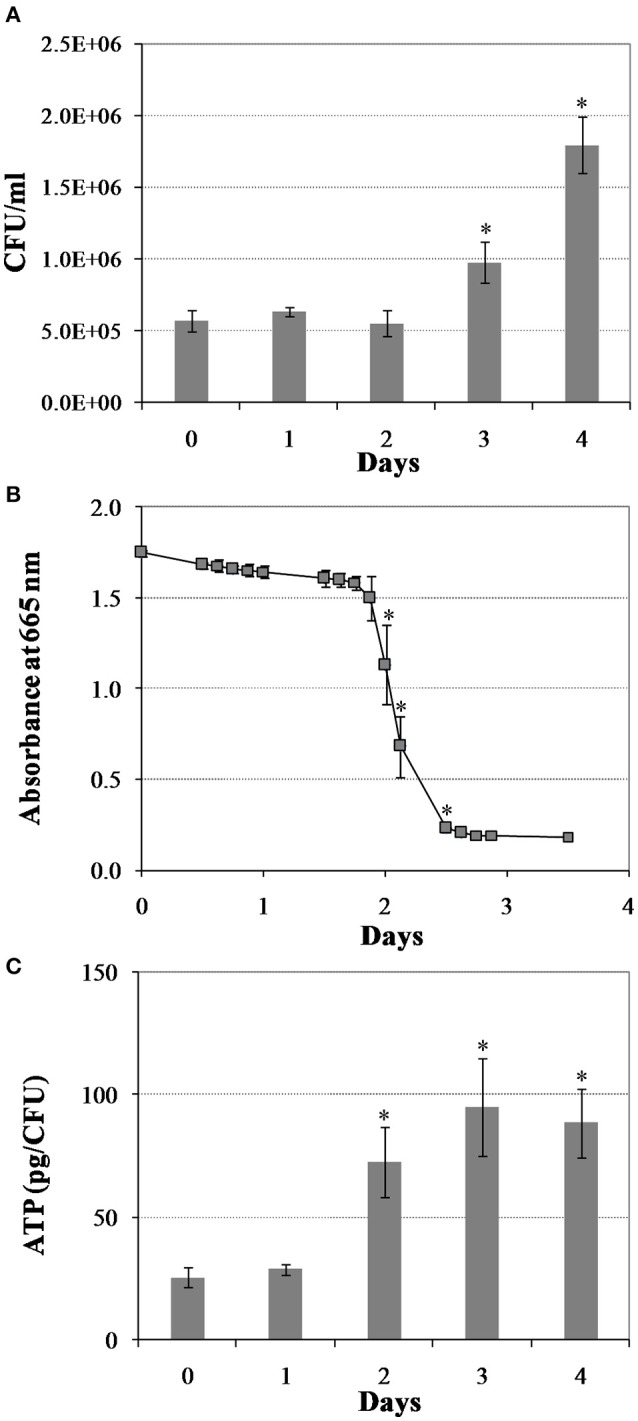
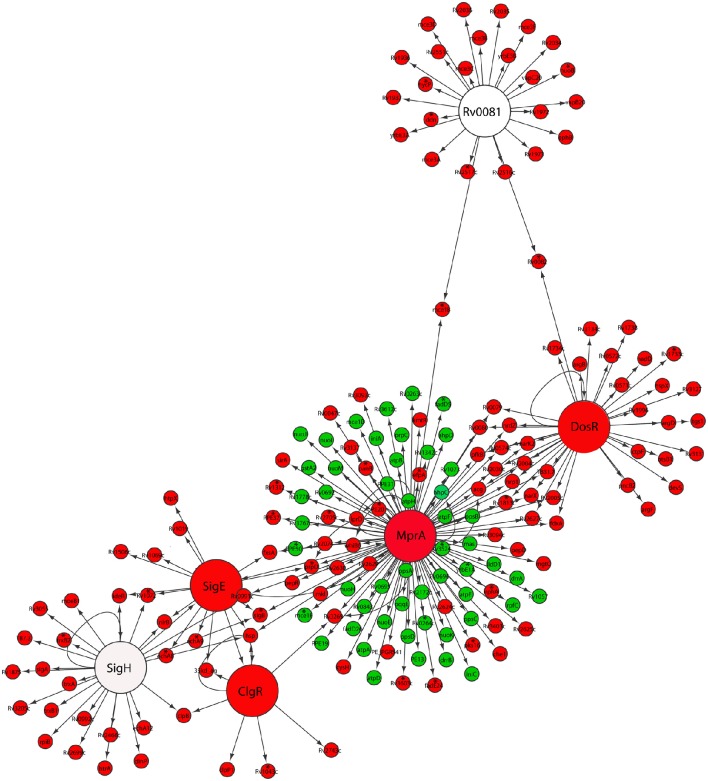
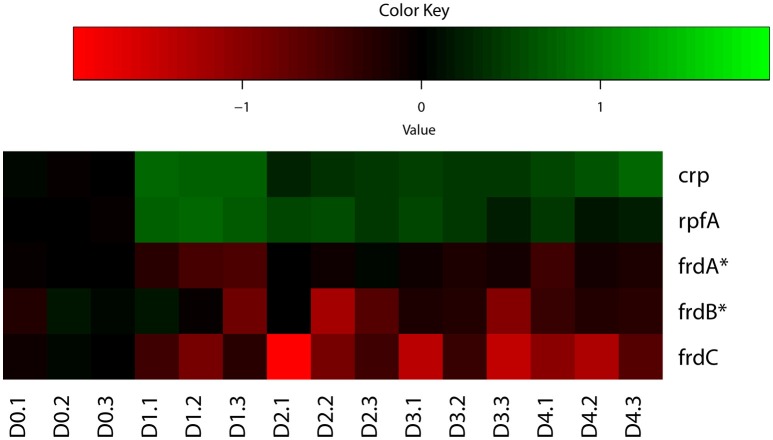
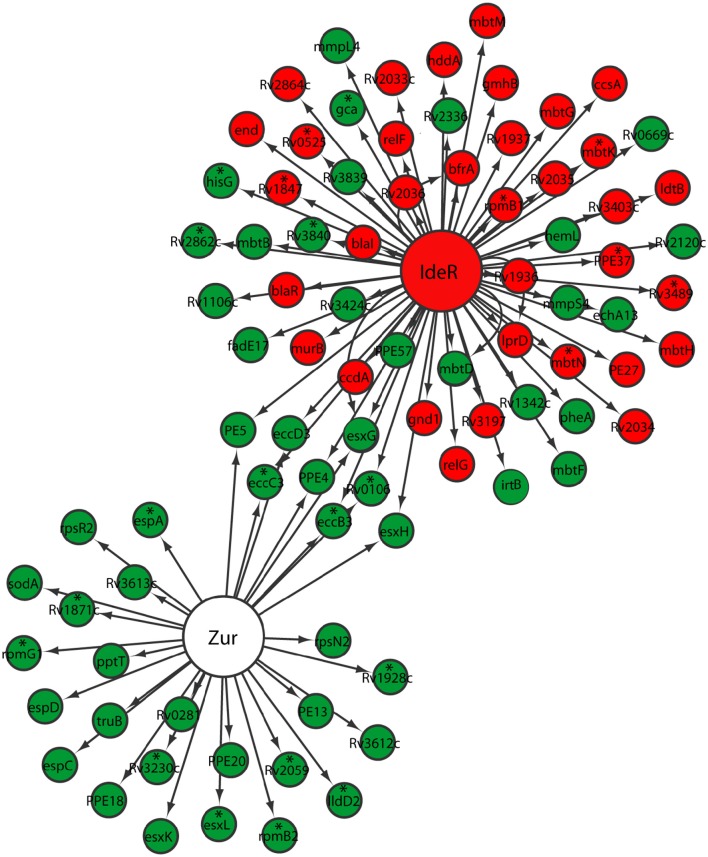
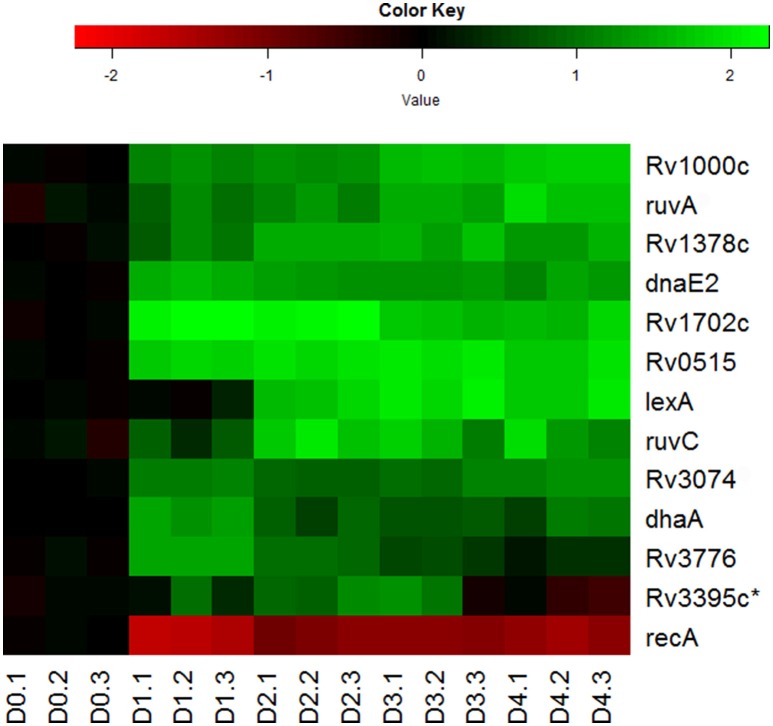
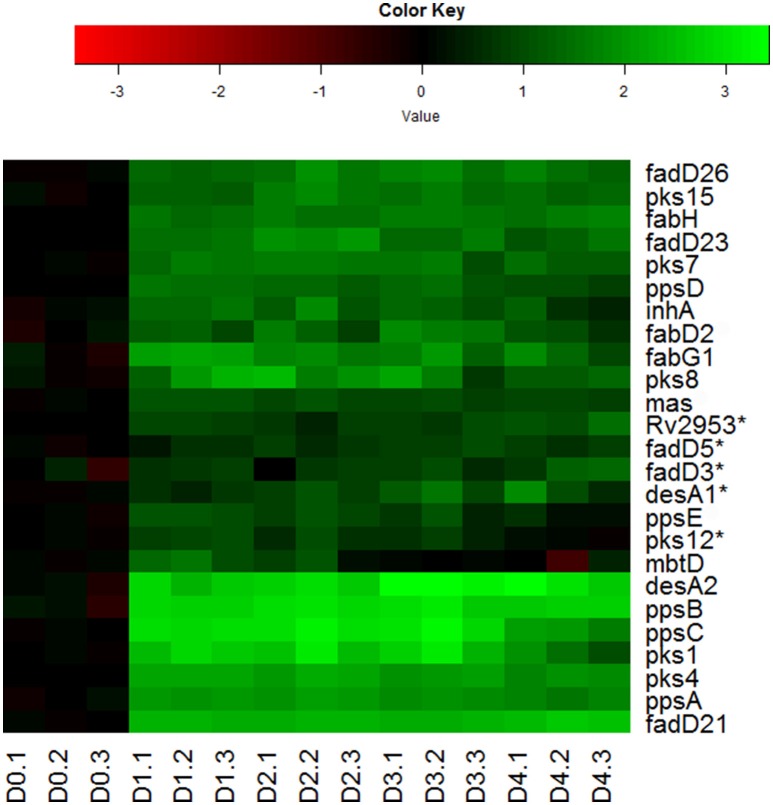
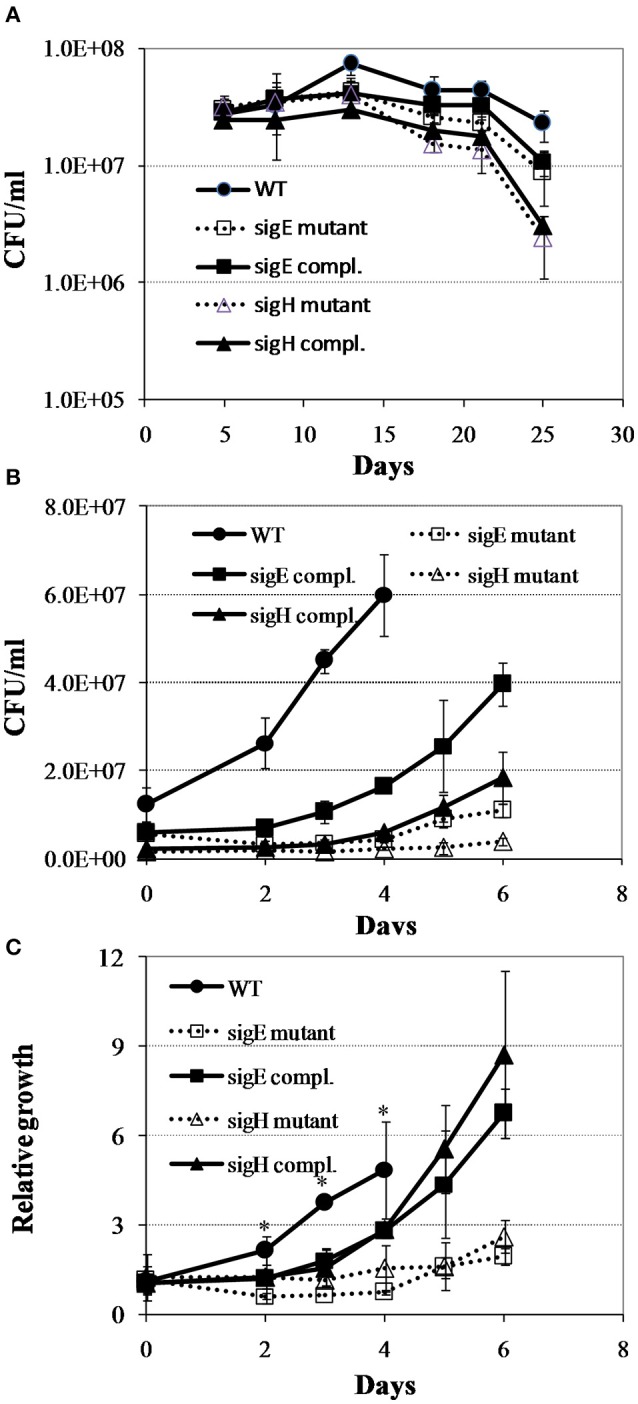
Mycobacterium tuberculosis can persist for years in the hostile environment of the host in a non-replicating or slowly replicating state. While active disease predominantly results from reactivation of a latent infection, the molecular mechanisms of M. tuberculosis reactivation are still poorly understood. We characterized the physiology and global transcriptomic profiles of M. tuberculosis during reactivation from hypoxia-induced non-replicating persistence. We found that M. tuberculosis reactivation upon reaeration was associated with a lag phase, in which the recovery of cellular physiological and metabolic functions preceded the resumption of cell replication. Enrichment analysis of the transcriptomic dynamics revealed changes to many metabolic pathways and transcription regulons/subnetworks that orchestrated the metabolic and physiological transformation in preparation for cell division. In particular, we found that M. tuberculosis reaeration lag phase is associated with down-regulation of persistence-associated regulons/subnetworks, including DosR, MprA, SigH, SigE, and ClgR, as well as metabolic pathways including those involved in the uptake of lipids and their catabolism. More importantly, we identified a number of up-regulated transcription regulons and metabolic pathways, including those involved in metal transport and remobilization, second messenger-mediated responses, DNA repair and recombination, and synthesis of major cell wall components. We also found that inactivation of the major alternative sigma factors SigE or SigH disrupted exit from persistence, underscoring the importance of the global transcriptional reprogramming during M. tuberculosis reactivation. Our observations suggest that M. tuberculosis lag phase is associated with a global gene expression reprogramming that defines the initiation of a reactivation process.

Keywords: RNA-Seq; gene expression profiling; lag phase; metabolism and physiology; reactivation; transcription regulon/subnetwork; tuberculosis.


Figures

Figure 1
Figure 1
Changes in M. tuberculosis physiology during reactivation from hypoxia-induced persistence. (A) Colony forming units (CFU) during regrowth. Cultures were grown for 25 days in the Wayne low oxygen model, diluted in fresh media and then incubated under aerobic condition. Growth was monitored by CFU enumeration. (B) Oxygen utilization during regrowth. Oxygen consumption by M. tuberculosis was measured by methylene blue decolorization at 665 nm. (C) Cellular ATP levels during regrowth. Shown are averages ± SD's of respective measurements from three independent cultures at each time point. *indicates changes at p ≤ 0.05 (student's t-test) between measurements at corresponding time points and measurement at D0 (A,C), or between measurements at corresponding time points and measurement at previous time point (B).
Figure 2
Figure 2
Down-regulation of persistence-associated regulatory subnetworks in M. tuberculosis reaeration lag phase. Shown are changes of gene expression in the regulons of DosR, MprA, SigE, SigH, ClgR, and Rv0081 and their connections in cultures between time points at D1 and D0, D2 and D0, or D2 and D1. Changes were identified by enrichment analysis using the transcription regulatory network. Data were derived from the RNA-Seq data of the reactivating bacilli from three independent cultures at each time point. Green color indicates up-regulation and red color denotes down-regulation. To show the connections between the regulons/subnetworks, also included are genes (marked with asterisk) whose expression showed more than 1.5-fold change but did not reach significant level (p ≤ 0.05) in corresponding time points.
Figure 3
Figure 3
Heatmap of representative M. tuberculosis CRP regulon genes during regrowth. Changes in reactivating cultures relative to non-replicating persistent culture were identified by enrichment analysis using the expanded regulatory network. Data were derived from the RNA-Seq data of the reactivating bacilli from three independent cultures at each time point. Green color indicates up-regulation and red color denotes down-regulation. Color scale denotes log2 fold change in gene expression. Also included are genes (marked with asterisk) whose expression showed more than 1.5-fold change but did not reach significant level (p ≤ 0.05) between time points at D1 and D0, D2 and D0, or D2 and D1.
Figure 4
Figure 4
Increased expression of genes involved in zinc and iron uptake and mobilization in M. tuberculosis lag phase. Shown are changes of gene expression in the regulons of Zur and IdeR in regrowth cultures at time points between D1 and D0, D2 and D0, or D2 and D1. Changes were identified by enrichment analysis using the transcription regulatory network. Data were derived from the RNA-Seq data of the reactivating bacilli from three independent cultures at each time point. Green color indicates up-regulation and red color denotes down-regulation. To show the connections between the two regulons, also included are genes (marked with asterisk) whose expression showed more than 1.5-fold change but did not reach significant level (p ≤ 0.05) in corresponding time points.
Figure 5
Figure 5
Increased expression of genes involved in DNA repair and recombination during M. tuberculosis regrowth. Shown are the expression changes of genes in the LexA regulon during regrowth. Changes relative to non-replicating persistent culture were identified by enrichment analysis using the transcription regulatory network. Data were derived from the RNA-Seq data of the reactivating bacilli from three independent cultures at each time point. Green color indicates up-regulation and red color denotes down-regulation. Color scale denotes log2 fold change in gene expression. Asterisk indicates that the change of gene expression was more than 1.5-fold change but did not reach significant level (p ≤ 0.5) between time points at D1 and D0, D2 and D0, or D2 and D1.
Figure 6
Figure 6
Increased expression of genes involved in synthesis of major cell wall components during M. tuberculosis regrowth. Changes of genes involved in major cell wall synthesis during M. tuberculosis regrowth relative to non-replicating persistent culture were identified by enrichment using the KEGG pathway and KEGG BRITE hierarchies. Data were derived from the RNA-Seq data of the reactivating bacilli from three independent cultures at each time point. Green color indicates up-regulation and red color denotes down-regulation. Color scale denotes log2 fold change in gene expression. Also included are genes (marked with asterisk) whose expression showed more than 1.5-fold change but did not reach significant level (p ≤ 0.5) between time points at D1 and D0, D2 and D0, or D2 and D1.
Figure 7
Figure 7
Regrowth dynamics of M. tuberculosis sigE and sigH mutants during exit from hypoxia-induced persistence. (A) Growth curves in the Wayne low oxygen model. (B) Regrowth curves during reactivation from non-replicating persistent state. (C) Relative regrowth during recovery from non-replicating persistent state. Cultures were grown for 25 days in the Wayne low oxygen model, diluted in fresh media, and then grown under aerobic condition. Growth was monitored by CFU enumeration. The initial cell density was adjusted to an arbitrary unit of 1.0 and measurements at each subsequent time point were reported as relative to this initial value. Shown are averages ± SD's of measurements from three independent cultures at each time point. *indicates significant changes at p ≤ 0.05 (student's t-test) between the mutant strains and WT at identical time points (C).

References

    1. Anders S., Huber W. (2010). Differential expression analysis for sequence count data. Genome Biol. 11:R106. 10.1186/gb-2010-11-10-r106 - DOI - PMC - PubMed
    1. Bai G., Knapp G. S., McDonough K. A. (2011). Cyclic AMP signalling in mycobacteria: redirecting the conversation with a common currency. Cell Microbiol. 13, 349–358. 10.1111/j.1462-5822.2010.01562.x - DOI - PMC - PubMed
    1. Balázsi G., Heath A. P., Shi L., Gennaro M. L. (2008). The temporal response of the Mycobacterium tuberculosis gene regulatory network during growth arrest. Mol. Syst. Biol. 4:225. 10.1038/msb.2008.63 - DOI - PMC - PubMed
    1. Barba J., Alvarez A. H., Flores-Valdez M. A. (2010). Modulation of cAMP metabolism in Mycobacterium tuberculosis and its effect on host infection. Tuberculosis 90, 208–212. 10.1016/j.tube.2010.03.002 - DOI - PubMed
    1. Becker K. W., Skaar E. P. (2014). Metal limitation and toxicity at the interface between host and pathogen. FEMS Microbiol. Rev. 38, 1235–1249. 10.1111/1574-6976.12087 - DOI - PMC - PubMed