Comparative Study
. 2016 Sep 15;12(9):e1005894.
doi: 10.1371/journal.ppat.1005894. eCollection 2016 Sep.

Exceptional Heterogeneity in Viral Evolutionary Dynamics Characterises Chronic Hepatitis C Virus Infection

Affiliations
Comparative Study

Exceptional Heterogeneity in Viral Evolutionary Dynamics Characterises Chronic Hepatitis C Virus Infection

Jayna Raghwani et al. PLoS Pathog. .

Abstract

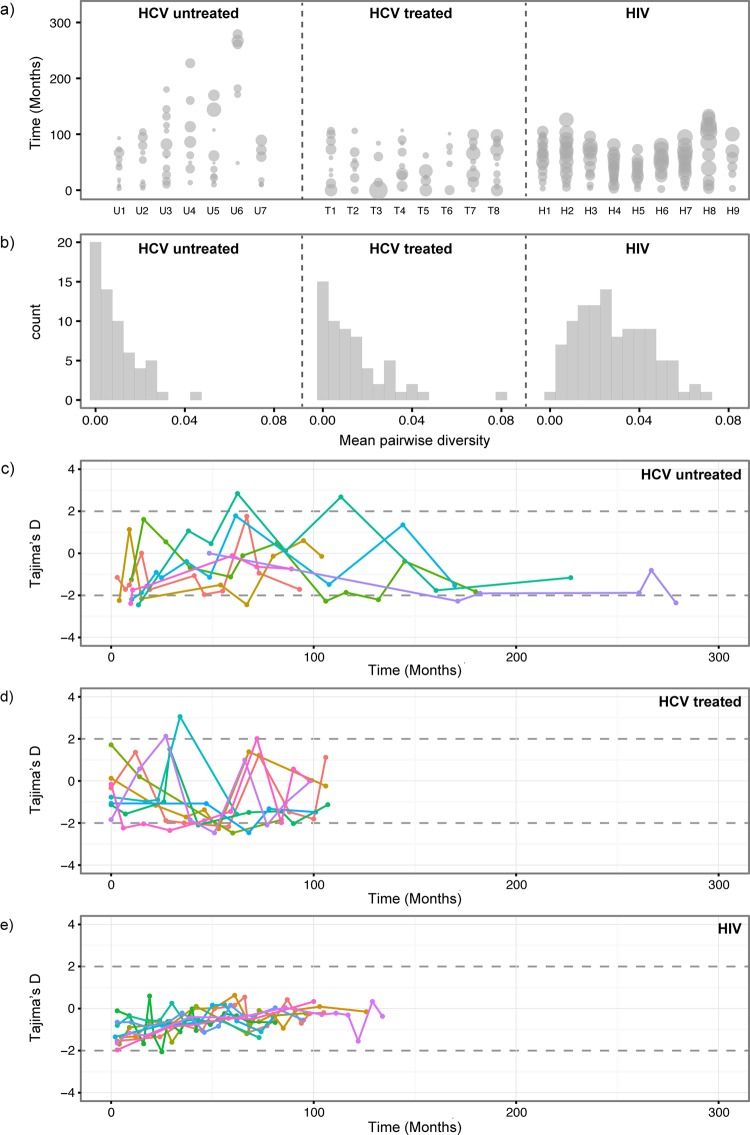
The treatment of HCV infection has seen significant progress, particularly since the approval of new direct-acting antiviral drugs. However these clinical achievements have been made despite an incomplete understanding of HCV replication and within-host evolution, especially compared with HIV-1. Here, we undertake a comprehensive analysis of HCV within-host evolution during chronic infection by investigating over 4000 viral sequences sampled longitudinally from 15 HCV-infected patients. We compare our HCV results to those from a well-studied HIV-1 cohort, revealing key differences in the evolutionary behaviour of these two chronic-infecting pathogens. Notably, we find an exceptional level of heterogeneity in the molecular evolution of HCV, both within and among infected individuals. Furthermore, these patterns are associated with the long-term maintenance of viral lineages within patients, which fluctuate in relative frequency in peripheral blood. Together, our findings demonstrate that HCV replication behavior is complex and likely comprises multiple viral subpopulations with distinct evolutionary dynamics. The presence of a structured viral population can explain apparent paradoxes in chronic HCV infection, such as rapid fluctuations in viral diversity and the reappearance of viral strains years after their initial detection.


Conflict of interest statement

RR is employed by BioInfExperts as bioinformatics consultant.

Figures

Fig 1
Fig 1. Per-sample summary statistics.
(a) Mean pairwise nucleotide diversity (MPD) for each time-point and each subject. The relative width of each circle represents MPD. Each column represents the values for one subject (U1-7, T1-8 and H1-9). The y-axis show the time of sampling. For subjects U1-7 and H1-9, time zero is the known (or closely estimated) date of infection. For subjects T1-8, time zero equals the date of the first sample. (b) The distribution of MPD values is shown for each group of patients. Panels (c), (d) and (e) show Tajima’s D estimates for each time-point and each subject. The different colours indicate different patients. The estimates above 2 and below -2 (indicated by dashed horizontal lines) correspond to significant deviation from neutrality. (c) Untreated HCV subjects U1-7. (d) Treated HCV subjects T1-8. (e) HIV subjects H1-9.
Fig 2
Fig 2. Estimation of evolutionary rates.
(a) Estimated mean viral evolutionary rate for each subject in the three groups (HCV untreated, HCV treated, and HIV). (b) Estimated coefficient of variation (COV) of the relaxed molecular clock, for each subject. Filled circles indicate estimates obtained under a molecular clock with a log-normal distribution of among-branch rates. Open circles indicate estimates obtained under a molecular clock with a skew-normal rate distribution of among-branch rates. The 95% highest posterior density (HPD) intervals for each estimate are indicated by vertical error bars.
Fig 3
Fig 3. Estimation of evolutionary rates for codon partitions.
Evolutionary rates for the two codon partitions (1+2 cp and 3cp) were estimated separately for each subject. Black squares indicate the mean evolutionary rate for 1+2cp sites, and white squares indicate the mean evolutionary rate for 3cp sites. The 95% HPD intervals for each estimate are indicated by vertical error bars.
Fig 4
Fig 4. Phylogenetic structure.
A maximum clade credibility phylogeny is shown for one representative subject from each patient group (HCV untreated, HCV treated, and HIV). Branches are scaled by time. Superimposed on each phylogeny, on the same timescale, is the estimated Bayesian skyline plot for that subject. The light grey line indicates the mean skyline plot estimate of effective population size through time. The darker grey areas indicate the 95% highest posterior density credible interval for that estimate. The distance between dotted vertical lines indicates one year. (a) Patient U3 from the HCV untreated group. (b) Patient T1 from the treated HCV group. (c) Patient H2 from the HIV cohort.

References

    1. Smith DB, Pathirana S, Davidson F, Lawlor E, Power J, Yap PL, et al. The origin of hepatitis C virus genotypes. J Gen Virol. 1997;78 (Pt 2):321–8. - PubMed
    1. Kato T, Date T, Miyamoto M, Furusaka A, Tokushige K, Mizokami M, et al. Efficient replication of the genotype 2a hepatitis C virus subgenomic replicon. Gastroenterology. 2003;125(6):1808–17. - PubMed
    1. Hezode C, Forestier N, Dusheiko G, Ferenci P, Pol S, Goeser T, et al. Telaprevir and peginterferon with or without ribavirin for chronic HCV infection. N Engl J Med. 2009;360(18):1839–50. 10.1056/NEJMoa0807650 - DOI - PubMed
    1. Poordad F, McCone J Jr., Bacon BR, u S, Manns MP, Sulkowski MS, et al. Boceprevir for untreated chronic HCV genotype 1 infection. N Engl J Med. 2011;364(13):1195–206. 10.1056/NEJMoa1010494 - DOI - PMC - PubMed
    1. Kohli A, Kapoor R, Sims Z, Nelson A, Sidharthan S, Lam B, et al. Ledipasvir and sofosbuvir for hepatitis C genotype 4: a proof-of-concept, single-centre, open-label phase 2a cohort study. Lancet Infect Dis. 2015;15(9):1049–54. 10.1016/S1473-3099(15)00157-7 - DOI - PMC - PubMed

Publication types