. 2016 Sep 15;14(9):e1002552.
doi: 10.1371/journal.pbio.1002552. eCollection 2016 Sep.

Sequence-Specific Targeting of Bacterial Resistance Genes Increases Antibiotic Efficacy

Affiliations

Sequence-Specific Targeting of Bacterial Resistance Genes Increases Antibiotic Efficacy

Dilay Hazal Ayhan et al. PLoS Biol. .

Abstract

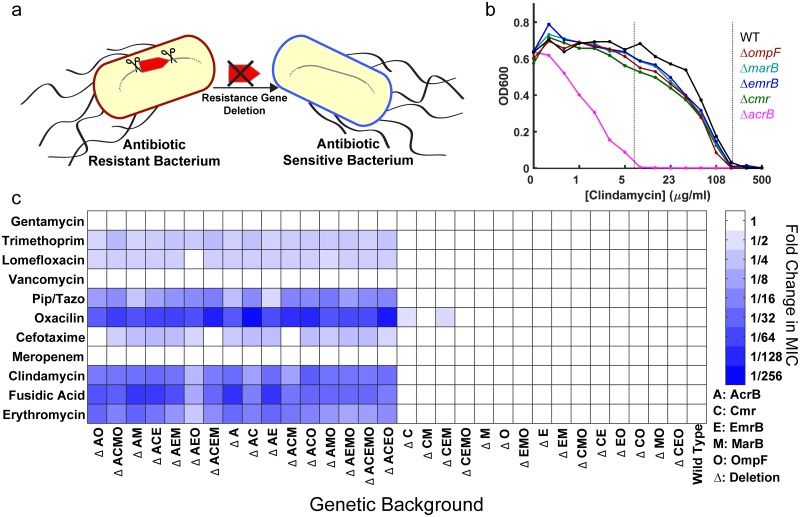
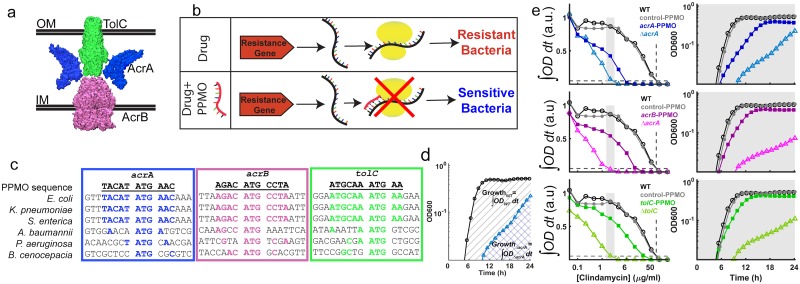
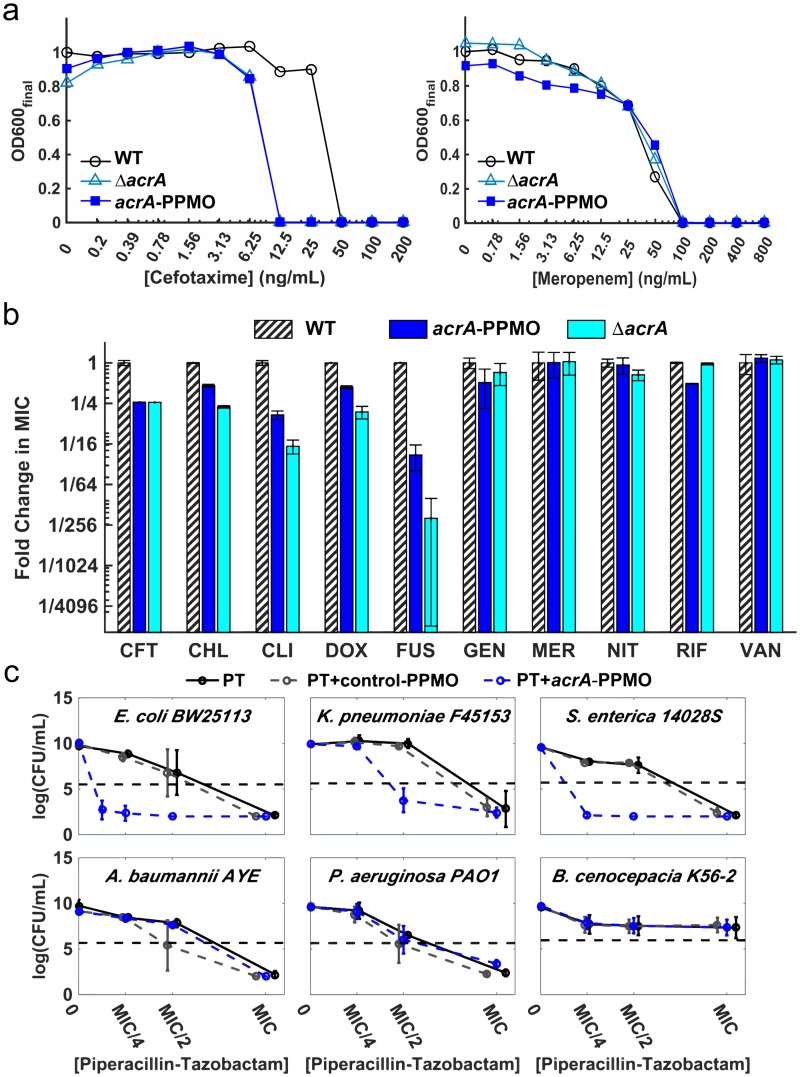
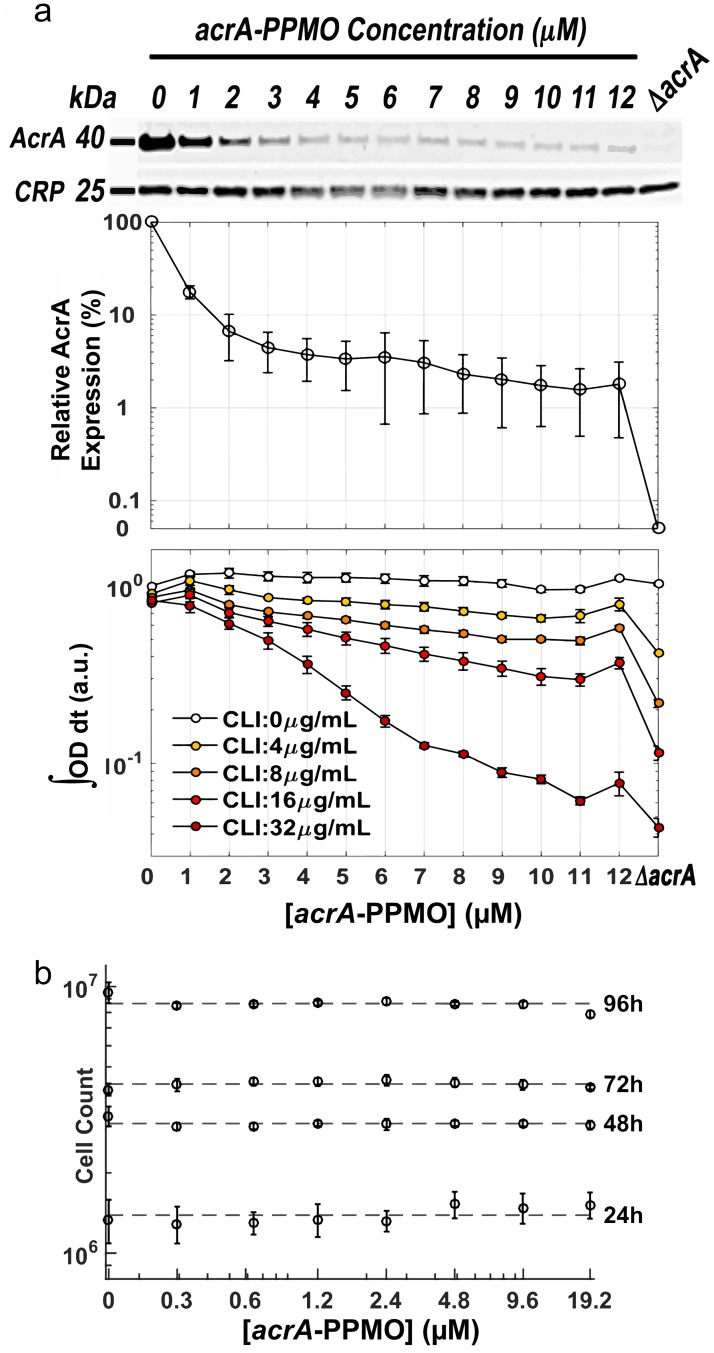
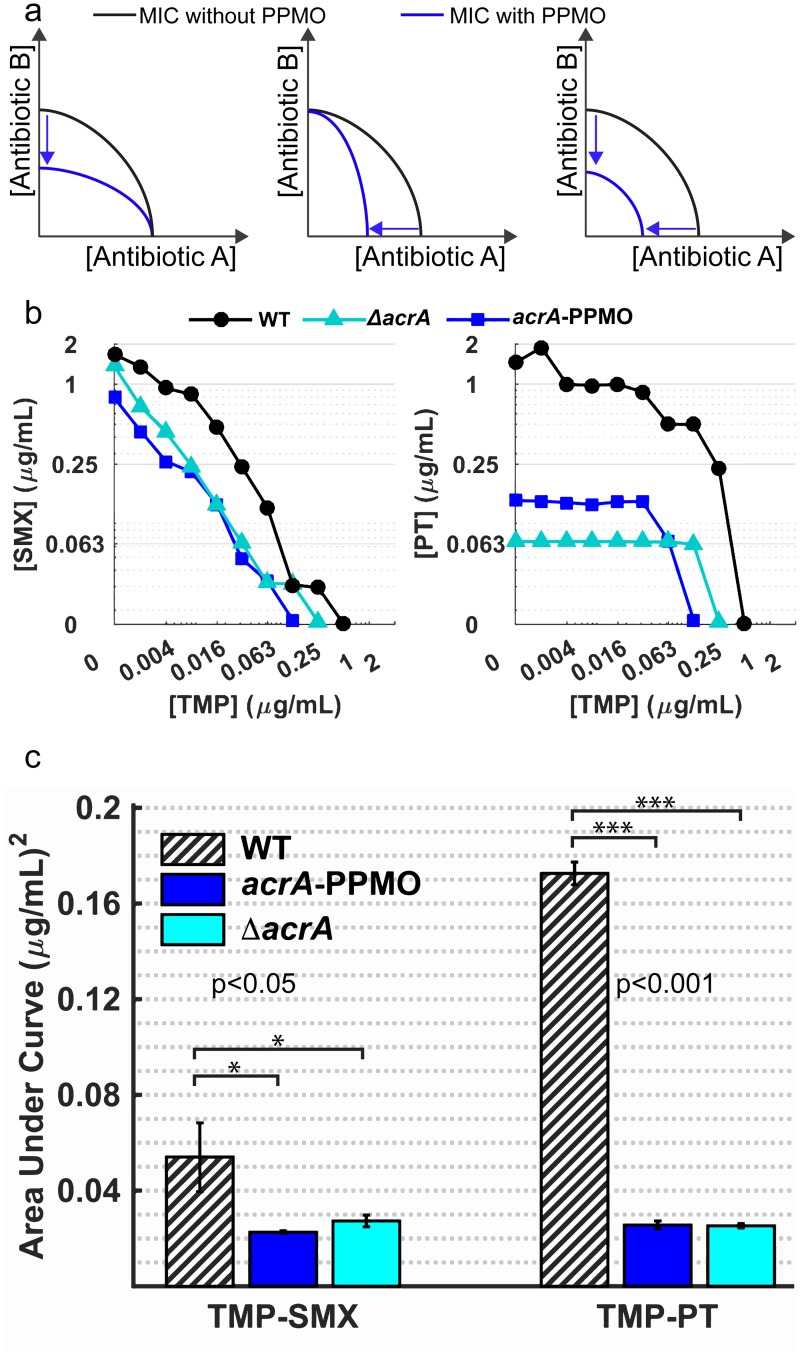
The lack of effective and well-tolerated therapies against antibiotic-resistant bacteria is a global public health problem leading to prolonged treatment and increased mortality. To improve the efficacy of existing antibiotic compounds, we introduce a new method for strategically inducing antibiotic hypersensitivity in pathogenic bacteria. Following the systematic verification that the AcrAB-TolC efflux system is one of the major determinants of the intrinsic antibiotic resistance levels in Escherichia coli, we have developed a short antisense oligomer designed to inhibit the expression of acrA and increase antibiotic susceptibility in E. coli. By employing this strategy, we can inhibit E. coli growth using 2- to 40-fold lower antibiotic doses, depending on the antibiotic compound utilized. The sensitizing effect of the antisense oligomer is highly specific to the targeted gene's sequence, which is conserved in several bacterial genera, and the oligomer does not have any detectable toxicity against human cells. Finally, we demonstrate that antisense oligomers improve the efficacy of antibiotic combinations, allowing the combined use of even antagonistic antibiotic pairs that are typically not favored due to their reduced activities.


Conflict of interest statement

MW and SMB are employees of Sarepta Therapeutics that hold numerous patents on the methods of synthesis and use of PPMOs. DEG receives research support from Sarepta Therapeutics, holds several patents related to PPMOs, and receives license-related royalties for these. All other authors declare no competing financial interest.

Figures

Fig 1
Fig 1. Systematic deletions of E. coli genes that encode for membrane proteins demonstrate that the AcrAB-TolC efflux system is the major machinery responsible for intrinsic antibiotic resistance.
(A) Physical deletion of a resistance gene in a bacterium may render the bacterium antibiotic sensitive. (B) Representative MIC determination using final optical density at 600 nm (OD600) values at 22 h of incubation with the wild type (WT) E. coli and gene deletion mutants in increasing doses of clindamycin. The left vertical dashed line represents the MIC concentration for the acrB deletion mutant (magenta) while the right vertical dashed line represents the MIC for the remaining strains (WT and the cmr, emrB, marB, ompF deletion mutants). (C) Heat map showing the normalized mean MIC values for every strain, measured as in (B). MIC values were normalized using the wild type strain as the reference. All MIC measurements were run at least in duplicate and were found to be highly reproducible (S2B Fig). Relative change of the MIC (compared to WT) is depicted colorimetrically with blue representing statistically significant decreases (p < 0.05) in MIC and white representing nonsignificant changes in MIC. Intensity of the blue color indicates the magnitude of MIC change. MIC changes for only 11 of the 27 tested antibiotic compounds are shown here. The heat map for all antibiotics can be found in S2A Fig and the numerical MIC values can be found in S1 Table.
Fig 2
Fig 2. Targeting the genes that encode for the AcrAB-TolC efflux pump complex increases antibiotic susceptibility.
(A) Cartoon representation of the AcrAB-TolC efflux system based on available crystal structures (PDB IDs: AcrA-2f1m, AcrB-2dhh, and TolC-1ek9). IM: Inner Membrane; OM: Outer Membrane. (B) PPMOs are antisense molecules that bind to complementary mRNAs and sterically interfere with their translation. Silencing resistance-conferring genes with this strategy leads to antibiotic susceptibility. (C) We have engineered three separate PPMOs in order to target the acrA (blue), acrB (magenta), and tolC (green) genes. These PPMOs target gene regions that span the start codons of the transcribed mRNA. Alignment of the acrA, acrB, and tolC genes of different bacterial genera demonstrate that the PPMO sequences, designed for E. coli, are also complementary in other pathogens. The overlapping nucleotides between the gene sequences and the PPMOs are highlighted in color. The PPMO sequences are homologous in Klebsiella pneumoniae and Salmonella enterica genes but have limited homology to the remaining bacterial species. (D) Growth of bacteria is quantified by calculating the area under the curve (AUC), which is simply integrating OD600 from 0 to 24 h (Materials and Methods). Area under the black (circles) and cyan lines (triangles) correspond to the growth of the wild type and acrA deletion E. coli strains, respectively, in a subinhibitory dose of clindamycin. (E) (Left) Dose response curves as a function of clindamycin concentration. Dose response curves are generated using the AUC values. Curves are labeled as untreated wild type E. coli (black lines, empty circles), with 10 μM control-PPMO (grey lines, filled circles), with 10 μM acrA-PPMO (top panel, blue lines, filled squares), E. coli with acrA deletion (top panel, cyan lines, empty triangles), with 10 μM acrB-PPMO (middle panel, magenta lines, filled squares), E. coli with acrB deletion (middle panel, pink lines, empty triangles), with 10 μM tolC-PPMO (bottom panel, dark green lines, filled squares), and E. coli with tolC deletion (bottom panel, light green lines, empty triangles). The horizontal dashed lines represent 95% growth inhibition, while the vertical lines represent the MIC value for WT. (Right) Sample OD600 versus time growth curves at the conditions shown within the grey shaded areas on the dose response curves (Left). Each line is interpolated, integrated and the AUC is normalized to the wild type growth in the absence of clindamycin. Dose response curves and corresponding MIC values for all 11 antibiotics may be found in S4 Fig and S2 Table, respectively.
Fig 3
Fig 3. acrA-PPMO confers hypersensitivity to several antibiotics in a sequence-specific manner.
(A) Sample antibiotic dose-response curves of E. coli in the absence of acrA-PPMO (black lines), in the presence of 10 μM acrA-PPMO (blue lines), and E. coli with acrA deletion (cyan lines). The MIC for each treatment is defined as the lowest concentration of antibiotic that results in a 95% reduction in the growth relative to the wild type E. coli in the presence of antibiotics (black lines). (B) Bar graphs of the measured fold changes in MIC values for wild-type E. coli in the absence of acrA-PPMO (black), 10 μM acrA-PPMO (blue), and with the acrA deletion (cyan). Abbreviations: CFT, cefotaxime; CHL, chloramphenicol; CLI, clindamycin; DOX, doxycycline; FUS, fusidic acid; GEN, gentamycin; MER, meropenem; NIT, nitrofurantoin; RIF, rifampicin; VAN, vancomycin. Every measurement was completed with four replicates, and error bars represent standard deviation. Phenotypic effects of acrA deletion and acrA silencing with acrA-PPMO are highly correlated (r = 0.94, p < 0.001, Pearson correlation test). (C) Killing of E. coli (BW25113), K. pneumoniae (F45153), S. enterica (14028S), Acinetobacter baumannii (AYE), Pseudomonas aeruginosa (PAO1), and Burkholderia cenocepacia (K56-2) by piperacillin-tazobactam alone (black line) or in combination with 10 μM control-PPMO (grey dashed line), or acrA-PPMO (blue dashed line) after 18 h incubation. The horizontal dashed line represents the inoculum (5 x 10⁵ CFU/mL) prior to incubation. The x-axis represents the normalized MIC concentration of piperacillin-tazobactam, corresponding to different MIC values for each pathogen. Error bars represent the standard deviations of the colony forming unit (CFU) counts obtained from at least four replicate measurements.
Fig 4
Fig 4. acrA-PPMO blocks acrA translation in a dose-dependent fashion and is nontoxic to HBEC3KT human cells.
(A) AcrA expression in E. coli with increasing concentrations of acrA-PPMO was quantified using an anti-AcrA antibody (top panel). AcrA expression was normalized against the expression of cAMP receptor protein (CRP). Error bars represent the standard deviations of normalized AcrA protein levels for six experimental replicates (middle panel). E. coli growth in fixed concentrations of clindamycin with increasing concentrations of acrA-PPMO is calculated by calculating the AUC growth in different experimental conditions (bottom panel). Error bars represent the standard deviation of growth rate changes of four experimental replicates. (B) acrA-PPMO has nonsignificant levels of toxicity to HBEC3KT human cells. HBEC3KT human cells were incubated with increasing doses of acrA-PPMO, and the number of viable cells was determined (Cell-Titer-Glo, Promega) every 24 h for 4 d. Error bars represent the standard deviation of cell counts obtained from ten replicate experiments.
Fig 5
Fig 5. Targeting resistance genes with acrA-PPMO increases efficacy of antibiotic combinations and even makes the use of antagonistic antibiotic pairs possible.
(A) Conceptual representation of the possible effects of efflux inhibition on the use of antibiotics pairs. Blue and black lines represent the MIC lines in two-dimensional gradients of drug pairs for bacteria with and without acrA-PPMO, respectively. The left panel represents an increase in susceptibility to antibiotic B, the middle panel represents an increase to antibiotic A, and the right panel represents an increase to both antibiotics. (B) MIC lines determined in two-dimensional gradients of (left) trimethoprim-sulfamethoxazole and (right) trimethoprim-piperacillin/tazobactam for wild type E. coli (black line), with 10 μM acrA-PPMO (blue line), or the acrA deletion mutant (cyan line). (C) Bar graphs demonstrating the efficacy of antibiotic combinations shown in (B). Area under the MIC curves in (B) are significantly reduced relative to the wild type E. coli (bars with black diagonal lines) for both antibiotic combinations when 10 μM acrA-PPMO (blue bars) is used or acrA (cyan bars) is physically deleted. All measurements were done in triplicate, and p-values for significance were calculated with Student’s t-test.

References

    1. Levy SB, Marshall B. Antibacterial resistance worldwide: causes, challenges and responses. Nat Med. 2004;10: S122–129. - PubMed
    1. Szybalski W, Bryson V. Genetic studies on microbial cross resistance to toxic agents. I. Cross resistance of Escherichia coli to fifteen antibiotics. J Bacteriol. 1952;64: 489–499. - PMC - PubMed
    1. Alekshun MN, Levy SB. Molecular mechanisms of antibacterial multidrug resistance. Cell. 2007;128: 1037–1050. - PubMed
    1. Bush K, Courvalin P, Dantas G, Davies J, Eisenstein B, Huovinen P, et al. Tackling antibiotic resistance. Nat Rev Microbiol. 2011;9: 894–896. 10.1038/nrmicro2693 - DOI - PMC - PubMed
    1. Oz T, Guvenek A, Yildiz S, Karaboga E, Tamer YT, Mumcuyan N, et al. Strength of selection pressure is an important parameter contributing to the complexity of antibiotic resistance evolution. Mol Biol Evol. 2014;31: 2387–2401. 10.1093/molbev/msu191 - DOI - PMC - PubMed

MeSH terms