Multicenter Study
. 2016 Dec;64(6):1934-1950.
doi: 10.1002/hep.28819. Epub 2016 Oct 28.

Characterization of the Specificity, Functionality, and Durability of Host T-Cell Responses Against the Full-Length Hepatitis E Virus

Affiliations
Multicenter Study

Characterization of the Specificity, Functionality, and Durability of Host T-Cell Responses Against the Full-Length Hepatitis E Virus

Anthony Brown et al. Hepatology. 2016 Dec.

Abstract

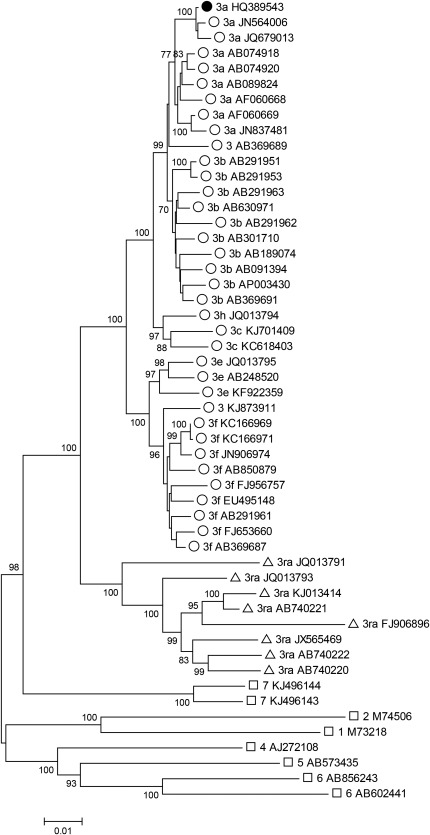
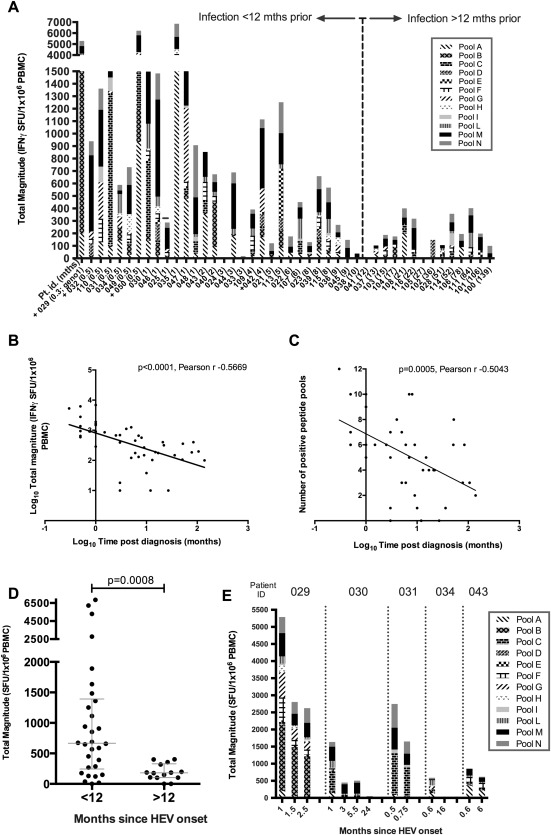
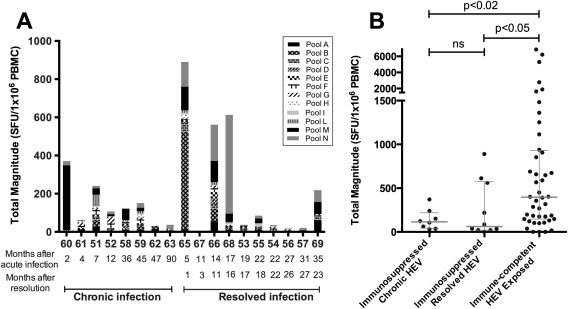
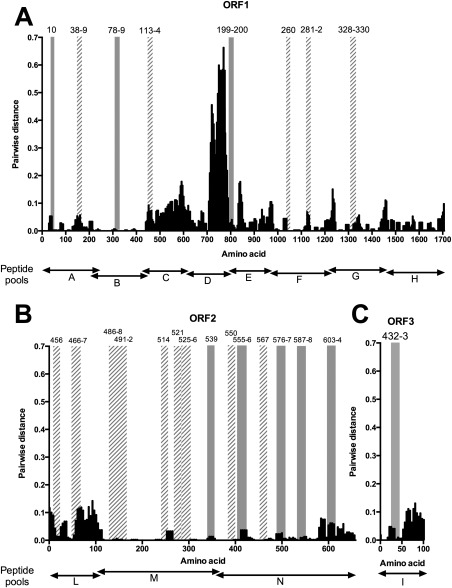
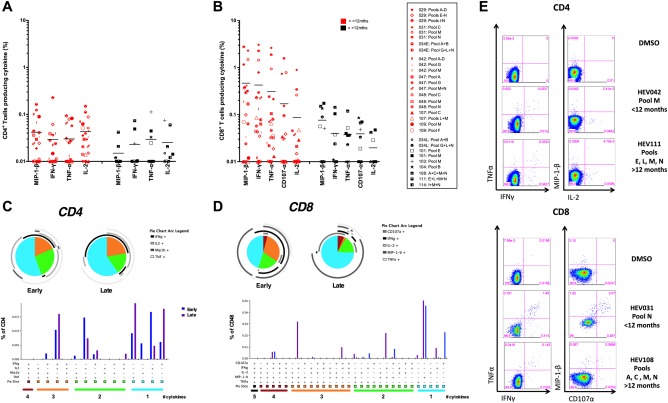
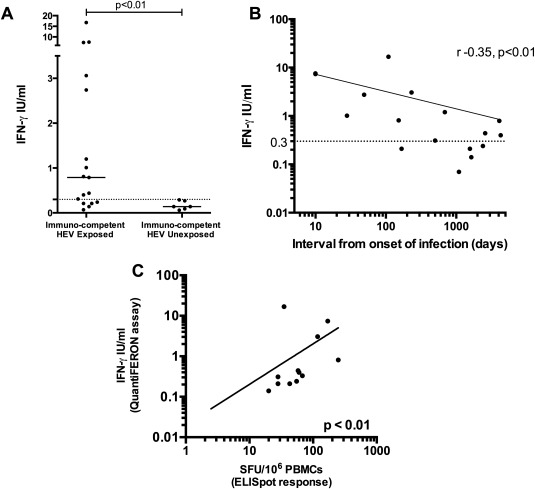
The interplay between host antiviral immunity and immunopathology during hepatitis E virus (HEV) infection determines important clinical outcomes. We characterized the specificity, functionality, and durability of host T-cell responses against the full-length HEV virus and assessed a novel "Quantiferon" assay for the rapid diagnosis of HEV infection. Eighty-nine volunteers were recruited from Oxford, Truro (UK), and Toulouse (France), including 44 immune-competent patients with acute HEV infection, 18 HEV-exposed immunosuppressed organ-transplant recipients (8 with chronic HEV), and 27 healthy volunteers. A genotype 3a peptide library (616 overlapping peptides spanning open reading frames [ORFs] 1-3) was used in interferon-gamma (IFN-γ) T-cell ELISpot assays. CD4+ /CD8+ T-cell subsets and polyfunctionality were defined using ICCS and SPICE analysis. Quantification of IFN-γ used whole-blood stimulation with recombinant HEV-capsid protein in the QuantiFERON kit. HEV-specific T-cell responses were detected in 41/44 immune-competent HEV exposed volunteers (median magnitude: 397 spot-forming units/106 peripheral blood mononuclear cells), most frequently targeting ORF2. High-magnitude, polyfunctional CD4 and CD8+ T cells were detected during acute disease and maintained to 12 years, but these declined over time, with CD8+ responses becoming more monofunctional. Low-level responses were detectable in immunosuppressed patients. Twenty-three novel HEV CD4+ and CD8+ T-cell targets were mapped predominantly to conserved genomic regions. QuantiFERON testing demonstrated an inverse correlation between IFN-γ production and the time from clinical presentation, providing 100% specificity, and 71% sensitivity (area under the receiver operator characteristic curve of 0.86) for HEV exposure at 0.3 IU/mL.

Conclusion: Robust HEV-specific T-cell responses generated during acute disease predominantly target ORF2, but decline in magnitude and polyfunctionality over time. Defining HEV T-cell targets will be important for the investigation of HEV-associated autoimmune disease. (Hepatology 2016;64:1934-1950).


Figures

Figure 1
Figure 1
Phylogenetic analysis of HEV complete genome sequences. A neighbor‐joining tree was produced using a Poisson model of AA distances between 36 concatenated ORF1 and ORF2 regions (but not including the ORF1 hypervariable region) from human‐derived HEV genotype 3 isolates (open circles), rabbit‐derived genotype 3 isolates (open triangles), and reference sequences of other genotypes (open squares). Sequence HQ389543 (subtype 3a) that was used to generate the peptide set is shown with a filled circle. Branches supported by >70% of bootstrap replicates are indicated.
Figure 2
Figure 2
Total magnitude of HEV specific T‐cell responses in immune‐competent HEV‐exposed subjects measured by IFN‐γ ELISpot assay. (A) IFN‐ γ ELISpot responses displayed according to time interval (<12 months or >12 months) between diagnosis and assessment of T‐cell responses. x‐axis: individual subject number; the number in brackets represents the time interval (in months). Individuals who had detectable virus (PCR) at the time of the assay are indicated with a + on the x‐axis label, and the 1 patient infected with genotype 1 HEV (029) is labeled “geno1.” y‐axis: Each column represents the summed IFN‐γ ELISpot response to HEV peptide pools (A‐I, L‐N) for an individual patient. Individual shading patterns within bars indicate the contributing response of each peptide pool (see legend). (B) Pearson's correlation analysis of total magnitude of IFN‐γ ELISpot response (y‐axis; log10 scale) with increasing time from diagnosis in months (x‐axis; log10 scale). Linear regression line has been plotted. (C) Pearson's correlation analysis for number of positive peptide pools (y‐axis; linear scale) with increasing time from diagnosis in months (x‐axis; log10 scale). Linear regression line has been plotted. (D) Summed IFN‐γ ELISpot responses in individuals grouped according to an interval of either <12 months or >12 months between HEV infection and assessment. Horizontal lines represent group medians (±interquartile range). (E) Longitudinal IFN‐γ ELISpot responses, plotted as total magnitude (y‐axis) assessed over time (indicated on x‐axis) in 5 individual volunteers after onset of acute HEV infection.
Figure 3
Figure 3
IFN‐γ ELISpot responses in immunosuppressed patients with resolved or chronic HEV infection. (A) Each bar represents the summed IFN‐γ ELISpot response for an individual patient to HEV peptide pools. Individual shading patterns within bars indicate the contributing response of each pool (see legend). x‐axis: individual patient numbers with the interval (in months) between diagnosis of acute infection and sampling shown below. In patients who resolved HEV infection, the number of months since clearance at time of sampling is also shown. (B) Immunosuppressed patients with either chronic HEV infection (HEV+ by PCR) or resolved HEV infection (HEV IgG+, HEV by PCR) compared with total HEV response in 44 immune‐competent HEV‐exposed individuals. Horizontal lines represent group medians (±interquartile range). Abbreviation: ns, not significant.
Figure 4
Figure 4
Location of reactive peptides and AA variability. The distribution of mean AA pair‐wise distances among concatenated human HEV‐3 ORF1, ORF2, and ORF3 sequences is shown for each 15‐mer peptide. The same human genotype 3 sequences were used as in Fig. 1. ORFs 1‐3 are displayed in separate plots A‐C respectively. Vertical bars indicate the position of reactive peptides detailed in Table 2A; peptides that were targeted by a single volunteer are shown by solid gray bars whereas those targeted by multiple volunteers have diagonally striped bars. The peptide pool boundaries (A‐I and L‐N) are shown below each graph. The x‐axis indicates amino acid position in each ORF relative to AF082843.
Figure 5
Figure 5
Functionality of T‐cell responses following HEV peptide stimulation (A,B); percentages of CD4+ (A) or CD8+ (B) T cells producing a given cytokine (background subtracted). Each symbol represents a patient's response to PBMC stimulation overnight (16 hours) with a peptide pool or pools assessed by intracellular cytokine staining. Fourteen immunocompetent HEV‐exposed individuals were assessed (for subject IDs, see legend). Symbols in red are subjects with an interval between diagnosis and collection of PBMCs of <12 months (n = 21); those in black are >12 months (n = 9). Horizontal lines represent group means. (C,D) Polyfunctionality of T‐cell responses to HEV peptide pool stimulation. SPICE analysis was performed on positive CD8+ and CD4+ T‐cell responses from 14 immunocompetent HEV‐exposed volunteers (responses >0.03% of CD4+ or CD8+ T cells producing any single cytokine assessed were considered positive) measured at an early time point (<12 months) or a late time point postdiagnosis (>12 months). Pie charts represent the proportion of cytokine‐secreting cells that produce one, two, three, and four cytokines (IFN‐γ, TNF‐α, MIP‐1‐β, and/or IL‐2) for CD4+ T cells and up to five cytokines (CD107α) for CD8+ T cells. Pie arcs show the proportion of T cells producing a single cytokine. Bar and pie base, median. (E) Example ICS FACS plots: staining for TNF‐α versus IFN‐γ and MIP‐1‐β versus IL‐2 for CD4+ T cells and TNF‐α versus IFN‐γ and MIP‐1‐β versus CD107α for CD8+ T cells after stimulation with pooled HEV peptides or DMSO (negative control). Plots are gated on live, CD3+, CD4+, or CD8+ T cells.
Figure 6
Figure 6
Quantitative assessment of IFN‐γ production by whole blood in response to HEV antigen 239. (A) Six unexposed healthy volunteers compared to 17 immune‐competent HEV‐exposed individuals. Complete horizontal lines represent group medians; the horizontal dotted line represents an arbitrary cut off of 0.3 IU/mL. (B) IFN‐γ production assessed using the QuantiFERON assay. The x‐axis (log scale) represents the time (days) between clinical onset of HEV infection and sample collection. The y‐axis (log scale) is the plasma IFN‐γ concentration after stimulation of whole blood in vitro with HEV antigen 239. (C) Spearman's correlation analysis between QuantiFERON results (y‐axis; log10 scale) and IFN‐γ ELISpot (x‐axis; log10 scale) response to the peptide pool (pool N) corresponding to HEV antigen 239. Lines of best fit are demonstrated on graphs (B) and (C).

References

    1. Rein DB, Stevens GA, Theaker J, Wittenborn JS, Wiersma ST. The global burden of hepatitis E virus genotypes 1 and 2 in 2005. Hepatology 2012;55:988–997. - PubMed
    1. Mansuy JM, Bendall R, Legrand‐Abravanel F, Saune K, Miedouge M, Ellis V, et al. Hepatitis E virus antibodies in blood donors, France. Emerg Infect Dis 2011;17:2309–2312. - PMC - PubMed
    1. Dalton HR, Bendall R, Ijaz S, Banks M. Hepatitis E: an emerging infection in developed countries. Lancet Infect Dis 2008;8:698–709. - PubMed
    1. Khuroo MS. Discovery of hepatitis E: the epidemic non‐A, non‐B hepatitis 30 years down the memory lane. Virus Res 2011;161:3–14. - PubMed
    1. Smith DB, Ijaz S, Tedder RS, Hogema B, Zaaijer HL, Izopet J, et al. Variability and pathogenicity of hepatitis E virus genotype 3 variants. J Gen Virol 2015;96:3255–3264. - PMC - PubMed

Publication types

Substances