. 2016 Sep 15;12(9):e1005074.
doi: 10.1371/journal.pcbi.1005074. eCollection 2016 Sep.

Systems Biology-Based Investigation of Cellular Antiviral Drug Targets Identified by Gene-Trap Insertional Mutagenesis

Affiliations

Systems Biology-Based Investigation of Cellular Antiviral Drug Targets Identified by Gene-Trap Insertional Mutagenesis

Feixiong Cheng et al. PLoS Comput Biol. .

Abstract

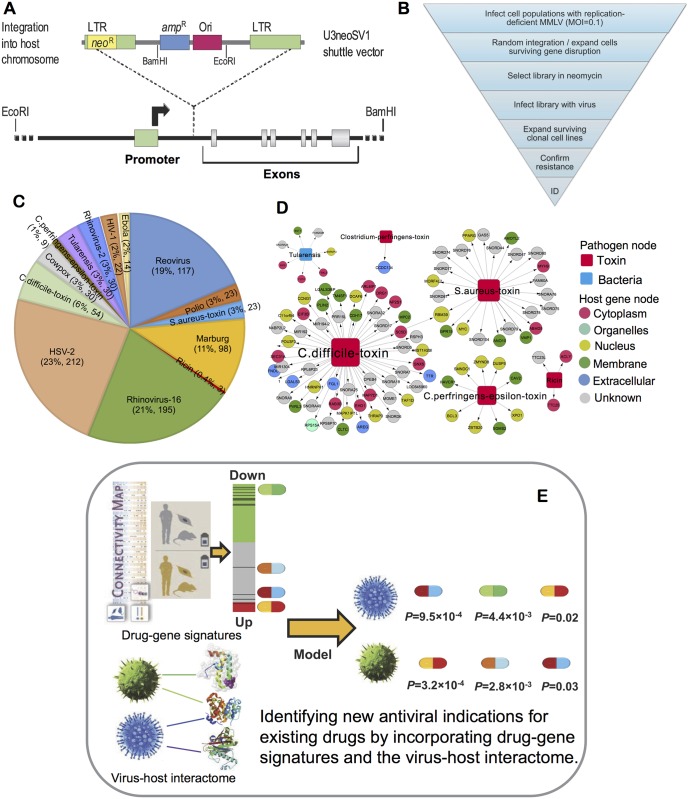
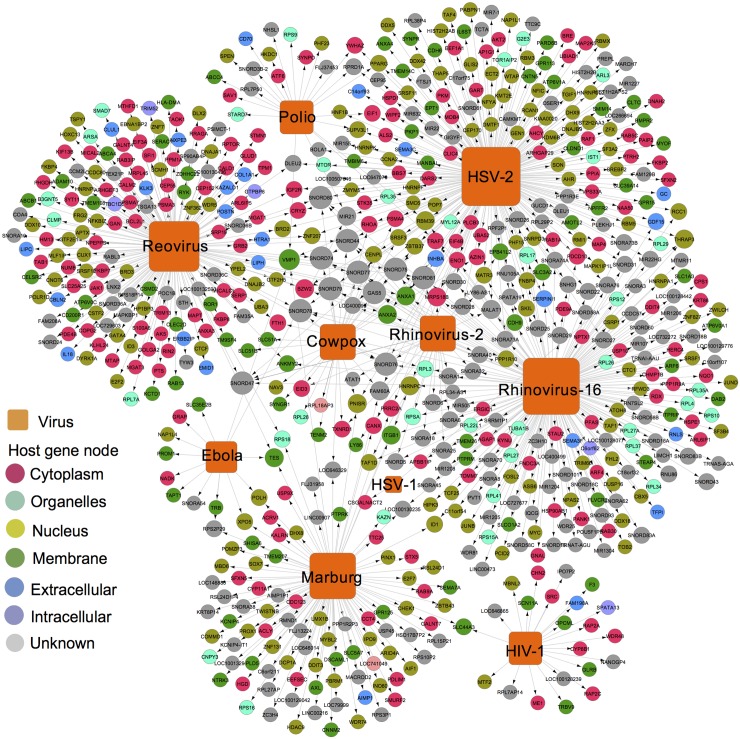
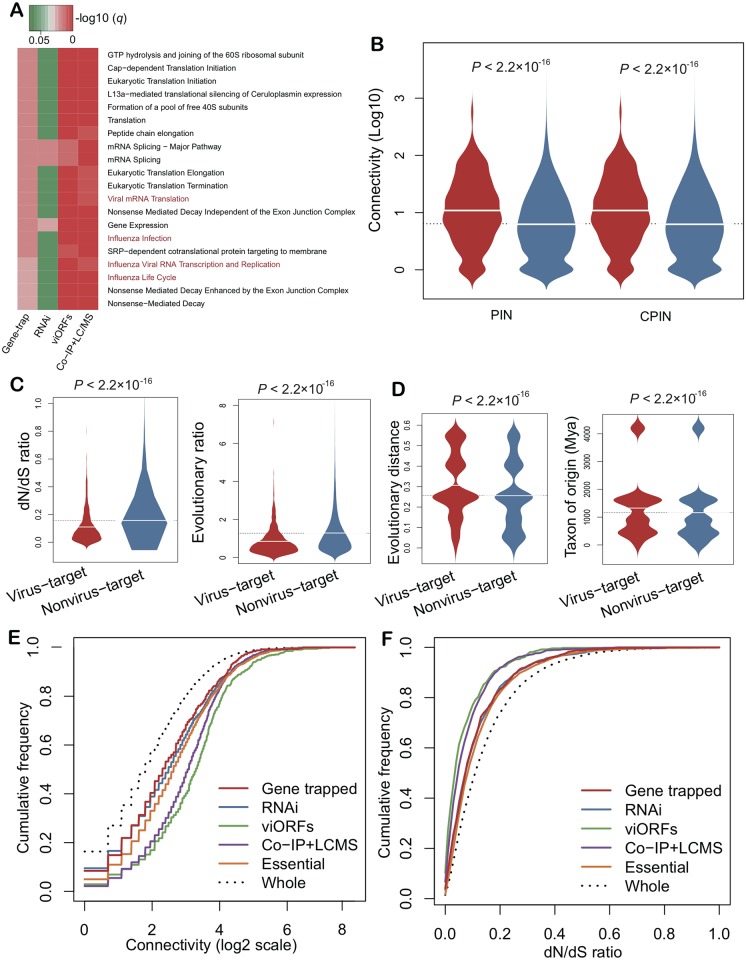
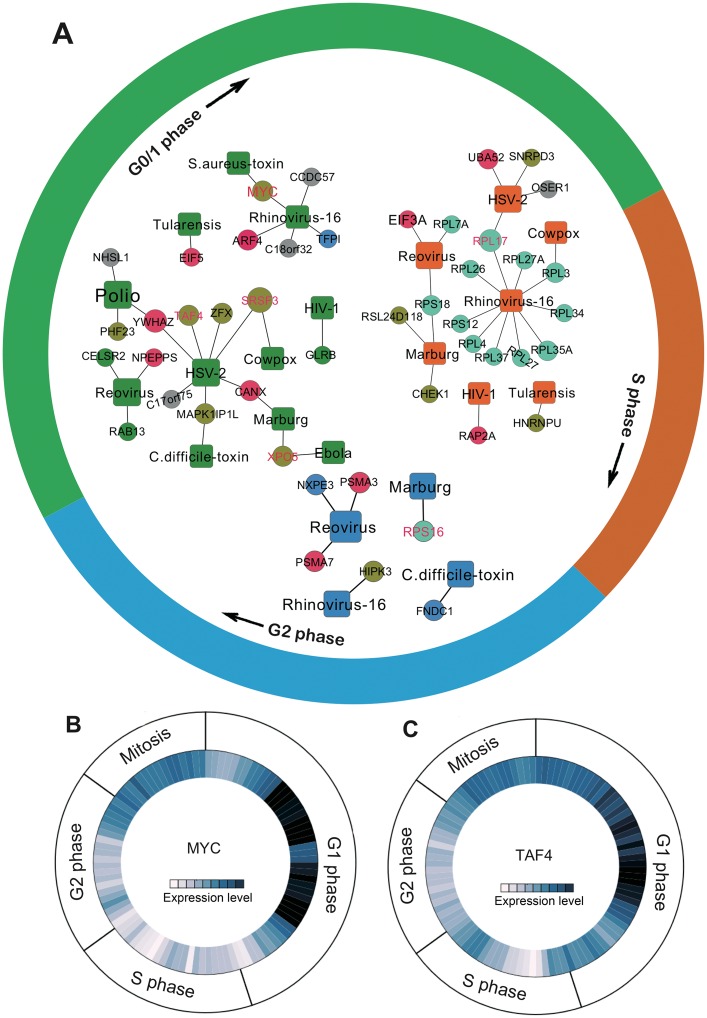
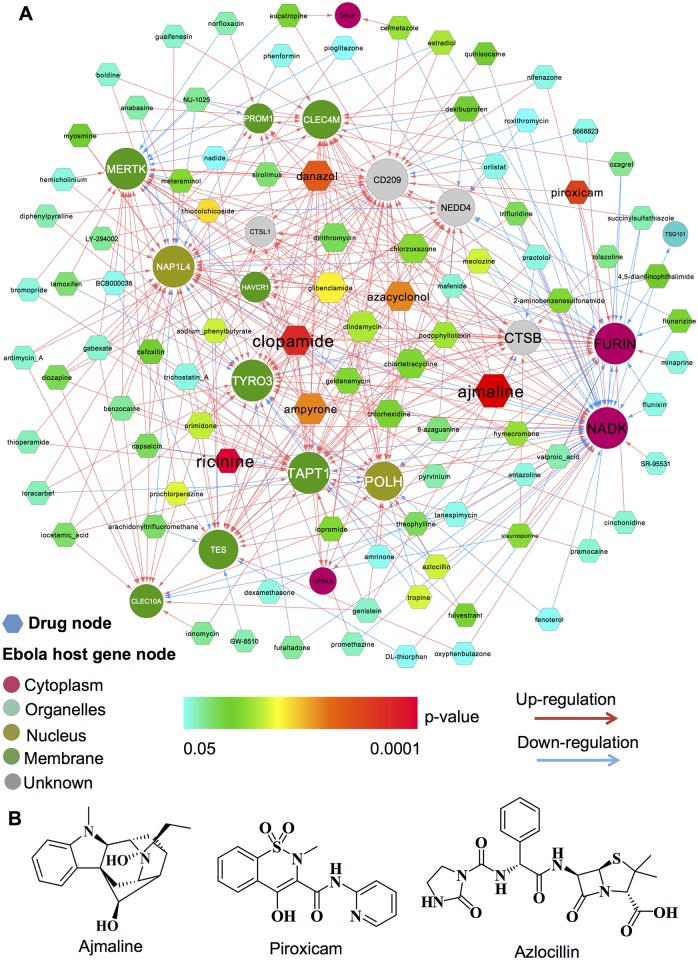
Viruses require host cellular factors for successful replication. A comprehensive systems-level investigation of the virus-host interactome is critical for understanding the roles of host factors with the end goal of discovering new druggable antiviral targets. Gene-trap insertional mutagenesis is a high-throughput forward genetics approach to randomly disrupt (trap) host genes and discover host genes that are essential for viral replication, but not for host cell survival. In this study, we used libraries of randomly mutagenized cells to discover cellular genes that are essential for the replication of 10 distinct cytotoxic mammalian viruses, 1 gram-negative bacterium, and 5 toxins. We herein reported 712 candidate cellular genes, characterizing distinct topological network and evolutionary signatures, and occupying central hubs in the human interactome. Cell cycle phase-specific network analysis showed that host cell cycle programs played critical roles during viral replication (e.g. MYC and TAF4 regulating G0/1 phase). Moreover, the viral perturbation of host cellular networks reflected disease etiology in that host genes (e.g. CTCF, RHOA, and CDKN1B) identified were frequently essential and significantly associated with Mendelian and orphan diseases, or somatic mutations in cancer. Computational drug repositioning framework via incorporating drug-gene signatures from the Connectivity Map into the virus-host interactome identified 110 putative druggable antiviral targets and prioritized several existing drugs (e.g. ajmaline) that may be potential for antiviral indication (e.g. anti-Ebola). In summary, this work provides a powerful methodology with a tight integration of gene-trap insertional mutagenesis testing and systems biology to identify new antiviral targets and drugs for the development of broadly acting and targeted clinical antiviral therapeutics.


Conflict of interest statement

JLM was previously employed by Zirus, Inc and is currently employed by GeneTAG Technology, Inc. The authors confirm they have no competing interests.

Figures

Fig 1
Fig 1. Diagram of the integrative antiviral drug discovery pipeline.
(A) The gene-trap insertional mutagenesis approach employs an MMLV-based shuttle vector that randomly integrates into host cell chromosomes and contains a promoterless neomycin-resistance gene. Shuttle vector integration between a host-cell promoter and an early exon disrupts (traps) the gene, allowing neomycin selection and derivation of a gene-trap library. (B) Host genes mediating the toxic effects of lytic viral replication or exposure to toxins were identified by: (i) selecting gene-trap libraries in neomycin; (ii) exposing gene-trap library cells to a lytic virus or a toxin; (iii) isolating surviving clones; (iv) resistance confirmation in surviving clones following exposure to a 10-fold higher dose of the virus or toxin studied; and (v) identification of the trapped gene by digesting genomic DNA to liberate shuttle vectors, self-ligation, bacterial transform, ampicillin selection, and sequencing trapped genes in the recovered plasmids. (C) Distribution of newly discovered virus-host interaction pairs for 10 viruses, 1 bacterium, and 5 toxins. (D) Global pathogen-host interaction network identified by genome-wide gene-trap insertional mutagenesis, where toxins and bacteria are represented by red and cyan squares respectively. The host cell gene products (circles) are colored based on their subcellular locations collected from the LocDB (https://www.rostlab.org/services/locDB/). (E) Identification of candidates for antiviral drug repositioning approach by incorporating drug-gene signatures from the Connectivity Map into the global virus-host interactome.
Fig 2
Fig 2. The newly identified virus-host interaction networks by gene-trap insertional mutagenesis.
The nodes (squares) are viruses, host cell gene products (circles) are colored based on their subcellular locations collected from LocDB (https://www.rostlab.org/services/locDB/), and edges (lines) denote interactions identified by gene-trap insertional mutagenesis.
Fig 3
Fig 3. Bioinformatics analysis and network topological and evolutionary characteristics of host genes mediating viral replication.
(A) Reactome pathway enrichment analysis of four different host cellular gene sets identified by gene-trap insertional mutagenesis (trapped genes), previous RNA interference (RNAi) screening studies, viral open reading frames (viORFs), and co-immunoprecipitation and liquid chromatography-mass spectrometry (Co-IP+LC/MS) (S1 Table). (B) Boxplots showing the connectivity distribution of virus host genes (red) versus non-virus-host genes (light blue) in the physical protein interaction network (PIN) and large-scale computationally predicted protein interaction network (CPIN). (C) and (D) Evolutionary characteristics of virus-host genes (red) versus non-virus-host genes (light blue). (E) Node connectivity distribution of host genes identified by gene-trap insertional mutagenesis and three published gene sets and all proteins (Whole) in PIN. (F) Gene dN/dS ratio cumulative distribution for four different gene sets and whole human genome (Whole). Mya: million years ago. P values in B-D were calculated via Wilcoxon rank-sum test.
Fig 4
Fig 4. Human cell cycle phase-specific virus-host gene network.
(A) Human cell cycle phase-specific virus-host gene network for host genes identify by gene-trap insertional mutagenesis. The concise overview of cell cycle regulation for gene MYC (B) and TAF4 (C). Dark color represents high expression across different cell cycle phases. Images in B and C are prepared by Cyclebase 3.0 (http://www.cyclebase.org).
Fig 5
Fig 5. Disease etiology analysis of virus target genes.
(A) Venn diagram denoting the overlap among virus-target genes (Host genes), genes whose mutations are significantly associated with cancer (Driver), genes in the Cancer Gene Census (CGC, experimentally validated cancer genes), the catalogue of cancer genes (CCG), Mendelian disease genes (MDG), orphan-disease mutated genes (ODMG), and essential genes (Essential). (B) Disease gene enrichment analysis of virus-target genes (solid bars) versus nonvirus-target genes (striped bars). P values are calculated using Fisher’s exact test.
Fig 6
Fig 6. Novel viral perturbations of the innate immunity network reveal new cancer etiologies.
In this network, nodes represent viruses (squares), cancer types (hexagons), and genes (circles). Edges represent virus-host interactions (solid red arrows), cancer-gene associations (striped red arrows), and innate immunity protein-protein interactions (solid gray lines). Various cancer types represented are abbreviated as follows: breast invasive carcinoma (BRCA), bladder urothelial carcinoma (BLCA), colon adenocarcinoma (COAD), diffuse large B-cell lymphoma (DLBCL), glioblastoma multiforme (GBM), head and neck squamous cell carcinoma (HNSC), acute myeloid leukemia (LAML), kidney renal clear cell carcinoma (KIRC), lung adenocarcinoma (LUAD), multiple myeloma (MM), and uterine corpus endometrial carcinoma (UCEC). Detailed data are provided in S5 Table.
Fig 7
Fig 7. Global antiviral bipartite drug-target interaction network.
In this network, nodes represent 691 virus-target genes (Host genes, squares) or known drugs (2,071) shown in circles, and where edges denote the interactions. Host gene products were colored based on their known subcellular locations. All drugs were grouped using the First-level anatomical therapeutic chemical (ATC) code classification system. Detailed data are provided in S7 Table.
Fig 8
Fig 8. Novel drug-target interaction network for inhibiting anti-Ebola virus replication.
(A) The newly discovered anti-Ebola virus drug-target interaction network, where nodes represent drugs (hexagons) or host genes (circles), and edges represent up-regulated (red lines) or down-regulated (blue lines) genes following drug treatment, as determined using the Connectivity Map data [20]. Target gene product nodes were colored based on their subcellular locations, and drug nodes were colored based on P values (Fisher’s exact test) calculated by our proposed computational approach (Fig 1E). (B) Chemical structures for three example drugs with significant P values. Detailed data is provided in S8 Table.

References

    1. Khabbaz RF, Moseley RR, Steiner RJ, Levitt AM, Bell BP (2014) Challenges of infectious diseases in the USA. Lancet 384: 53–63. 10.1016/S0140-6736(14)60890-4 . - DOI - PMC - PubMed
    1. 2013 Report on the Global AIDS Epidemic. Website: http://www.unaids.org/en/resources/campaigns/globalreport2013/factsheet/.
    1. 2014 Ebola Outbreak in West Africa-Reported Cases. Website: http://www.cdc.gov/vhf/ebola/outbreaks/2014-west-africa/cumulative-cases....
    1. Strauss S (2014) Biotech drugs too little, too late for Ebola outbreak. Nat Biotechnol 32: 849–850. 10.1038/nbt0914-849a - DOI - PubMed
    1. Carette JE, Raaben M, Wong AC, Herbert AS, Obernosterer G, et al. (2011) Ebola virus entry requires the cholesterol transporter Niemann-Pick C1. Nature 477: 340–343. 10.1038/nature10348 - DOI - PMC - PubMed

Publication types

Substances

LinkOut - more resources