Review
. 2016 Sep 15;11(9):e0162853.
doi: 10.1371/journal.pone.0162853. eCollection 2016.

3D Cell Culture in a Self-Assembled Nanofiber Environment

Affiliations
Review

3D Cell Culture in a Self-Assembled Nanofiber Environment

Yi Wen Chai et al. PLoS One. .

Abstract

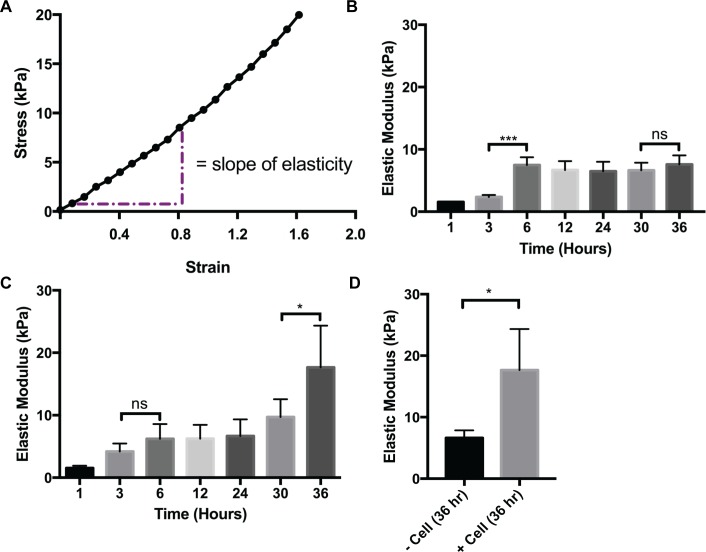
The development and utilization of three-dimensional cell culture platforms has been gaining more traction. Three-dimensional culture platforms are capable of mimicking in vivo microenvironments, which provide greater physiological relevance in comparison to conventional two-dimensional cultures. The majority of three-dimensional culture platforms are challenged by the lack of cell attachment, long polymerization times, and inclusion of undefined xenobiotics, and cytotoxic cross-linkers. In this study, we review the use of a highly defined material composed of naturally occurring compounds, hyaluronic acid and chitosan, known as Cell-Mate3DTM. Moreover, we provide an original measurement of Young's modulus using a uniaxial unconfined compression method to elucidate the difference in microenvironment rigidity for acellular and cellular conditions. When hydrated into a tissue-like hybrid hydrocolloid/hydrogel, Cell-Mate3DTM is a highly versatile three-dimensional culture platform that enables downstream applications such as flow cytometry, immunostaining, histological staining, and functional studies to be applied with relative ease.


Conflict of interest statement

JHB is the inventor of Cell—Mate3D and is a shareholder and the founder, Chairman of the Board of Directors and Chief Science Officer of Bioactive Regenerative Therapeutics, Inc. (BRTI) Life Sciences, and YC, EL and JDG are employees of BRTI Life Sciences. This does not alter our adherence to PLOS ONE policies on sharing data and materials.

Figures

Fig 1
Fig 1. Viability over time in CM3D.
A) HeLa CM3D cultured cells were stained with calcein AM (live-green) and EthD-1 homodimer (dead-red). Cross sections of the stained CM3D cultures were imaged at 4X magnification. Cell viability is represented in the bar graph as a mean percentage of live cells over total live and dead cells. Scale bar = 1000um. B) Scatter plot representing HeLa cell viability trend in CM3D over 30 days. SD error bars for each time point was analyzed from the live percentage in five fields of one experiment cross section (n = 1). C) The scatter plot represents BrdU incorporation into cells over time. BrdU positive cells were scored in 5 randomly selected fields from a cross section of a CM3D (n = 1) and is represented as a percentage of proliferating cells over total proliferating and non-proliferating cells. Results are expressed as a ±SD of the proliferation percentage over 28 days.
Fig 2
Fig 2. Flow Cytometry analysis of cells isolated from CM3D cultures vs 2D cultures.
A) & C) SSC vs FSC plots from 2D cultures and cells isolated from CM3D cultures, respectively. Gates were set accordingly to exclude debris. B) & D) Cells were gated for CD44 (x-axis) and CD24 (y-axis).
Fig 3
Fig 3. SEM images of acellular and cellular CM3D.
A) Interior, cross sectional surfaces produced by freeze fracture of acellular CM3D, showing the interaction between HA (red arrow) and CT (orange arrow) on Day 21 (Original Magnification 700X). B) Interaction of cells with CM3D on Day 28. Cells within CM3D (red arrow) grow inside the crevices created by the formation of HA-CT fibers (Orig. Mag. 1000X). C) Interaction of cells and CM3D on day 21. Cells are spread out on the periphery (red arrow) of CM3D while some cells appear to be interacting with one another (700X). D) Cell to cell interaction as an aggregate cell mass (red arrow) attached to the periphery of CM3D (700X). E) CT only shard imaged prior to being blended with HA. This image was taken on its surface. The white scale bar for all images is 50μm in length.
Fig 4
Fig 4. Fluorescence analysis of cells in CM3D.
A) 60X confocal images of HeLa cells cultured in 2D or CM3D. DAPI (blue) was used for nuclear staining, Vinculin (red) was labeled with with Alexa Flour 568 (red), and phalloidin (green) for actin fibers. White arrows indicate focal adhesion sites. B) & C) 3D rendering of HeLa CM3D cultures. White arrows indicate lamellipodia. D) SEM image of cells interacting with the PEC fibers of CM3D. Black arrows indicate lamellipodia interacting and attaching to the surrounding matrix.
Fig 5
Fig 5. Mechanical Properties Analysis of CM3D.
A) Region of elastic modulus for CM3D stiffness. B) Graph representing acellular (- cells) CM3D stiffness. C) Graph representing cellular (+ cells) CM3D stiffness. D) Graph representing acellular and cellular CM3D stiffness at hour 36. To determine the statistical significance between acellular and cellular CM3D respectively, the one-way ANOVA/Kruskall–Wallis test was performed followed by a Dunn’s Multiple Comparison post hoc test. The student’s t-test was performed to determine the statistical significance between acellular and cellular CM3D stiffness at hour 36, a student’s t-test was performed. Values indicate average stiffness or modulus values, and ±SD of n = 4 repeats.
Fig 6
Fig 6. Migration Analysis of CM3D.
A) Bar graph represents the number of cells migrating out of CM3D cultures in the presence and absence of a chemoattractant. Values generated by the student’s t-test analysis indicate that average migration and ±SD of n = 8 repeats.

References

    1. Nema R, Khare S. An animal cell culture: Advance technology for modern research. Advances in Bioscience and Biotechnology 2012;3:219–26. 10.4236/abb.2012.33030 - DOI
    1. Bissell MJ, Barcellos-Hoff MH. The influence of extracellular matrix on gene expression: is structure the message? Journal of Cell Science Supplement 1987;8:327–43. - PubMed
    1. Cancedda FD, Gentili C, Manduca P, Cancedda R. Hypertrophic chondrocytes undergo further differentiation in culture. Journal of Cell Biology 1992;117:427–35. 10.1083/jcb.117.2.427 - DOI - PMC - PubMed
    1. Zschenker O, Streichert T, Hehlgans S, Cordes N. Genome-wide gene expression analysis in cancer cells reveals 3D growth to affect ECM and processes associated with cell adhesion but not DNA repair. PloS One 2012;7:e34279 10.1371/journal.pone.0034279 - DOI - PMC - PubMed
    1. Lovitt C, Shelper T, Avery V. Advanced Cell Culture Techniques for Cancer Drug Discovery. Biology 2014;3:345–67. 10.3390/biology3020345 - DOI - PMC - PubMed

LinkOut - more resources