

The Health Economic Value of Changes in Glycaemic Control, Weight and Rates of Hypoglycaemia in Type 1 Diabetes Mellitus
- PMID: 27632534
- PMCID: PMC5025276
- DOI: 10.1371/journal.pone.0162441
The Health Economic Value of Changes in Glycaemic Control, Weight and Rates of Hypoglycaemia in Type 1 Diabetes Mellitus
Abstract
Aims: Therapy-related consequences of treatment for type 1 diabetes mellitus (T1DM), such as weight gain and hypoglycaemia, act as a barrier to attaining optimal glycaemic control, indirectly influencing the incidence of vascular complications and associated morbidity and mortality. This study quantifies the individual and combined contribution of changes in hypoglycaemia frequency, weight and HbA1c to predicted quality-adjusted life-years (QALYs) within a T1DM population.
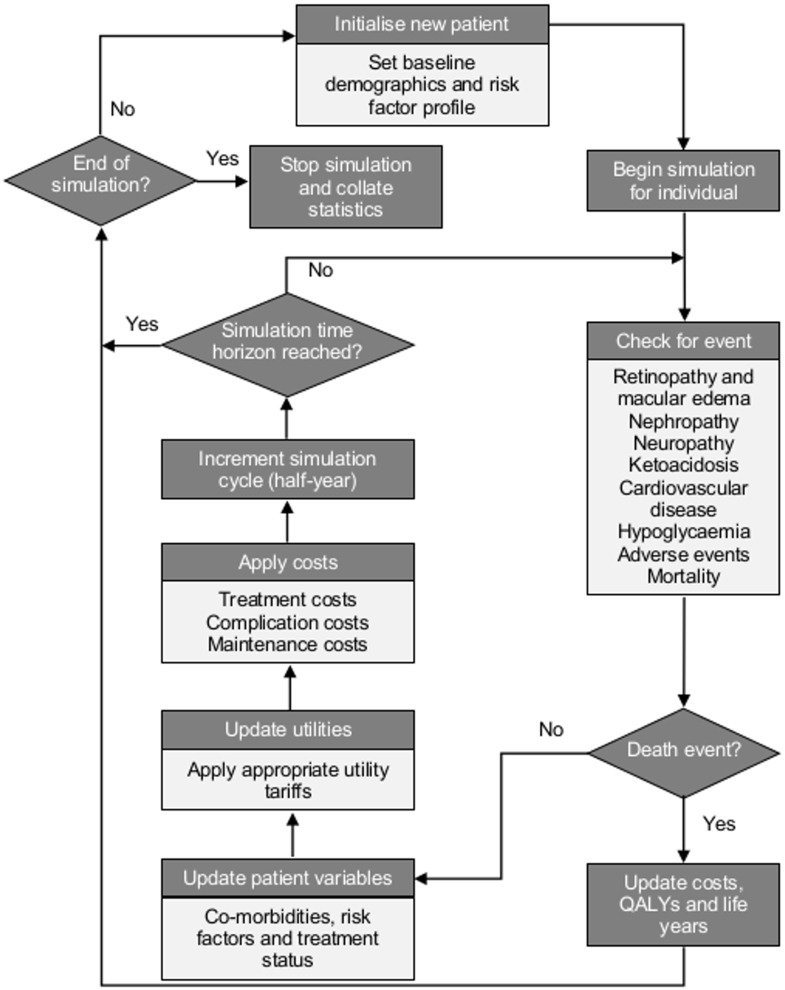
Materials and methods: We describe the Cardiff Type 1 Diabetes (CT1DM) Model, originally informed by the Diabetes Control and Complications Trial (DCCT) and updated with the Epidemiology of Diabetes Interventions and Complications (EDIC) study and Swedish National Diabetes Registry for microvascular and cardiovascular complications respectively. We report model validation results and the QALY impact of HbA1c, weight and hypoglycaemia changes.
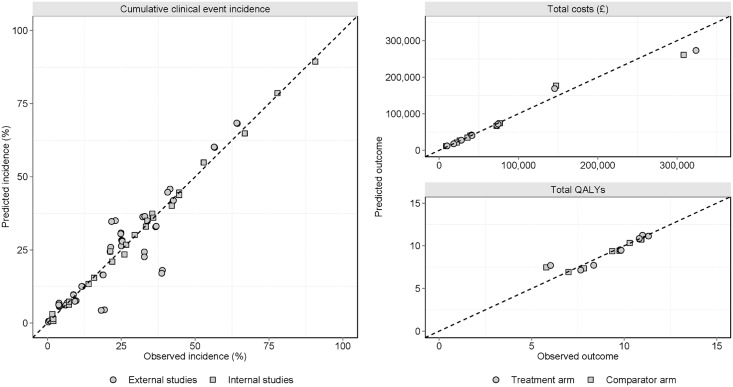
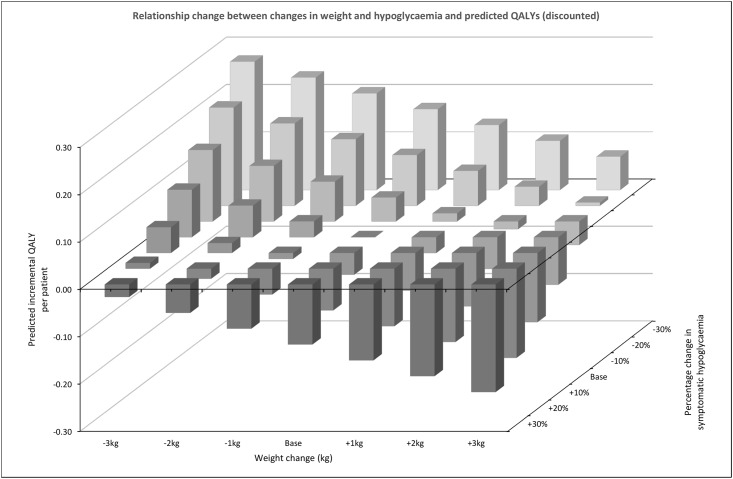
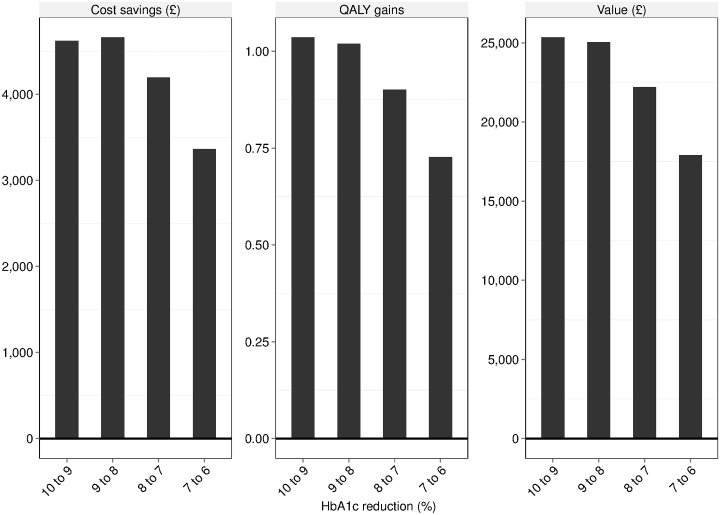
Results: Validation results demonstrated coefficients of determination for clinical endpoints of R2 = 0.863 (internal R2 = 0.999; external R2 = 0.823), costs R2 = 0.980 and QALYs R2 = 0.951. Achieving and maintaining a 1% HbA1c reduction was estimated to provide 0.61 additional discounted QALYs. Weight changes of ±1kg, ±2kg or ±3kg led to discounted QALY changes of ±0.03, ±0.07 and ±0.10 respectively, while modifying hypoglycaemia frequency by -10%, -20% or -30% resulted in changes of -0.05, -0.11 and -0.17. The differences in discounted costs, life-years and QALYs associated with HbA1c 6% versus 10% were -£19,037, 2.49 and 2.35 respectively.
Conclusions: Using a model updated with contemporary epidemiological data, this study presents an outcome-focused perspective to assessing the health economic consequences of differing levels of glycaemic control in T1DM with and without weight and hypoglycaemia effects.
Conflict of interest statement
I have read the journal's policy and the authors of this manuscript have the following competing interests: PM, HB and JF are employed by HEOR Ltd., which received funding support in the form of a grant from AstraZeneca plc. The funding agreement ensured PM, HB and JF's independence in designing the study, interpreting the data, writing, and publishing the report. Authors JP and KB are employed by AstraZeneca. This does not alter the authors' adherence to PLOS ONE policies on sharing data and materials.
Figures
References
-
- Diabetes Control and Complications Trial Research Group. The effect of intensive treatment of diabetes on the development and progression of long-term complications in insulin dependent diabetes mellitus. The New England journal of medicine. 1993;329(14):977–86. - PubMed
-
- Holman N, Young B, Gadsby R. Current prevalence of Type 1 and Type 2 diabetes in adults and children in the UK. Diabetic medicine: a journal of the British Diabetic Association. 2015;32(9):1119–20. - PubMed
-
- National Institute for Health and Care Excellence. NICE guidelines [NG17]. Type 1 diabetes in adults: diagnosis and management 2015. Available from: https://www.nice.org.uk/guidance/ng17. - PubMed
-
- Amiel SA, Pursey N, Higgins B, Dawoud D. Diagnosis and management of type 1 diabetes in adults: summary of updated NICE guidance. BMJ. 2015;351. - PubMed
Publication types
MeSH terms
Substances
LinkOut - more resources
Full Text Sources
Other Literature Sources
Medical
