. 2016 Sep 15;12(9):e1005882.
doi: 10.1371/journal.ppat.1005882. eCollection 2016 Sep.

IL-1 Coordinates the Neutrophil Response to C. albicans in the Oral Mucosa

Affiliations

IL-1 Coordinates the Neutrophil Response to C. albicans in the Oral Mucosa

Simon Altmeier et al. PLoS Pathog. .

Abstract

Mucosal infections with Candida albicans belong to the most frequent forms of fungal diseases. Host protection is conferred by cellular immunity; however, the induction of antifungal immunity is not well understood. Using a mouse model of oropharyngeal candidiasis (OPC) we show that interleukin-1 receptor (IL-1R) signaling is critical for fungal control at the onset of infection through its impact on neutrophils at two levels. We demonstrate that both the recruitment of circulating neutrophils to the site of infection and the mobilization of newly generated neutrophils from the bone marrow depended on IL-1R. Consistently, IL-1R-deficient mice displayed impaired chemokine production at the site of infection and defective secretion of granulocyte colony-stimulating factor (G-CSF) in the circulation in response to C. albicans. Strikingly, endothelial cells were identified as the primary cellular source of G-CSF during OPC, which responded to IL-1α that was released from keratinocytes in the infected tissue. The IL-1-dependent crosstalk between two different cellular subsets of the nonhematopoietic compartment was confirmed in vitro using a novel murine tongue-derived keratinocyte cell line and an established endothelial cell line. These data establish a new link between IL-1 and granulopoiesis in the context of fungal infection. Together, we identified two complementary mechanisms coordinating the neutrophil response in the oral mucosa, which is critical for preventing fungal growth and dissemination, and thus protects the host from disease.


Conflict of interest statement

The authors have declared that no competing interests exist.

Figures

Fig 1
Fig 1. IL-1R signaling makes an important contribution to neutrophil recruitment to the oral mucosa.
(A) CD45+ Ly6Cint Ly6G+ neutrophils were quantified by flow cytometry in the tongues of naïve (n) and C. albicans infected (inf) WT mice 24 hours post-infection. (B) Neutrophils were quantified in the tongues of infected WT and Il1r1 -/- mice 24 hours post-infection. (C) The fungal burden in the tongues of infected WT and Il1r1 -/- mice was determined on day 3 post-infection. Each symbol represents an individual mouse, and the lines represent the geometric mean of each group. The dotted line represents the detection limit. Data are pooled from two (B) or representative of three (A) or two (C) independent experiments. Statistical analysis was performed using log10 transformation and Student’s t-test with Welch’s correction.
Fig 2
Fig 2. Neutrophil-recruiting chemokines in the oral mucosa are reduced in absence of IL-1R signaling.
(A) Chemokine expression in the tongues of naïve (n) and infected (inf) WT mice was measured by qRT-PCR 24 hours post-infection. (B) Chemokine expression in the tongues of naïve and infected WT and infected Il1r1 -/- mice 24 hours post-infection. (C) CD45+ leukocytes, CD45- EpCAM+ CD31- epithelial cells, and CD45- EpCAM- CD31+ endothelial cells were isolated from the tongues of naïve and infected WT mice by FACS sorting 24 hours post-infection, and Cxcl1 mRNA was quantified by qRT-PCR. (D) The tongue-derived keratinocyte (TDK) cell line was treated with recombinant IL-1α (20 ng/ml), anakinra (250 μg/ml), or PBS, and CXCL1 levels in the culture supernatant were determined by ELISA. Bar graphs show the group mean + SD. Data are representative of two (A, C–D) or pooled from two (B) independent experiments, with the exception of the naïve group in B, which is from one experiment. Statistical analysis was performed using log10 transformation and Student’s t-test with Welch’s correction (A) or one-way ANOVA with Dunnett’s test (B, D).
Fig 3
Fig 3. G-CSF induces emergency granulopoiesis during OPC.
(A) Csf3 mRNA expression in the tongues of naïve (n) and infected (inf) WT mice was quantified by qRT-PCR 24 hours post-infection. (B) Total numbers of CD45+ cells in the bone marrow of naïve (n) and infected (inf) WT mice were assessed by flow cytometry. (C) Representative FACS plots showing the analysis of Ly6Ghi CD11b+ Ly6Cint mature neutrophils and Ly6Glo CD11b+ Ly6Cint immature neutrophils in the bone marrow of naïve and infected WT mice. Depicted events were pre-gated on singlets, scatter, CD45+ alive cells. Numbers indicate the % of cells in each gate. (D—E) Analysis of Ly6Ghi mature neutrophils (D) and Ly6Glo immature neutrophils (E) in the bone marrow of naïve (n) and infected (inf) WT mice 24 hours post-infection. (F–G) As in D–E, but mice were treated with anti-G-CSF or left untreated prior to infection as indicated. (H–J) WT mice were treated with anti-Ly6G and/or anti-G-CSF antibody or left untreated prior to infection as indicated. CD45+ CD11bhi Ly6Cint neutrophils were quantified in the blood (H) and tongues (I) 24 hours post-infection. The fungal burden in the tongue was determined on day 3 post-infection (J). Each symbol represents an individual mouse and the lines represent the mean (B, D–G) or geometric mean (A, H—J) of each group. Data are pooled from two (F, G) or representative of two independent experiments (A–E, H–J). Statistical analysis was performed using log10 transformation (A, H–J) and Student’s t-test with Welch’s correction (A–B, D–E) or a one-way ANOVA with Dunnett’s test (F–J).
Fig 4
Fig 4. Endothelial cells are the primary source of G-CSF production during OPC.
(A) CD45+ leukocytes, CD45- EpCAM+ CD31- epithelial cells, and CD45- EpCAM- CD31+ endothelial cells were isolated from the tongues of naïve and infected WT mice by FACS sorting 24 hours post-infection, and Csf3 mRNA was quantified by qRT-PCR. (B) Tongue cell populations were sorted from the tongues of naïve and infected WT mice as in (A). Cell lysates were generated from the sorted populations and G-CSF protein was quantified in the lysates by ELISA. (C) G-CSF levels were determined in the serum of naïve (n) and infected (inf) WT mice by ELISA. Data are pooled from two (B) or representative of two (A) or five (C) independent experiments. Bar graphs show the group mean + SD. Statistical analysis was performed using Student’s t-test with Welch’s correction.
Fig 5
Fig 5. Endothelial cell-derived G-CSF in the oral mucosa is IL-1-dependent.
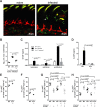
(A) VE-cadherin-cre x ROSA26-RFP mice were infected with C. albicans strain pACT1-GFP or left uninfected. The images show each a 3D reconstruction of a Z stack of a 20x fields of view acquired from whole mount samples of naïve or infected tongues 24 hours post-infection. Fungal hyphae are identified in the avascular tongue epithelium by their morphology and green fluorescence (white arrow). The papillae appear yellow due to both green and red autofluorescence. Muscle cells display green autofluorescence. (B) Csf3 mRNA was quantified in the tongues of naïve WT and infected WT and Il1r1 -/- mice by qRT-PCR 24 hours post-infection. (C) CD45+ leukocytes, CD45- EpCAM+ CD31- epithelial cells and CD45- EpCAM- CD31+ endothelial cells were isolated from the tongues of naïve WT and infected WT and Il1r1 -/- mice by FACS sorting 24 hours post-infection. Cell lysates were prepared from the sorted populations and G-CSF protein was quantified in the lysates by ELISA. The data of the WT mice are identical with those shown in Fig 4B. (D) G-CSF levels were determined in the serum of naïve (open bars) and infected (closed bars) WT and Il1r1 -/- mice by ELISA 24 hours post-infection. (E–F) Quantification of Ly6Ghi mature neutrophils (E) and Ly6Glo immature neutrophils (F) in the bone marrow of infected WT and Il1r1 -/- mice analyzed 24 hours post-infection. (G–H) As in (E–F), but mice were treated with recombinant G-CSF or left untreated as indicated. Each symbol represents an individual mouse and the lines represent the mean (E–H) or geometric mean (B) of each group. Bar graphs in C–D show the group mean + SD. Data are pooled from two (B–C, G–H) or representative of two (A, D–F) independent experiments, with the exception of the naive group in B, which is from one experiment. Statistical analysis was performed using log10 transformation (B) and Student’s t-test with Welch’s correction (C, E–F), a one-way ANOVA with Tukey’s test (G—H) or Dunnett’s test (B), or two way ANOVA with Tukey’s test (D).
Fig 6
Fig 6. Keratinocyte-derived IL-1α regulates G-CSF production during OPC.
(A) Il1a and Il1b mRNA was quantified in the tongues of naïve (n) and infected (inf) WT mice by qRT-PCR 24 hours post-infection. (B–C) WT, Il1a -/- and Il1b -/- mice were infected with C. albicans. Csf3 mRNA levels in naïve and infected tongue tissue were determined by qRT-PCR (B), and G-CSF serum levels were measured by ELISA (C) before infection (open bars) and 24 hours post-infection (closed bars). (D) Immunofluorescent staining of sagittal tongue sections from naïve and infected WT and Il1a -/- mice stained for IL-1α (yellow) and DAPI (blue) 24 hours post-infection. (E) Immunofluorescent staining of sagittal tongue sections from infected WT mice stained for keratin-6 (K6, left) or keratin-14 (K14, right) in red, as well as IL-1α (yellow) and DAPI (blue) 24 hours post-infection. Note that the IL-1α signal is absent in neutrophil-rich areas. The white arrow serves as orientation. (F) IL-1α and IL-1β mRNA expression in the tongues of naïve WT and infected WT, Il1a -/- and Il1b -/- mice was measured by qRT-PCR 24 hours post-infection. The detection limit, which was calculated using the average Ct (Actb) of all samples and Ct (Il1a) or Ct (Il1b) = 50, is depicted by a dotted line. Each symbol represents an individual mouse (A–B, F) and the lines represent the geometric mean of each group. The bar graph in C shows the group mean + SD. Data are representative of two independent experiments (A, D–E), or pooled from two independent experiments (B–C, F), with the exception of the naïve groups in C, which are the mean + SD of 4 (WT) or 3 (Il1a -/-, Il1b -/-) animals from one experiment. Statistical analysis was performed using log10 transformation (A–B, F) and Student’s t-test with Welch’s correction (A), a one-way ANOVA with Dunnett’s test (B, F) or two-way ANOVA with Tukey’s test (C).
Fig 7
Fig 7. TDKs release IL-1α in response to C. albicans.
(A—B) TDKs were stimulated with C. albicans, zymosan, curdlan or left untreated (PBS), and IL-1α (A) and IL-1β (B) levels were determined in the supernatant by cytometric bead array. (C) IL-1α release from TDKs was determined as in (A) after stimulation with live or heat-killed (HK) C. albicans strain SC5314, with the yeast-locked strain hgc1Δ/Δ, its revertant hgc1Δ/Δ::hgc1, or with preformed hyphae prepared from strain SC5314. (D) TDKs were stimulated with C. albicans or left unstimulated (PBS). Amphotericin B was added after 8 hours of stimulation to prevent hyphal overgrowth. IL-1α levels were determined in the supernatant and in lysates prepared from the cells in the same wells. As a control, triton was added to separate wells containing cells and supernatant to quantify total amounts of IL-1α per well (total). Bar graphs show the group mean + SD. Data are representative of two independent experiments. Statistical analysis was performed using one-way ANOVA with Dunnett’s test (A–B) or Tukey’s test (C).
Fig 8
Fig 8. TDK-derived IL-1α induces G-CSF secretion by endothelial cells.
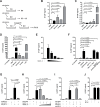
(A) Schematic overview of the experimental setup used in panels B–J. (B–J) G-CSF levels in the supernatants of TDKs (B) and MS1 cells (C–J) were determined by ELISA 24 hours after stimulation. TDKs (B) and MS1 cells (C) were stimulated with C. albicans, zymosan, curdlan, LPS or left unstimulated (PBS) as indicated. (D) MS1 cells were stimulated with the supernatants of stimulated TDKs from (A) (diluted 3-fold in MS1 culture medium). (E) MS1 cells were stimulated with the serially diluted supernatant of C. albicans-stimulated TDKs. (F) MS1 cells were stimulated with the TDK supernatants from Fig 7C. (G) MS1 cells were pretreated with anakinra as indicated prior to the addition of the supernatant of C. albicans-stimulated TDKs. (H—I) The supernatant of C. albicans-stimulated TDKs was treated with anti-IL-1α and/or anti-IL-1β as indicated before being transferred to MS1 cells. (J) MS1 cells were treated with recombinant IL-1α, IL-1β, or left untreated. The conditions of G-CSF induction shown in (F–I) were measured all in one experiment but are displayed in several individual graphs for better comprehension. Data (B–J) are all representative of at least two independent experiments. Bar graphs show the group mean + SD. Statistical analysis was performed using one-way ANOVA with Dunnett’s test.

References

    1. Romani L. Immunity to fungal infections. Nature reviews. Immunology. 2011; 11: 275–288. 10.1038/nri2939 - DOI - PubMed
    1. Brown GD, Denning DW, Gow NA, Levitz SM, Netea MG, White TC. Hidden killers. human fungal infections. Science translational medicine. 2012; 4: 165rv13 10.1126/scitranslmed.3004404 - DOI - PubMed
    1. Naglik JR, Moyes DL, Wachtler B, Hube B. Candida albicans interactions with epithelial cells and mucosal immunity. Microbes and infection / Institut Pasteur. 2011; 13: 963–976. 10.1016/j.micinf.2011.06.009 - DOI - PMC - PubMed
    1. Pappu R, Rutz S, Ouyang W. Regulation of epithelial immunity by IL-17 family cytokines. Trends in immunology. 2012; 33: 343–349. 10.1016/j.it.2012.02.008 - DOI - PubMed
    1. Sparber F, LeibundGut-Landmann S. Interleukin 17-Mediated Host Defense against Candida albicans. Pathogens. 2015; 4: 606–619. 10.3390/pathogens4030606 - DOI - PMC - PubMed

MeSH terms

Substances