Meta-Analysis
. 2016 Sep 16:6:33366.
doi: 10.1038/srep33366.

THBS2 is a Potential Prognostic Biomarker in Colorectal Cancer

Affiliations
Meta-Analysis

THBS2 is a Potential Prognostic Biomarker in Colorectal Cancer

Xue Wang et al. Sci Rep. .

Abstract

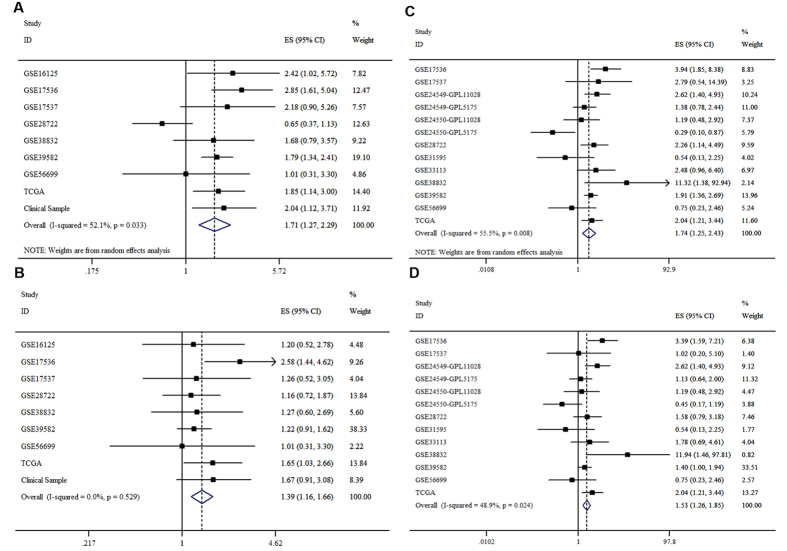
Colorectal cancer is one of the most common leading causes of death worldwide. Prognostic at an early stage is a useful way that decrease and avoid mortality. Although remarkable progress has been made to investigate the underlying mechanism, the understanding of the complicated carcinogenesis process was enormously hindered by large-scale tumor heterogeneity. Here we proposed that the prognosis-related gene THBS2, responsible for cooperativity disorientation, probably contain untapped prognostic resource of colorectal cancer. We originally established Spearman correlation transition, Kaplan-Meier survival analysis and meta-analysis that combine public dataset and clinical samples to quantify the prognostic value of THBS2. THBS2 could be considered as a novel prognostic marker in colorectal cancer.


Figures

Figure 1
Figure 1
(A) The expression of THBS in normal, tumor and tumor budding in CRC. (B) Hierarchical clustering of colorectal cancer samples. A green-red heat map was used to represent up- and down-regulated genes visualize the clustering results. (C) Protein-protein interaction (PPI) networks of differentially expressed genes (DEGs). (D) DEGs degree distribution. (E) The interaction of protein by string. (F) Pathway enrichment. (G) The correlation between THBS2 with EMT marker.
Figure 2
Figure 2. The correlation between THBS2 expression and prognosis overall survival/disease free survival were analyzed by Kaplan-Meier survival curve in GEO datasets.
TheTHBS2 level was evaluation by characteristic (ROC) curve. (A) GSE16125-OS; (B) GSE17536-OS; (C) GSE17536-RFS; (D) GSE17537-OS; (E) GSE17537-RFS; (F) GSE24549-GPL11028-DFS; (G) GSE24549-GPL5175-DFS; (H) GSE24550-GPL5175-DFS; (I) GSE24550-GPL11028-DFS; (J) GSE28722-OS; (K) GSE28722-MFS; (L)GSE29621-OS; (M) GSE31595-RFS; (N) GSE33113-RFS; (O) GSE38832-OS; (P) GSE38832-DFS; (Q) GSE39582-OS; (R) GSE39582-RFS; (S) GSE56699-OS; (T) GSE56699-DFS; (U) TCGA-OS; (V) TCGA-RFS.
Figure 3
Figure 3. THBS2 was significant correlation with clinicopathology parameters in GEO datasets.
(A) Krustal-Wallis Test confirmed that the THBS2 was correlation with TNM stage and differentiation. GSE17536, TNM stage, p = 0.002; (B) GSE29621, differentiation, p = 0.019; (C) GSE29621, T stage, p = 0.019; (D) GSE31595, differentiation, p = 0.021; (E) GSE39582, TNM stage, p = 0.030; (F) GSE29621, TNM stage, p = 0.026 (G) TCGA, TNM stage, p = 0.015; (H) GSE41328 showed that THBS2 was higher expression in tumor tissue when compared with paired adjacent normal tissue (p < 0.001); (I) TCGA showed that THBS2 was higher expression in tumor tissue when compared with paired adjacent normal tissue (p < 0.001); (J) GSE32323 showed that THBS2 was higher expression in tumor tissue when compared with paired adjacent normal tissue (p = 0.05); (K) GSE31737 showed that THBS2 was higher expression in tumor tissue when compared with paired adjacent normal tissue (p < 0.001).
Figure 4
Figure 4. Expression of THBS2 in clinical colorectal tissues.
(A) THBS2 mRNA expression in colorectal cancer tissues and paired adjacent normal tissues examined by qRT-PCR and normalized to GAPDH. (B) THBS2 high-expression predicts a poor prognosis for CRC patients by Kaplan-Meier survival curve. (C) Overall survival of THBS2 mRNA expression in TNM stage I/II. (D) Overall survival of THBS2 mRNA expression in TNM stage III/IV. (E) Representative images of THBS2 IHC of biopsies from human patients with CRC. Staining patterns were categorized into four grades (G0–G3). Scale bars, 600 um. (F) THBS2 protein expression in colorectal cancer tissues and paired normal mucosa examined by IHC. (G) THBS2 protein expression in distant, adjacent stroma and tumor epithelium. (H) Overall survival curves of G0-1, G1 versus G3 groups. (I) Overall survival curves of G0–G1 versus G2-3 groups. (J) Overall survival curves of G0-1, G1 versus G3 in TNM stage I/II. (K) Overall survival curves of G0-1 versus G2-3 in TNM stage III/IV. (L) Overall survival curves of G0-1 versus G2-3 in TNM stageI/II. (M) Overall survival curves of G0-1 versus G2-3 in TNM stage III/IV.
Figure 5
Figure 5. Forest plot of the association between THBS2 and CRC survival.
Meta-analysis of THBS2 in seven independent datasets was conducted, and HR, 95% CI of each gene and corresponding p value were calculated and plotted in the forest plot. (A) Forest plot of the association between THBS2 filtered by ROC with a random-effect model in datasets containing OS information. (B) Forest plot of the association between THBS2 filtered by p50 with a fixed-effect model in datasets containing OS information. (C) Forest plot of the association between THBS2 filtered by ROC with a random-effect model in datasets containing DFS information. (D) Forest plot of the association between THBS2 filtered by p50 with a random-effect model in datasets containing DFS information.
Figure 6
Figure 6. THBS2 promotes proliferation and metastasis in HCT116 cell.
(A) The expression of THBS2 in colorectal cancer cell lines. (B) Detection of THBS2 in HCT116 cell with THBS2 knockdown by qRT-PCR. (C) Cell proliferation for HCT116 with THBS2 knockdown. (D) Migration and invasion assay for HCT116 with THBS2 knockdown. (E) Cell cycle with THBS2 knockdown.

References

    1. Jemal A. et al.. Global cancer statistics. CA: a cancer journal for clinicians 61, 69–90, doi: 10.3322/caac.20107 (2011). - DOI - PubMed
    1. Woolf S. H. The best screening test for colorectal cancer–a personal choice. The New England journal of medicine 343, 1641–1643, doi: 10.1056/NEJM200011303432211 (2000). - DOI - PubMed
    1. Jemal A. et al.. Cancer statistics, 2009. CA: a cancer journal for clinicians 59, 225–249, doi: 10.3322/caac.20006 (2009). - DOI - PubMed
    1. Barrett T. et al.. NCBI GEO: archive for functional genomics data sets–update. Nucleic acids research 41, D991–D995, doi: 10.1093/nar/gks1193 (2013). - DOI - PMC - PubMed
    1. Smith J. J. et al.. Experimentally derived metastasis gene expression profile predicts recurrence and death in patients with colon cancer. Gastroenterology 138, 958–968, doi: 10.1053/j.gastro.2009.11.005 (2010). - DOI - PMC - PubMed

Publication types

MeSH terms