

Transcription factor ANAC032 modulates JA/SA signalling in response to Pseudomonas syringae infection
- PMID: 27632992
- PMCID: PMC5090710
- DOI: 10.15252/embr.201642197
Transcription factor ANAC032 modulates JA/SA signalling in response to Pseudomonas syringae infection
Abstract
Responses to pathogens, including host transcriptional reprogramming, require partially antagonistic signalling pathways dependent on the phytohormones salicylic (SA) and jasmonic (JA) acids. However, upstream factors modulating the interplay of these pathways are not well characterized. Here, we identify the transcription factor ANAC032 from Arabidopsis thaliana as one such regulator in response to the bacterial pathogen Pseudomonas syringae pv. tomato DC3000 (Pst). ANAC032 directly represses MYC2 activation upon Pst attack, resulting in blockage of coronatine-mediated stomatal reopening which restricts entry of bacteria into plant tissue. Furthermore, ANAC032 activates SA signalling by repressing NIMIN1, a key negative regulator of SA-dependent defence. Finally, ANAC032 reduces expression of JA-responsive genes, including PDF1.2A Thus, ANAC032 enhances resistance to Pst by generating an orchestrated transcriptional output towards key SA- and JA-signalling genes coordinated through direct binding of ANAC032 to the MYC2, NIMIN1 and PDF1.2A promoters.
Keywords: Arabidopsis; jasmonic acid; pathogens; salicylic acid; transcription factor.
© 2016 The Authors.
Figures
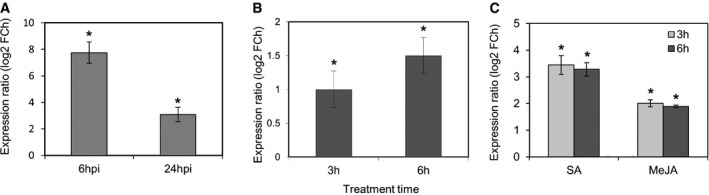
- A
ANAC032 expression in WT plants sprayed with Pst DC3000, 6 and 24 hpi, compared to control (sprayed with 10 mM MgCl2 (mock)). Bars represent means ± SD (n = 3 independently performed experiments, each including the rosette leaves of at least three plants grown in individual pots).
- B, C
ANAC032 expression in WT treated with (B) SA or MeJA or (C) COR for 3 and 6 h compared to non‐treated controls. Means ± SD are given (n = 3 independently performed experiments, each including at least 20 seedlings).
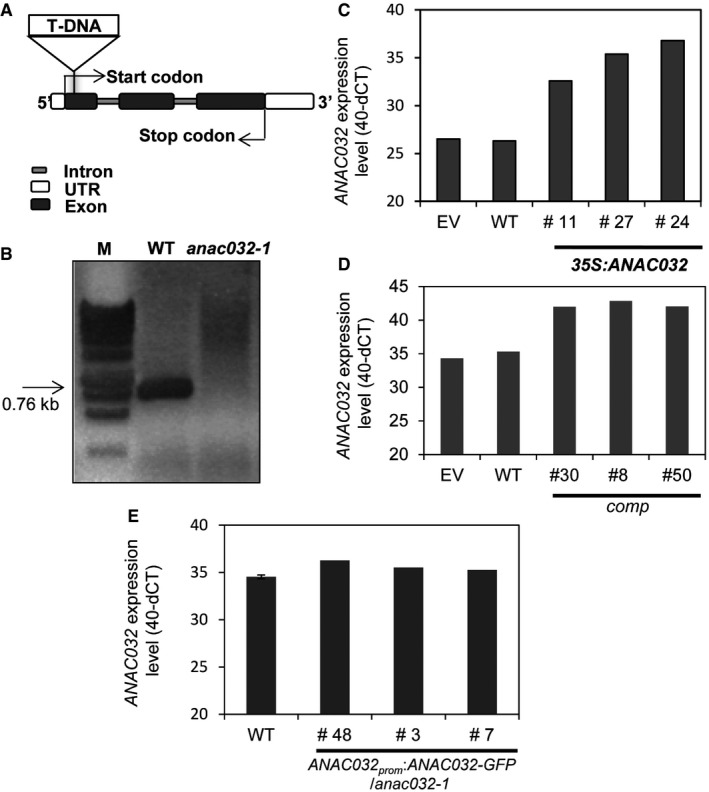
Schematic representation of the ANAC032 gene showing the position of the T‐DNA insertion in the anac032‐1 mutant.
Analysis of anac032‐1 and wild‐type (WT) plants for the presence of full‐length ANAC032 transcript using end point PCR. M, DNA size marker.
Different 35S:ANAC032 plant lines (individual T0 plants) showing increased expression of ANAC032 compared to empty‐vector (EV) and wild‐type (WT) plants. Expression was analysed by qRT–PCR. Numbers on the y‐axis indicate 40 − ΔC T.
Different complemented (35S:ANAC032 in anac032‐1) plant lines (individual T0 plants) showing increased expression of ANAC032 compared to empty‐vector (EV) and wild‐type (WT) plants. Expression was analysed by qRT–PCR. Numbers on the y‐axis indicate 40 − ΔC T.
Different ANAC032prom‐ANAC032‐GFP plant lines (individual T0 plants) showing increased expression of ANAC032 compared to wild‐type (WT) upon treatment with Pst for 6 h. Expression was analysed by qRT–PCR. Numbers on the y‐axis indicate 40 − ΔC T.
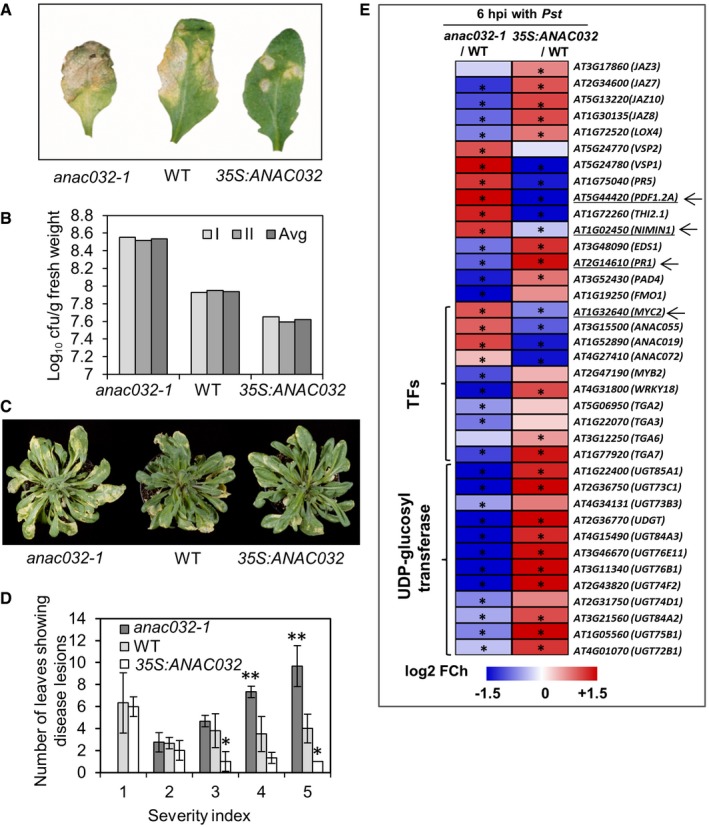
Plants after pressure infiltration with Pst DC3000, at 4 dpi. The experiment was repeated three times (each time 9–12 plants) with similar results.
Pst DC3000 growth in ANAC032 transgenics and WT plants 3 dpi after pressure infiltration. Two independent experiments were performed with three replications per experiment, each replicate consisting of three plants grown in individual pots (six measurements in total). The graph shows data points of the two individual experiments (I and II) along with their mean (Avg).
Disease status of plants sprayed with Pst DC3000, 5 dpi. The experiment was repeated four times with similar results.
Disease severity index (1, small chlorotic lesions; 5, large lesions) scored 5 dpi after spraying with Pst DC3000. Data are from three independent experiments with at least six plants per genotype in each. Means ± SD are shown. Asterisks indicate significant (*P < 0.05 and **P < 0.005) differences between transgenic and WT plants in chi‐square test analysis.
Heat map showing the fold change (log2 basis) in the expression ratio of defence‐/stress‐related differentially expressed genes in anac032‐1 and 35S:ANAC032 compared to WT after spraying with Pst DC3000 (6 hpi) normalized to their respective controls. Blue, downregulated; red, upregulated. Data represent means of three independent experiments, each including the rosettes leaves of at least three plants grown in individual pots. Asterisks indicate significant differences from WT plants (Student's t‐test, P ≤ 0.05).
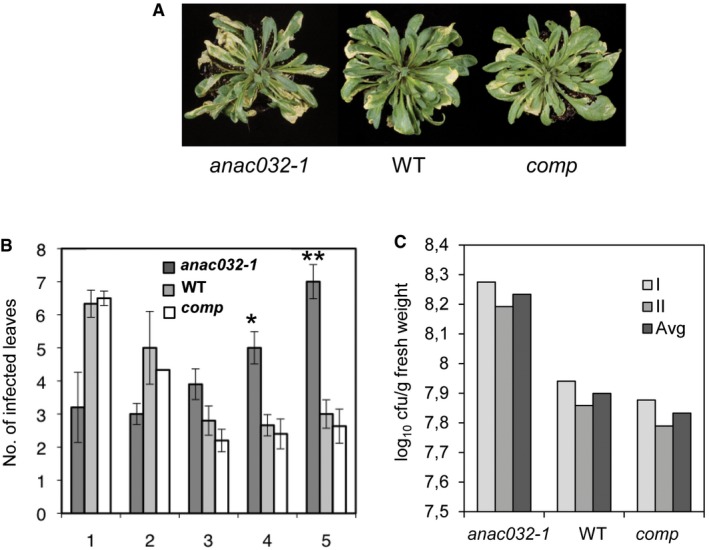
Disease symptoms of plants sprayed with Pst DC3000, 5 dpi. The experiment was repeated four times with similar results.
Disease severity index (1, small chlorotic lesions; 5, large lesions) scored 5 dpi after spraying with Pst DC3000. Data are from three independent experiments with at least six plants per genotype in each. Means ± SD are shown. Asterisks indicate significant (*P < 0.05 and **P < 0.005) differences between transgenic and WT plants in chi‐square test analysis.
Bacterial growth in ANAC032 transgenic and WT plants 3 dpi after pressure infiltration. Two independent experiments were performed with three replications per experiment, each replicate consisting of three plants grown in individual pots. The graph shows data points of the two individual experiments (I and II) along with their mean (Avg). “Comp” indicates the anac032‐1 mutant transformed with the 35S:ANAC032 construct.
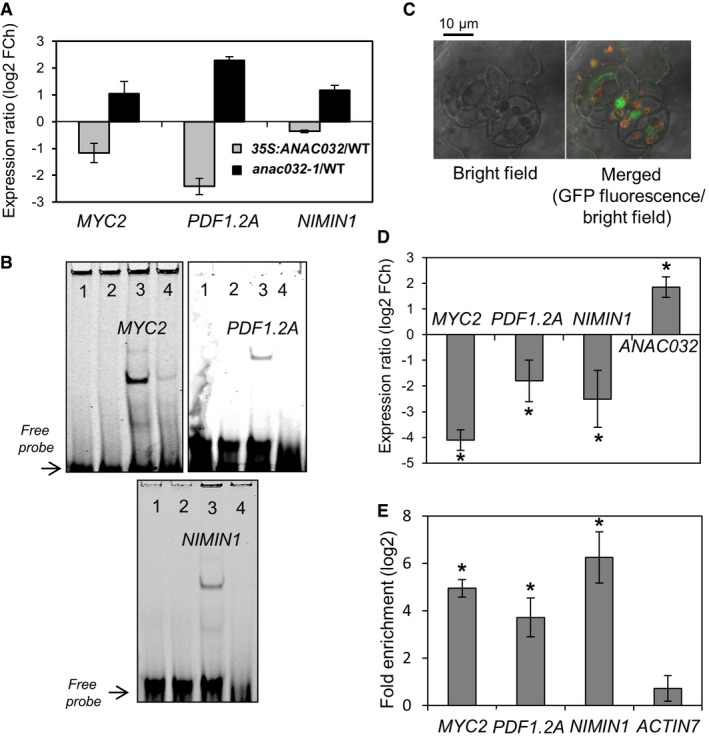
MYC2, PDF1.2A and NIMIN1 expressions in ANAC032 transgenics compared to WT after spraying with Pst DC3000 (24 hpi) normalized to their respective controls. FCh, fold change. Means ± SD (n = 3 independently performed experiments, each including the rosette leaves of at least three plants grown in individual pots).
EMSA showing binding of ANAC032 to MYC2, PDF1.2A and NIMIN1 promoter regions (in 5′‐DY682‐labelled double‐stranded oligonucleotides) harbouring ANAC032 binding sites. 1, labelled probe only; 2, labelled probe plus GST protein; 3, labelled probe plus ANAC032‐GST protein; 4, labelled probe, ANAC032‐GST protein and 100× competitor (unlabelled oligonucleotide containing ANAC032 binding site).
Confocal microscope image showing nuclear localization of ANAC032‐GFP fusion protein expressed from the ANAC032 promoter in ANAC032 prom :ANAC032‐GFP/anac032‐1 seedlings treated with Pst at 6 hpi. Left, bright field; right, chlorophyll auto‐fluorescence (red) and GFP fluorescence (green) under bright field.
Expression of MYC2, PDF1.2A, NIMIN1 and ANAC032 in 5‐week‐old ANAC032 prom :ANAC032‐GFP/anac032‐1 plants compared to WT at 6 hpi with Pst, normalized to their respective controls. FCh, fold change. Means ± SD (n = 3 independently performed experiments, each including the rosette leaves of at least three plants grown in individual pots). Asterisks indicate a significant difference from WT, normalized to their respective controls (*P < 0.05; Student's t‐test).
ChIP‐qPCR shows enrichment of MYC2, PDF1.2A and NIMIN1 promoter regions containing ANAC032 binding site compared to a promoter region lacking the ANAC032 binding site (AT5G09810; ACTIN7). Means ± SD (n = 3 independently performed experiments, each including the rosette leaves of at least three plants grown in individual pots). Asterisks indicate a significant difference from negative control (*P < 0.01; Student's t‐test).
- A, B
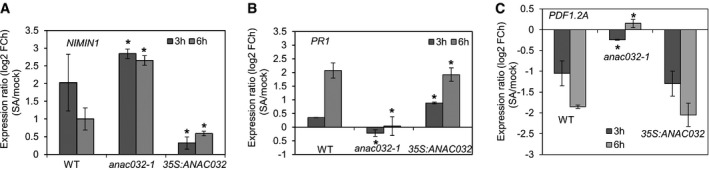
Transcript levels of (A) NIMIN1 and (B) PR1 in WT, anac032‐1 and 35S:ANAC032 plants after 3 and 6 h of treatment with SA compared to their respective controls.
- C
Expression of PDF1.2A in WT and anac032‐1 plants after 3 and 6 h of treatment with SA compared to their respective controls.
- A, B
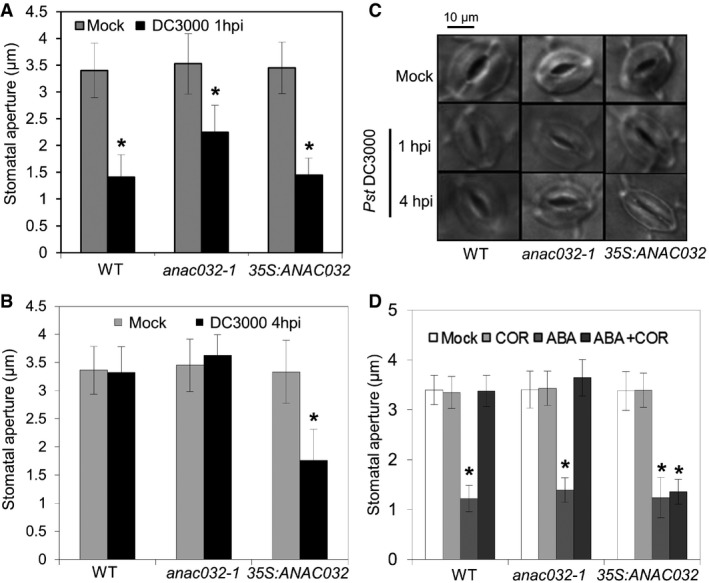
Stomatal aperture 1 h (A) or 4 h (B) after spraying with Pst DC3000 or mock treatment.
- C
Microscope images of stomata at 1 and 4 hpi with Pst DC3000 (mock at 4 h).
- D
Stomatal aperture 1 h after treatment with COR, ABA or COR plus ABA, compared to mock.
- A, B
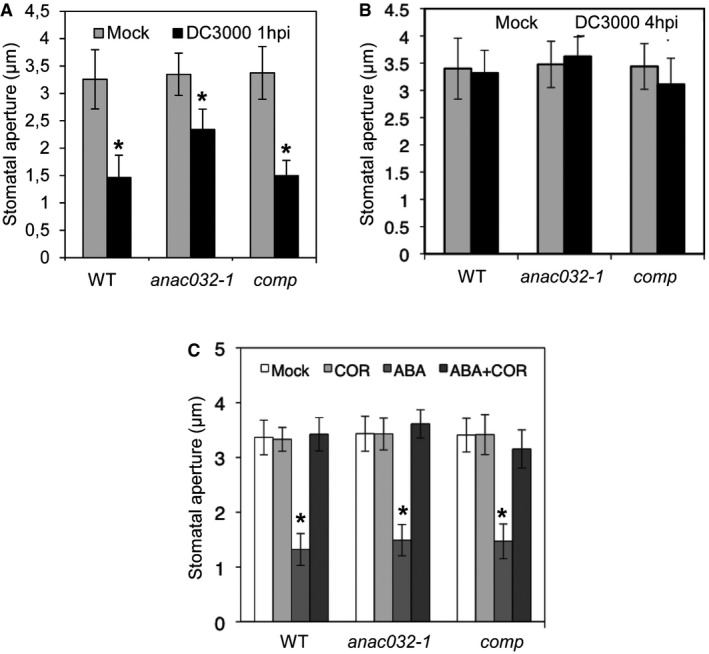
Stomatal aperture 1 h (A) or 4 h (B) after spraying with Pst DC3000 or mock treatment.
- C
Stomatal aperture 1 h after treatment with COR, ABA, or COR plus ABA, compared to mock.
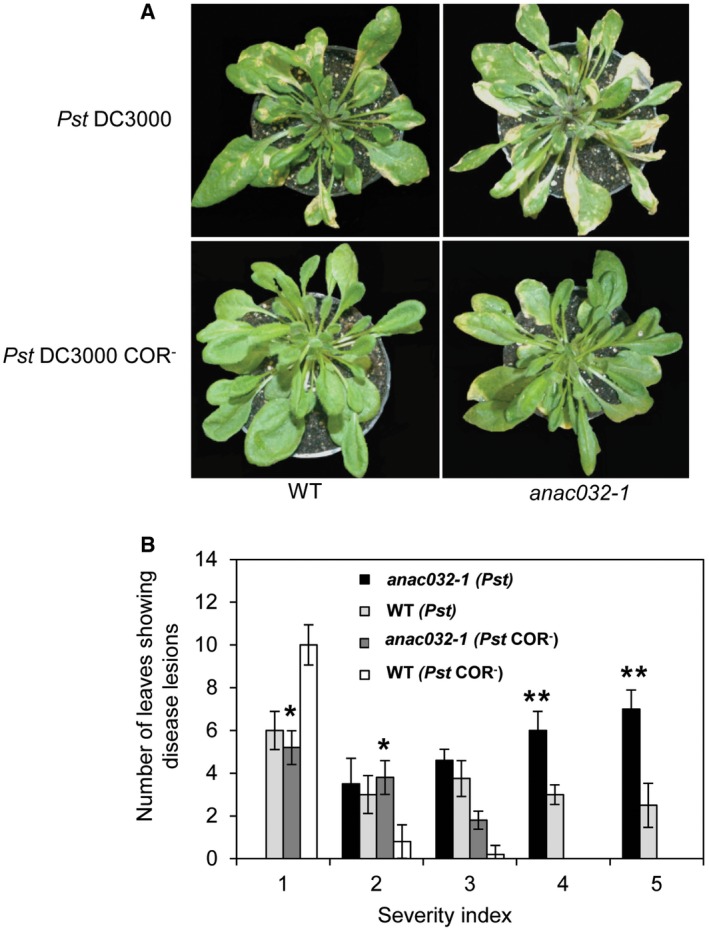
Disease symptoms of WT and anac032‐1 plants surface inoculated with either Pst DC3000 or DC3000 COR− at 5 dpi.
Disease severity index (1, small chlorotic lesions; 5, large lesions) scored 5 dpi after spraying with Pst DC3000 or DC3000 COR−. The experiment was repeated three times (n = 3) with similar results. Asterisks indicate significant (*P < 0.05 and **P < 0.005) differences between transgenic and respective controls (WT plants) in chi‐square test analysis.

References
-
- Pieterse CMJ, van der Does D, Zamioudis C, Leon‐Reyes A, van Wees SCM (2012) Hormonal modulation of plant immunity. Ann Rev Cell Dev Biol 28: 489–521 - PubMed
-
- Glazebrook J (2005) Contrasting mechanisms of defence against biotrophic and necrotrophic pathogens. Ann Rev Phytopathol 43: 205–227 - PubMed
-
- Mittal S, Davis KR (1995) Role of the phytotoxin coronatine in the infection of Arabidopsis thaliana by Pseudomonas syringae pv. tomato . Mol Plant Microbe Interact 8: 165–171 - PubMed
-
- Weingart H, Ullrich H, Geider K, Volksch B (2001) The role of ethylene production in virulence of Pseudomonas syringae pv. glycinea and phaseolicola . Phytopathology 91: 511–518 - PubMed
MeSH terms
Substances
LinkOut - more resources
Full Text Sources
Other Literature Sources
Molecular Biology Databases
