. 2016 Sep 1;30(17):2005-17.
doi: 10.1101/gad.287094.116. Epub 2016 Sep 15.

Temperature regulates splicing efficiency of the cold-inducible RNA-binding protein gene Cirbp

Affiliations

Temperature regulates splicing efficiency of the cold-inducible RNA-binding protein gene Cirbp

Ivana Gotic et al. Genes Dev. .

Abstract

In mammals, body temperature fluctuates diurnally around a mean value of 36°C-37°C. Despite the small differences between minimal and maximal values, body temperature rhythms can drive robust cycles in gene expression in cultured cells and, likely, animals. Here we studied the mechanisms responsible for the temperature-dependent expression of cold-inducible RNA-binding protein (CIRBP). In NIH3T3 fibroblasts exposed to simulated mouse body temperature cycles, Cirbp mRNA oscillates about threefold in abundance, as it does in mouse livers. This daily mRNA accumulation cycle is directly controlled by temperature oscillations and does not depend on the cells' circadian clocks. Here we show that the temperature-dependent accumulation of Cirbp mRNA is controlled primarily by the regulation of splicing efficiency, defined as the fraction of Cirbp pre-mRNA processed into mature mRNA. As revealed by genome-wide "approach to steady-state" kinetics, this post-transcriptional mechanism is widespread in the temperature-dependent control of gene expression.

Keywords: Cirbp; circadian rhythms; splicing efficiency; temperature.


Figures

Figure 1.
Figure 1.
Mild cold exposure increases the expression of a single Cirbp mRNA isoform without affecting its pre-mRNA levels in NIH3T3 cells. (A) Schematic representation of the RPA. A gene-specific radioactive RNA probe protects the intron–exon border of the unspliced transcripts and the remaining exon region of the spliced mRNA from RNaseA/T1-mediated degradation. The protected RNA fragments were size-fractionated on 12% urea–polyacrylamide sequencing gels and quantified by phosphorimaging. (B) RPA with a probe mix protecting the Cirbp intron 6–exon 7 border (50 base pairs [bp] of intron 6 and 200 bp of exon 7) and the first 60 bp of Ppib exon 6 in RNA samples from cells incubated for various time periods at 37°C and 32°C. (P) Probe; (ytRNA) yeast tRNA. (C). Quantification of Cirbp mRNA and pre-mRNA levels by RPA (B), represented as fold changes at the indicated time intervals after shifting the cells from 37°C to 32°C. The Cirbp transcript signals were normalized to Ppib transcript signals (see B). The data (average value ± standard deviations [SDs]) from three biological replicates are given. (D) Northern blot assay for Cirbp transcripts. The radioactive RNA probe was complementary to the full-length Cirbp mRNA. RNA was isolated from either total cell extracts (T), purified nuclei (N), or cytoplasm (C). (M) RNA size markers.
Figure 2.
Figure 2.
Temperature-dependent Cirbp mRNA accumulation is regulated by a post-transcriptional mechanism. (A) POLR2B ChIP in cells incubated for 6 h at 33°C or 38°C. (B) IgG control ChIP. The Cirbp gene structure and the qPCR-amplified regions are depicted below the graphs. Data are presented as percentage of input DNA. n = 3–5 biological replicates. The bars represent SDs. (C) Cytomegalovirus (CMV)-gCirp-LMLucR reporter assay in cells exposed to simulated CBT cycles of 35.5°C–38.5°C for 6 d. Reporter construct schemes are depicted at the right, with Cirbp untranslated region (UTR)-encoding exons illustrated in white and protein-encoding exons shown in light gray. A representative recording of >10 experiments is shown. Data were normalized to the baseline curve explained in Supplemental Figure S2B.
Figure 3.
Figure 3.
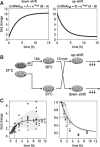
mRNA stability cannot account for temperature-dependent Cirbp mRNA accumulation. (A) Mathematical model for mRNA accumulation of ATSS experiments after a rapid temperature shift, assuming temperature-independent synthesis of mature mRNA (transcription rate and splicing efficiency). The half-life of transcripts (T1/2) at a particular temperature is equal to the time needed to reach half of the new steady-state mRNA levels. (A,B) Steady-state mRNA concentrations at 33°C and 38°C, respectively. k = ln2/T1/2. (B) Schematic representation of the ATSS experiment. The cells were seeded and kept for 4 h at 37°C before the switch to 33°C or 38°C. After 16 h of incubation, the temperature was shifted within 10 min to 38°C or 33°C, respectively, and samples were taken at the indicated time points after the shift. (C) qPCR analysis of Cirbp mRNA expression after temperature downshift (left panel) and upshift (right panel). n = 4–11 time course series. Data were normalized to endogenous Ppib levels, which remain constant irrespective of temperature. Symbols represent fold changes between a particular time point and the t0 time point of each series. Data were fitted to the equations from A. Shaded areas surrounding the fit represent one SD.
Figure 4.
Figure 4.
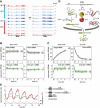
ATSS kinetics based on RNA-seq data. (A) University of California at Santa Cruz genome browser tracks of sequence reads (normalized read density) for Cirbp and Midn, a temperature-unresponsive gene located 9 kb upstream of Cirbp on chromosome 10. Pooled data from two replicate series (represented by formula image and × symbols in downshift and * and × symbols in upshift experiments in Fig. 3C) are shown for each temperature shift. Gene structures are depicted below the tracks. (B,C) Quantification of Midn and Cirbp mRNA and pre-mRNA expression for the two biological replicate series/temperature shift. Black circles and green triangles represent the RNA read counts (expressed in RPKM [reads per kilobase per million mapped reads]) for mRNA and pre-mRNA, respectively. Data points indicated by the infinity symbol on the X-axis correspond to the expression at t0 from the opposite temperature shift and are thus assumed to reflect the opposite steady state. Solid black and green lines represent the model predictions for mRNA and pre-mRNA accumulation. The shaded areas indicate SDs (details are in the Supplemental Material). (D) Schematic representation of the model for temperature-mediated Cirbp regulation. The modeled processes include Cirbp pre-mRNA synthesis (ks), pre-mRNA degradation (kp), pre-mRNA splicing (ρ), and mRNA degradation (km) rates. In addition, the parameter α reflects the percentage of splicing-prone Cirbp pre-mRNA. The result of the fit indicates similar ks, kp, and ρ at 33°C and 38°C, while the km is threefold lower (90 vs. 270 min) at 33°C. Inversely, the splicing efficiency (SpE) appears to be 5.7 times higher (48% vs. 8.5%) at 33°C. The α, represented by the size of the green pie chart slices, increases from 18% at 38°C to 69% at 33°C. Together, this generates an 18-fold change in Cirbp mRNA and a 1.5-fold change in pre-mRNA levels at 33°C versus 38°C (Supplemental Table S1–S3). (E) CMV-Cirbp-cDNA-LMLucR reporter assay in transiently transfected cells exposed to simulated CBT cycles. Representative recordings of n ≥ 3 experiments. The baselines were subtracted in the depicted curves as in Figure 2. Note that the CMV-gCirbp-LMLucR and CMV-LMLucR reporter tracks in this figure and in Figure 2 look highly similar, manifesting the high reproducibility of the experimental system. Reporter construct schemes are depicted at the right, with Cirbp UTRs presented in white and protein-coding exons in light gray.
Figure 5.
Figure 5.
Efficient Cirbp pre-mRNA splicing is required for cold-induced Cirbp mRNA up-regulation. (A) qPCR analysis of Cirbp mRNA expression in control and SSA-treated samples after temperature upshifts and downshifts. After an incubation period of 16 h at 33°C or 38°C, the drug was added, and the cells were shifted to the opposite temperatures for increasing time intervals. (B, left panel) Schematic representation of the experiment. Cells were incubated at 37°C, and SSA or PBS was added immediately before the temperature shift to 33°C or 38°C. Samples were collected after 6 h of incubation and analyzed by qPCR. (Right panel) qPCR analysis of Cirbp expression after the addition of 20 ng/mL SSA. n = 3 independent experiments. Data were normalized to endogenous Ppib levels and are presented as fold changes between a particular sample and the 38°C PBS sample of a series. (C) qPCR analysis of Cirbp pre-mRNA expression in control and SSA-treated samples after temperature downshift (left panels) and upshift (right panels). (D) qPCR analysis of Cirbp and Lgals1 transcripts in antisense phosphorodiamidate morpholino oligomer (AMO)-treated (Cirbp/Lgals1 AMO mix) and control (standard control oligo) samples 16 h after transfection/temperature shift. n = 2 series of three biological replicates. Data were normalized to endogenous Ppib levels and are presented as fold changes between a particular sample and a control 38°C sample of the same series. (*) P < 0.05, t-test assuming unequal variances. (A,C) n = 3 independent series. Data were normalized to endogenous Ppib levels and are presented as fold changes between a particular time point and the 0 time point of each series. The bars represent SDs.
Figure 6.
Figure 6.
A cis-acting element in Cirbp intron 1 contributes to temperature-mediated Cirbp expression. (A) Schematic representation of Cirbp-luciferase reporter constructs with (+) or without (−) temperature-dependent expression. White bars illustrate UTR regions. Bioluminescence tracks of gCirbp-LMLucR (1) and Cirbp5′UTR-Int1DelB-LMLucR (4) constructs (B), Coasy5′UTR-LMLucR (9) and Coasy5′UTR-CirbpInt1DelB-LMLucR (6) constructs (C), and Coasy5′UTR-Cirbp(Int1DelB-Int6)-LMLucR (6, 10–14) constructs (D). The recordings of the control LMLucR reporter shown in B and C and the tracks of construct 6 in C and D were part of the same experiment. n ≥ 3 replicates for each track. Data were normalized to baseline curves.
Figure 7.
Figure 7.
Genome-wide transcript analysis reveals a predominant role of splicing efficiency and mRNA stability in the temperature-dependent accumulation of mRNAs. (A) Heat maps of 63 cold-inducible (left panel) and 138 heat-inducible (right panel) genes detected in ATSS RNA-seq analysis after temperature downshifts and upshifts. Color indicates log2 fold changes (FC) with respect to the maximum mRNA expression for each gene over all time points. Genes are ordered according to their maximum fold changes. Black bars mark genes with transient temperature responses, as opposed to genes whose transcripts reach a new steady state after the temperature shift (gray) (details are in the Supplemental Material). (B) Polar plot showing phases and fold changes of expression (calculated by the peak to trough) for cold-inducible (blue circles) and heat-inducible (red circles) genes that exhibited circadian expression patterns in mouse livers. P < 0.05, harmonic regression; data retrieved from Atger et al. (2015). The red–blue gradient circle represents mouse CBT values around the clock, with red and blue symbolizing high and low temperatures, respectively. (C) Temporal abundance profiles for mRNAs and pre-mRNAs for 32 cold-inducible and 99 heat-inducible intron-containing genes from A that reached a new steady state. Fold changes for mRNAs and pre-mRNAs were calculated with respect to the maximum expression levels of mRNAs and pre-mRNAs. (D) The charts depict the fraction of genes in the cold-inducible (blue) and heat-inducible (red) groups showing evidence of temperature dependence for any of the parameters (probability >0.5) (Supplemental Material). (E) Cumulative distribution of mRNA accumulation in cells in which Cirbp expression was depleted by siRNA knockdown (KD). The X-axis indicates log2 fold changes between Cirbp knockdown and wild type (Morf et al. 2012). The gray line corresponds to all genes. Cirbp depletion affects cold-inducible (blue) and heat-inducible (red) genes differently. P = 0.0034, Mann-Whitney-Wilcoxon test. Upon Cirbp knockdown, heat-inducible genes show a reduction in their mRNA accumulation, whereas cold-inducible genes remain unaffected. P = 4.5 × 10⁻⁷ and P = 0.78, respectively, t-test.

Comment in

References

    1. Abbink TE, Berkhout B. 2008. RNA structure modulates splicing efficiency at the human immunodeficiency virus type 1 major splice donor. J Virol 82: 3090–3098. - PMC - PubMed
    1. Adjibade P, Mazroui R. 2014. Control of mRNA turnover: implication of cytoplasmic RNA granules. Semin Cell Dev Biol 34: 15–23. - PubMed
    1. Al-Fageeh MB, Smales CM. 2009. Cold-inducible RNA binding protein (CIRP) expression is modulated by alternative mRNAs. RNA 15: 1164–1176. - PMC - PubMed
    1. Atger F, Gobet C, Marquis J, Martin E, Wang J, Weger B, Lefebvre G, Descombes P, Naef F, Gachon F. 2015. Circadian and feeding rhythms differentially affect rhythmic mRNA transcription and translation in mouse liver. Proc Natl Acad Sci 112: E6579–E6588. - PMC - PubMed
    1. Bensaude O. 2011. Inhibiting eukaryotic transcription: which compound to choose? How to evaluate its activity? Transcription 2: 103–108. - PMC - PubMed

Publication types