. 2016 Sep 16:6:33647.
doi: 10.1038/srep33647.

Autophagy-related proteins are functionally active in human spermatozoa and may be involved in the regulation of cell survival and motility

Affiliations

Autophagy-related proteins are functionally active in human spermatozoa and may be involved in the regulation of cell survival and motility

I M Aparicio et al. Sci Rep. .

Abstract

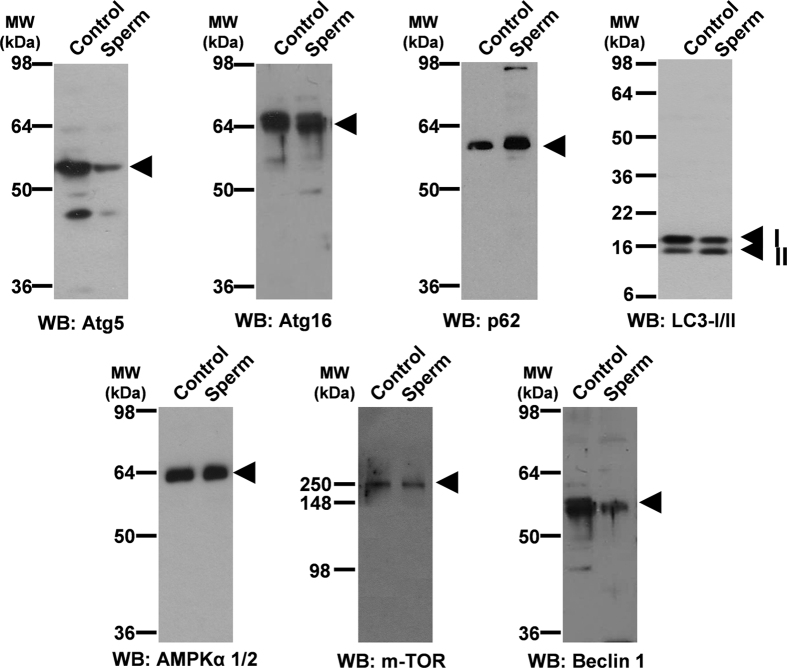
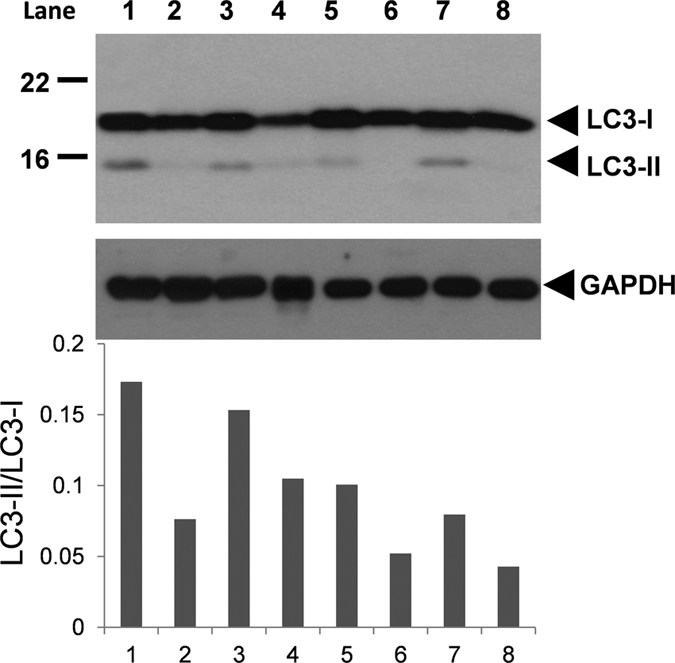
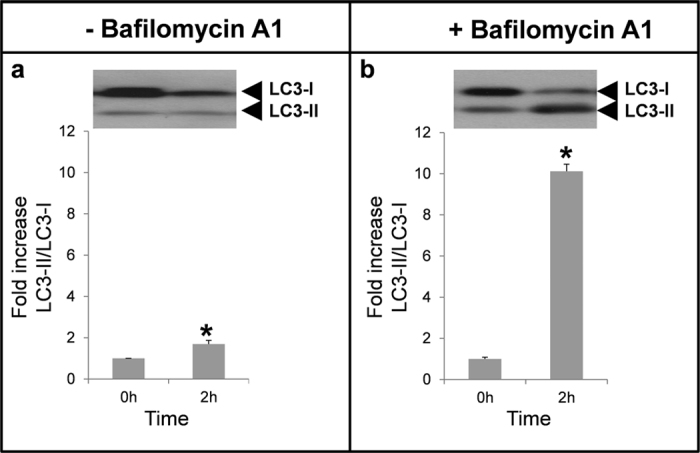
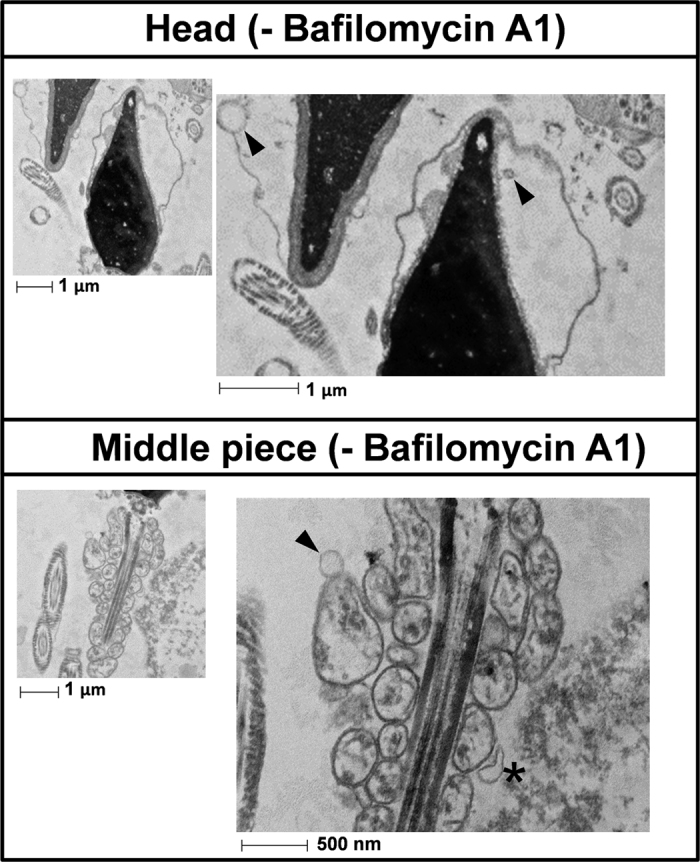
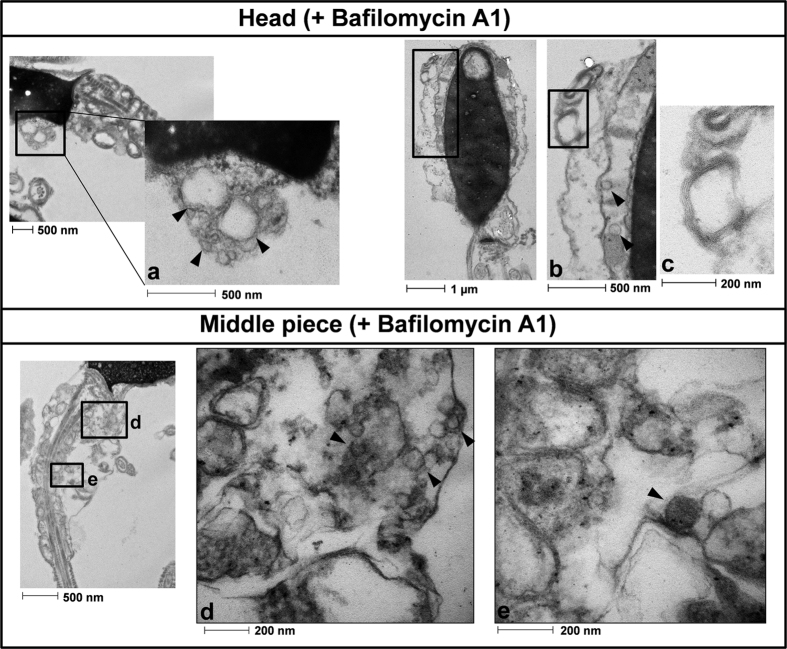
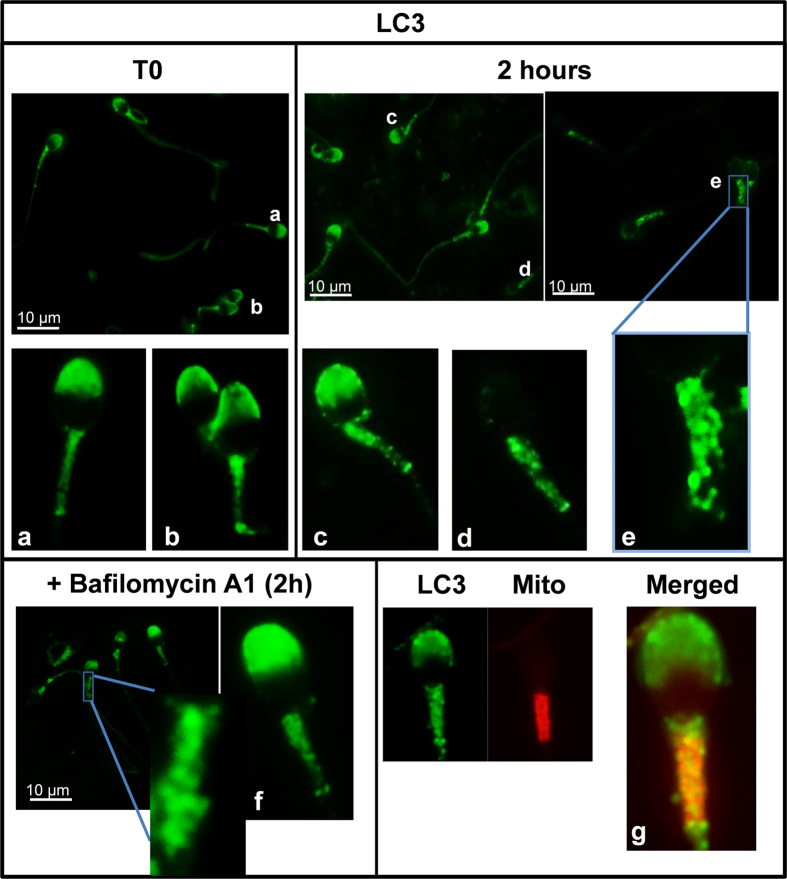
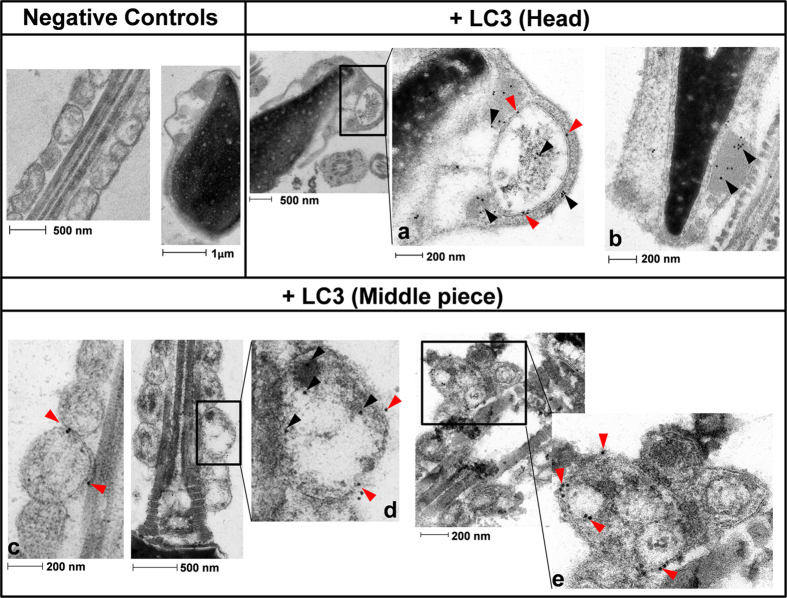
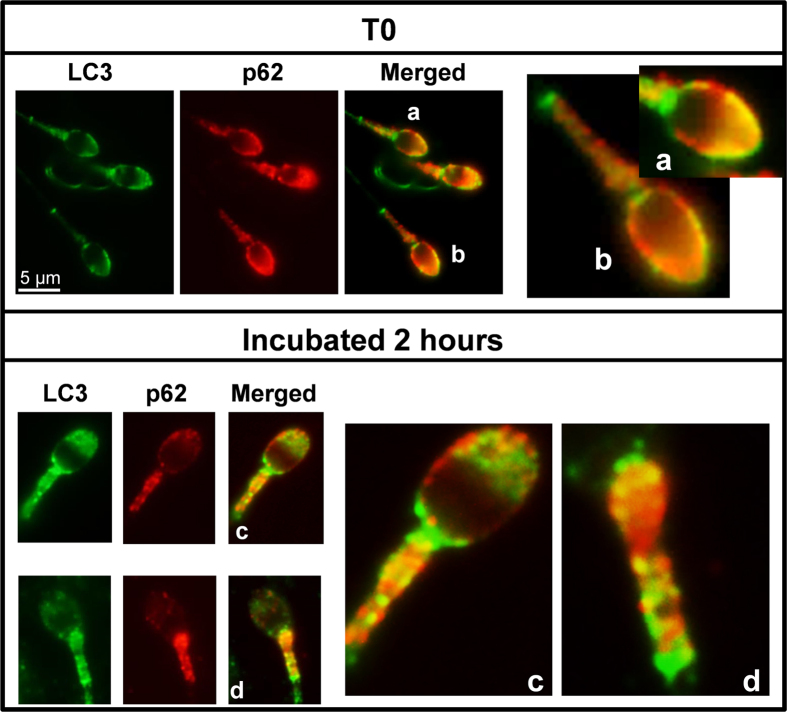
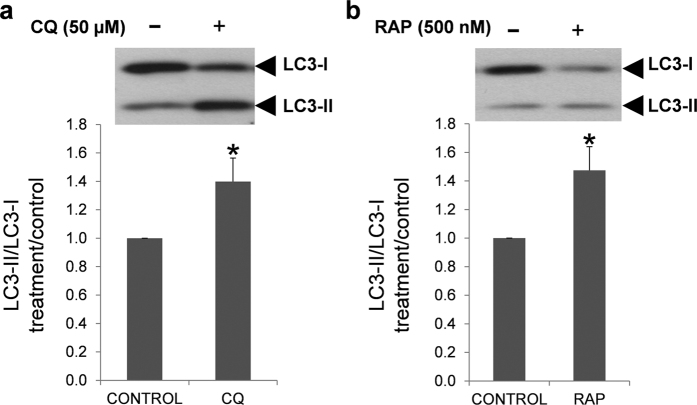
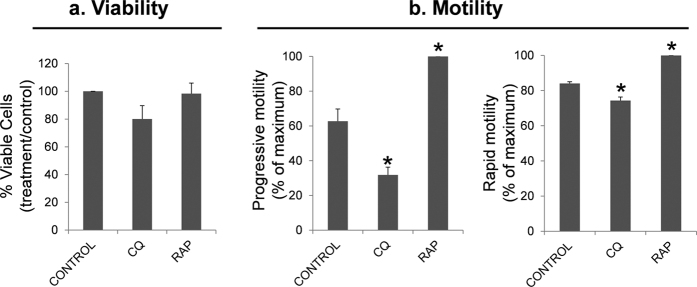
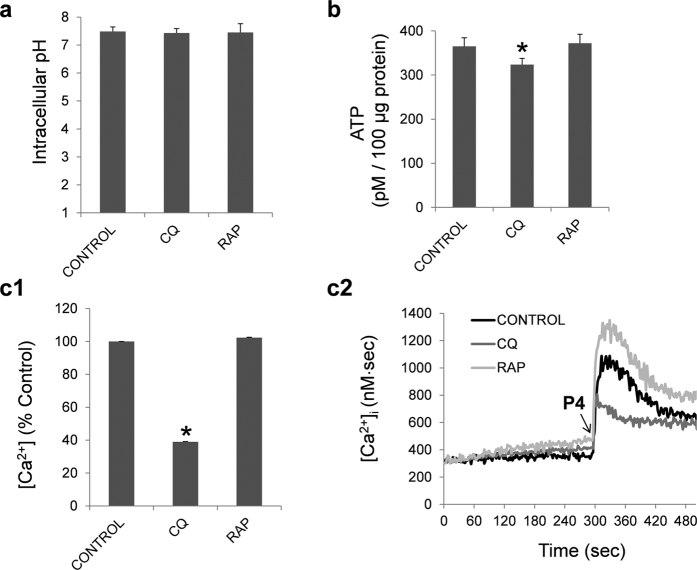
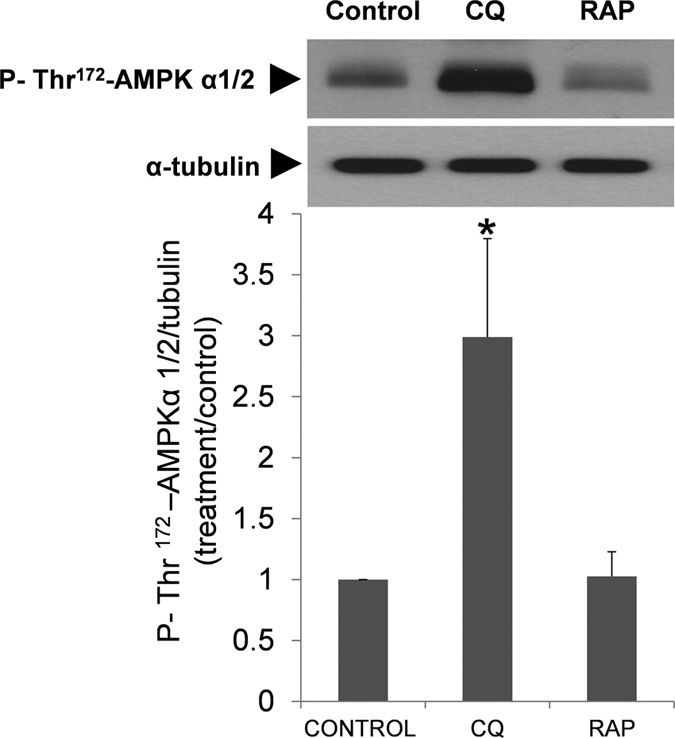
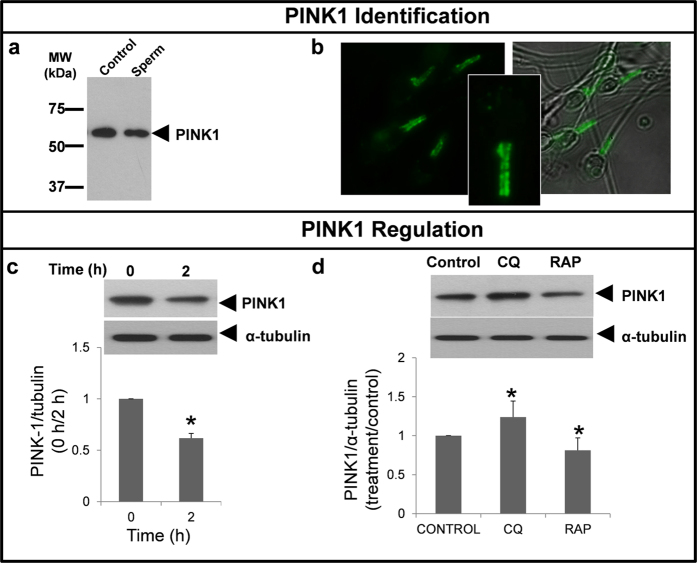
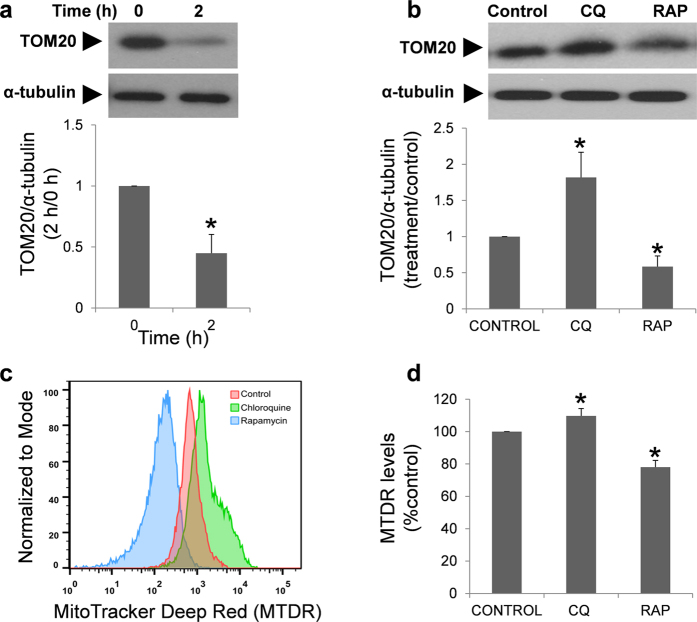
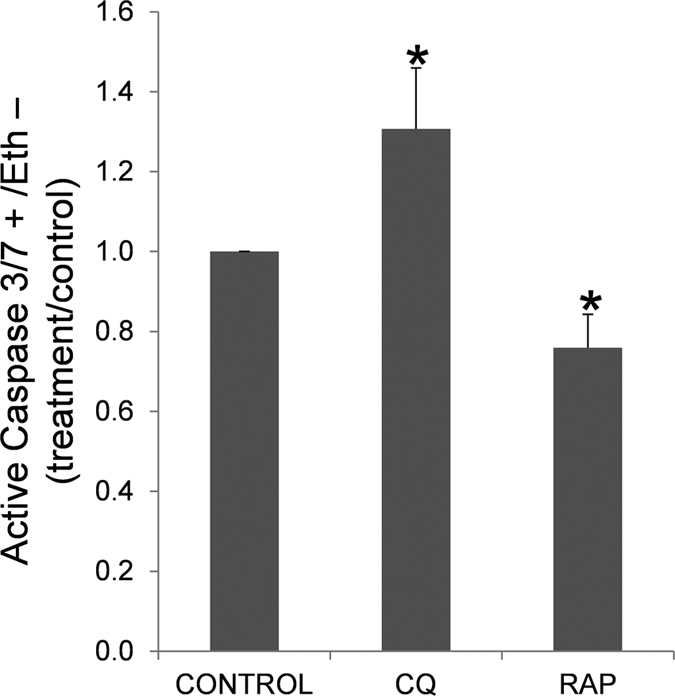
Macroautophagy (hereafter autophagy) is an evolutionarily highly conserved cellular process that participates in the maintenance of intracellular homeostasis through the degradation of most long-lived proteins and entire organelles. Autophagy participates in some reproductive events; however, there are not reports regarding the role of autophagy in the regulation of sperm physiology. Hence, the aim of this study was to investigate whether autophagy-related proteins are present and functionally active in human spermatozoa. Proteins related to autophagy/mitophagy process (LC3, Atg5, Atg16, Beclin 1, p62, m-TOR, AMPKα 1/2, and PINK1) were present in human spermatozoa. LC3 colocalized with p62 in the middle piece of the spermatozoa. Autophagy activation induced a significant increase in motility and a decrease in PINK1, TOM20 expression and caspase 3/7 activation. In contrast, autophagy inhibition resulted in decreased motility, viability, ATP and intracellular calcium concentration whereas PINK1, TOM20 expression, AMPK phosphorylation and caspase 3/7 activation were significantly increased. In conclusion our results show that autophagy related proteins and upstream regulators are present and functional in human spermatozoa. Modification of mitochondrial proteins expression after autophagy activation/inhibition may be indicating that a specialized form of autophagy named mitophagy may be regulating sperm function such as motility and viability and may be cooperating with apoptosis.


Figures

Figure 1
Figure 1. Identification of proteins related to autophagy pathway.
15 μg of proteins from whole cells lysates were loaded and separated by SDS-PAGE. Protein from rat brain was used as positive control for all proteins tested except for LC3 where the positive control was 293T cells with overexpressed human LC3 (10 μl). Immunoblotting was performed, as described in material and methods, with specific antibodies against: Atg 5, Atg 16, p62, LC3 (which recognizes both LC3-I and LC3-II), AMPKα1/2, m-TOR and Beclin 1 proteins.
Figure 2
Figure 2. LC3-II/LC3-I ratio in basal conditions.
Fresh semen was washed and proteins were extracted and further resolved in SDS-PAGE (see material and methods section). Immunoblotting was performed with an antibody that recognized both LC3-I and LC3-II proteins. Immunoblotting is a representative image of the protein expression of LC3 from 8 semen donors (lanes numbered from 1 to 8) from a total of 33. LC3-I and LC3-II were measured and autophagy flux was expressed as ratio of LC3-II/LC3-I.
Figure 3
Figure 3. LC3-II/LC3-I ratio in incubated samples.
Spermatozoa were incubated for 2 hours in absence (a) or presence (b) of bafilomycin A1 (100 nM) at 37 °C. Proteins were extracted, loaded and separated by SDS-PAGE. LC3 was detected by immunoblotting (see material and methods section). Results are expressed as increase of LC3-II/LC3-I ratio respect to fresh samples (T0). Columns with asterisk indicate significant differences (P < 0.05) respect to T0. n = 4.
Figure 4
Figure 4. Transmission electron microscopy analysis without bafilomycin A1.
Cells were prepared as described in the method section. Figure 4 shows representative transmission electron microscopy photographs of the head and the middle piece of the spermatozoa incubated for 2 hours in absence of bafilomycin A1. Vesicles are marked with arrows. Vesicle in the middle piece marked with an asterisk may represent the beginning of the process of sequestration. n = 3.
Figure 5
Figure 5. Transmission electron microscopy analysis with bafilomycin A1.
Cells were prepared as described in the method section. Figure 5 shows representative transmission electron microscopy photographs from spermatozoa incubated for 2 hours in presence of bafilomycin A1. Vesicles found in the head (a,b) are marked with arrows. The image (c) shows a membrane lamella in the head of the spermatozoa which may correspond to the multilamellar bodies associated with the autophagy process. Images (d,e) correspond to photographs obtained from the middle piece of the spermatozoa. Some of the vesicles found are marked with an arrow n = 3.
Figure 6
Figure 6. LC3-immunolocalization in fresh and incubated sperm cells.
Localization of LC3 in sperm cells was performed as described in materials and methods section (indirect immunofluorescence) with anti-LC3 antibody (1/250). LC3 protein was visualized in green. Figures (a,b) (spermatozoa from fresh samples) (c–e) (spermatozoa after 2 hours of incubation) (f) (spermatozoa after 2 hours of incubation with bafilomycin A1) are representative areas digitally augmented showing the localization of LC3. Figure (g) shows a representative area digitally augmented from merged images of LC3 and cells stained with MitoTracker Red CMXRos. Places where both LC3 and mitochondria colocalize are observed in yellow.
Figure 7
Figure 7. LC3 immunogold labeling.
Spermatozoa were incubated in presence of bafilomycin A1 for 2 hours. Then, cells were prepared as described in material and methods. Negative controls are representative images from the head and the middle piece where primary Ab was omitted. Figures (a,b) are representative areas of the head. Figures (c,d,e) are digitally augmented images from mitochondria of the middle piece of the spermatozoa. Some of the LC3 proteins labeled with immunogold particles are marked with arrows; red arrows indicate gold particles (LC3) located on the membranes.
Figure 8
Figure 8. Colocalization of LC3 with p62.
Colocalization of LC3 with p62/SQSTM1 sperm cells was performed as described in materials and methods section (indirect immunofluorescence) with specific antibodies: Anti-LC3 (1/250) and anti-p62 (1/200). LC3 protein was visualized in green and p62 in red. The figures (a,b) (spermatozoa from fresh samples) and (c,d) (spermatozoa after 2 hours of incubation) are representative areas digitally augmented showing the colocalization of LC3 and p62.
Figure 9
Figure 9. Effect of chloroquine and rapamycin on LC3-I and LC3-II expression.
Human spermatozoa were incubated for 2 hours at 37 °C in presence or absence of chloroquine (a) and rapamycin (b). Proteins were extracted and resolved by SDS_PAGE. Immunoblotting was performed with anti-LC3 antibody (described in materials and methods section). Results are expressed as increase of LC3-II/LC3-I ratio respect to control samples (containing only vehicle). Columns with asterisk indicate significant differences (P < 0.05) respect to control. n = 4. CQ: chloroquine; RAP: rapamycin.
Figure 10
Figure 10. Effect of chloroquine and rapamycin on spermatozoa viability and motility.
Sperm cells were incubated in presence of chloroquine (50 μM) and rapamycin (500 nM) for 2 hours at 37 °C. Further, cells were incubated with SYBR 14, propidium iodide (PI) and Hoechst 33342 and examined by flow cytometry (described in material and methods). Sperm motility was assessed by CASA. (a) graphic shows the percentage of SYBR 14 positive and PI negative cells and results are expressed as the increase respect to control ± SEM (containing vehicle) (n = 6); (b) figures represent the percentage of spermatozoa with progressive and rapid motility. Results are represented as percentage of maximum ± SEM (n = 4). Columns with asterisk indicate significant differences (P < 0.05). CQ: chloroquine; RAP: rapamycin.
Figure 11
Figure 11. Intracellular pH, ATP and calcium concentration.
Intracellular pH (a), ATP concentration (b) and intracellular calcium concentration (c1,c2) were studied in human spermatozoa, as described in material and methods section, after 2 hours of incubation with chloroquine (50 μM) and rapamycin (100 nM). ATP results are expressed as pM concentration of ATP in 100 μg of protein in each sample. Fluorescence of FURA-2-AM was recorded and changes in intracellular [Ca2+]i were monitored every second (c1). Area under the curve after progesterone addition was calculated and expressed as percentage of treatment vs control (c2). Results are expressed as mean ± SEM from 4 independent experiments. Columns marked with *indicate significant differences compared to control (containing vehicle) (P < 0.05). CQ: chloroquine; RAP: rapamycin.
Figure 12
Figure 12. Regulation of AMPKα 1/2 phosphorylation by chloroquine and rapamycin.
Spermatozoa were incubated in presence of chloroquine (50 μM) and rapamycin (100 nM). Proteins were then extracted and analyzed by immunoblotting. AMPKα 1/2 phosphorylation was studied with a phosphospecific antibody that recognized phosphorylation on Thr 172. These membranes were also incubated with tubulin for normalization. Results represent the fold-increase of P-Thr172-AMPKα 1/2 normalized with tubulin. Columns with asterisk indicate significant differences (P < 0.05) respect to control (vehicle). n = 4. CQ: chloroquine; RAP: rapamycin.
Figure 13
Figure 13. PINK1 regulation by chloroquine and rapamycin.
Identification of PINK1 (a) whole lysate from rat brain cells was used as positive control for protein identification. 15 μg of proteins from rat brain and human spermatozoa were loaded, separated by SDS-PAGE and immunoblotting was performed with a specific antibody against PINK1. PINK1, green signal, was studied by immunofluorescence, as described in material and methods in fresh samples (b). Regulation of PINK1 protein was studied in fresh and after 2 hours of incubation (c) and in the presence of chloroquine (50 μM) and rapamycin (100 nM) (d). Proteins were extracted, resolved and detected with specific antibody. Data from PINK1 was normalized respect to α-tubulin. Columns with asterisk indicate significant differences (P < 0.05) respect to control (containing vehicle). n = 4. CQ: chloroquine; RAP: rapamycin.
Figure 14
Figure 14. TOM20 protein and MitoTacker Deep Red (MTDR) fluorescence regulated by chloroquine and rapamycin.
Regulation of TOM20 protein was studied in fresh and after 2 hours of incubation (a) and in the presence of chloroquine (50 μM) and rapamycin (100 nM) (b). Proteins were extracted, resolved and detected with specific antibody. Data from TOM20 was normalized respect to α-tubulin. Columns with asterisk indicate significant differences (P < 0.05) respect to control (containing vehicle). n = 4. CQ: chloroquine; RAP: rapamycin. MTDR (c,d) was used to determine mitochondrial staining by flow cytometry in cells incubated in the presence of chloroquine (50 μM) and rapamycin (100 nM). Figure (c) is a representative and normalized histogram of the MTDR fluorescence obtained after treatment with rapamycin (blue) and chloroquine (green) for 2 hours. Figure (d) represents the mean of MTDR fluorescence of four different experiments and normalized respect to control. Columns with asterisk indicate significant differences (P < 0.05) respect to control (containing vehicle). CQ: chloroquine; RAP: rapamycin.
Figure 15
Figure 15. Caspase 3/7 activation.
Sperm cells were incubated in presence of chloroquine (50 μM) and rapamycin (500 nM) for 2 hours at 37 °C. After the incubation sperm cells were incubated with CellEvent Caspase-3/7 Green Detection Reagent, ethidium homodimer (Eth) and Hoechst 33342 and examined by flow cytometry as described in material and methods. Graphic shows the percentage of Caspase 3/7 positive cells and Eth negative cells (dead cells), expressed as increase of active caspase 3/7 in treatments respect to control (containing vehicle). Columns with asterisk indicate significant differences (P < 0.05) respect to control (vehicle). n = 6. CQ: chloroquine; RAP: rapamycin.

References

    1. Kraft C. & Martens S. Mechanisms and regulation of autophagosome formation. Curr Opin Cell Biol 24, 496–501 (2012). - PubMed
    1. Hasegawa J., Maejima I., Iwamoto R. & Yoshimori T. Selective autophagy: Lysophagy. Methods 75, 128–132 (2015). - PubMed
    1. Mao K., Liu X., Feng Y. & Klionsky D. J. The progression of peroxisomal degradation through autophagy requires peroxisomal division. Autophagy 10, 652–661 (2014). - PMC - PubMed
    1. Yoshii S. R. & Mizushima N. Autophagy machinery in the context of mammalian mitophagy. Biochim Biophys Acta 1853, 2797–2801 (2015). - PubMed
    1. Kabeya Y. et al.. LC3, a mammalian homologue of yeast Apg8p, is localized in autophagosome membranes after processing. EMBO J 19, 5720–5728 (2000). - PMC - PubMed

Publication types

MeSH terms