. 2016 Sep 16:6:33288.
doi: 10.1038/srep33288.

Micro-optical coherence tomography of the mammalian cochlea

Affiliations

Micro-optical coherence tomography of the mammalian cochlea

Janani S Iyer et al. Sci Rep. .

Abstract

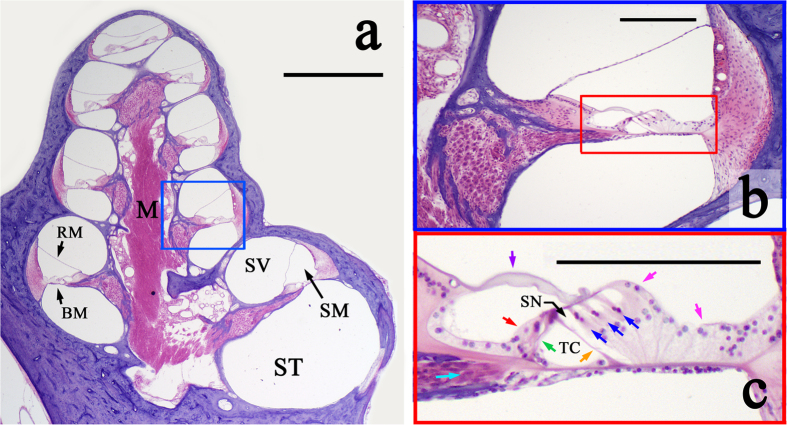
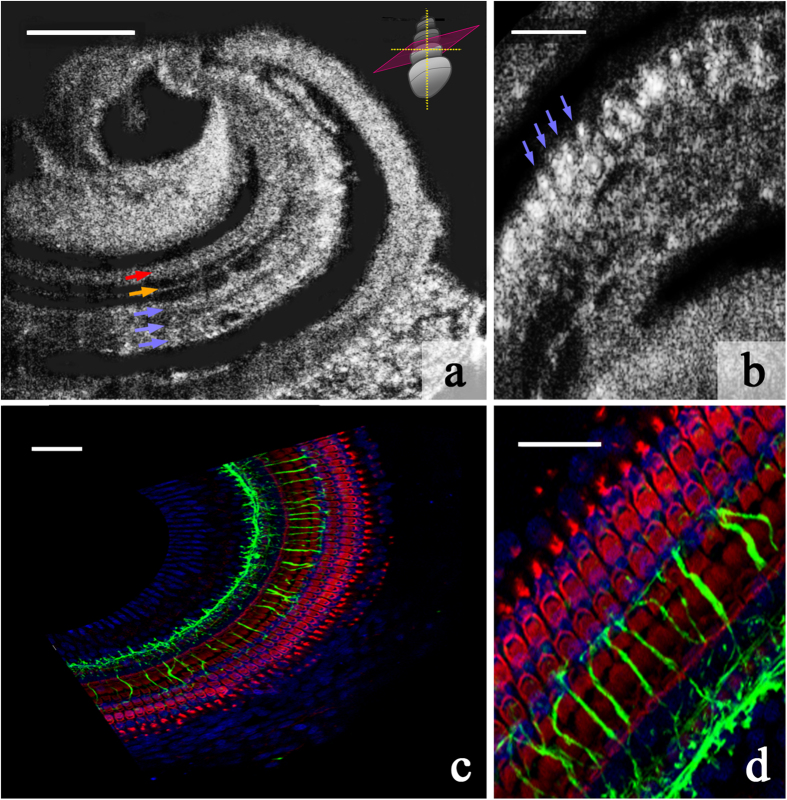
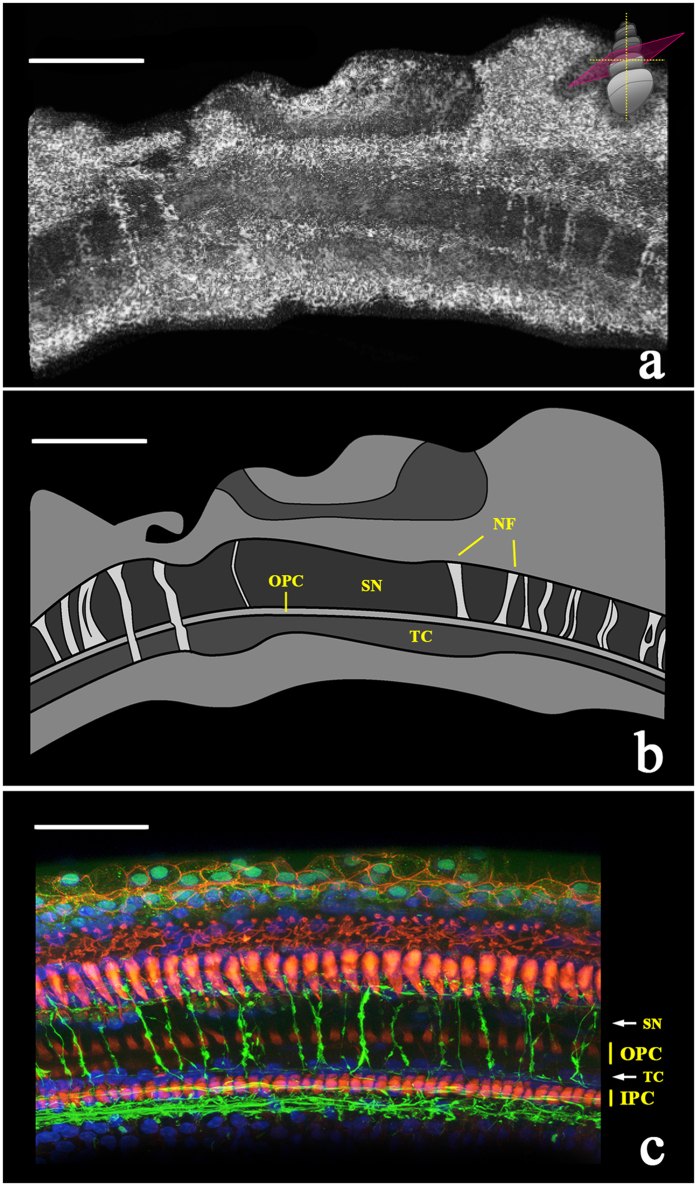
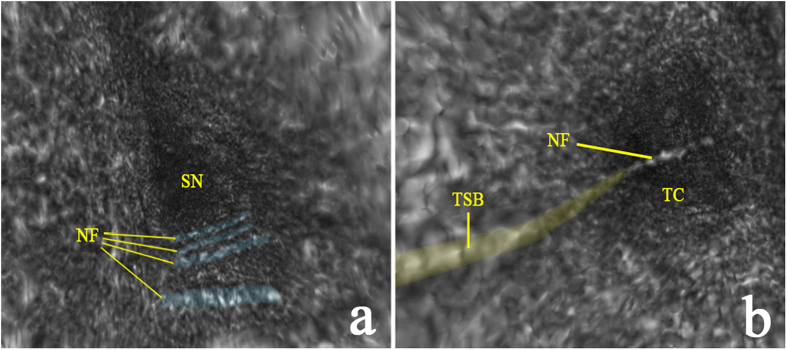
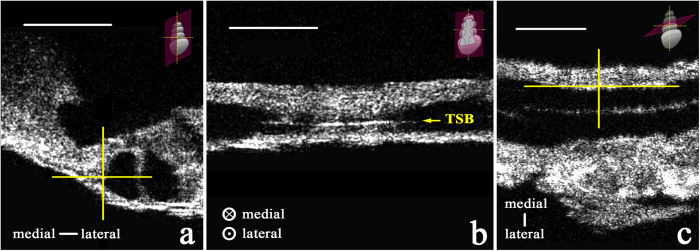
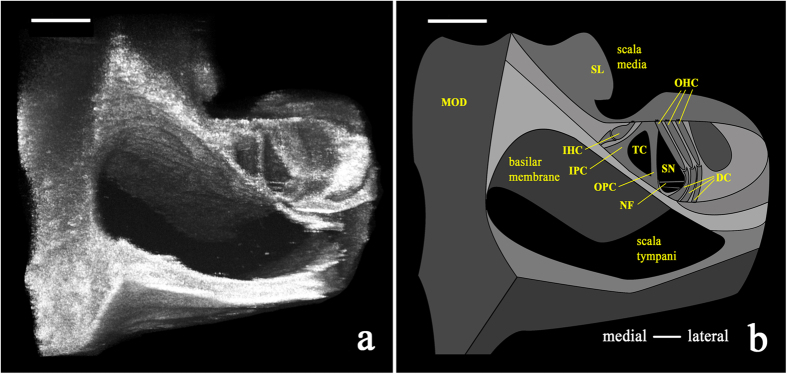
The mammalian cochlea has historically resisted attempts at high-resolution, non-invasive imaging due to its small size, complex three-dimensional structure, and embedded location within the temporal bone. As a result, little is known about the relationship between an individual's cochlear pathology and hearing function, and otologists must rely on physiological testing and imaging methods that offer limited resolution to obtain information about the inner ear prior to performing surgery. Micro-optical coherence tomography (μOCT) is a non-invasive, low-coherence interferometric imaging technique capable of resolving cellular-level anatomic structures. To determine whether μOCT is capable of resolving mammalian intracochlear anatomy, fixed guinea pig inner ears were imaged as whole temporal bones with cochlea in situ. Anatomical structures such as the tunnel of Corti, space of Nuel, modiolus, scalae, and cell groupings were visualized, in addition to individual cell types such as neuronal fibers, hair cells, and supporting cells. Visualization of these structures, via volumetrically-reconstructed image stacks and endoscopic perspective videos, represents an improvement over previous efforts using conventional OCT. These are the first μOCT images of mammalian cochlear anatomy, and they demonstrate μOCT's potential utility as an imaging tool in otology research.


Figures

Figure 1
Figure 1. Micrographs of a sectioned guinea pig cochlea.
(a) Cross-section of a guinea pig cochlea, stained with H&E, and cut along its longitudinal axis. M: modiolus. BM: basilar membrane; RM: Reissner’s membrane, ST: scala tympani; SM: scala media; SV: scala vestibuli. Magnification = 2×; Scale = 1 mm. (b) A single half-turn of the guinea pig cochlea, representing the region boxed in blue in (a). Magnification = 10×; Scale = 200 μm. (c) Zoomed-in view of the organ of Corti (boxed in red in (b)). Colored arrows point to specific cell types: inner (red) and outer (blue) hair cells, inner (green) and outer (orange) pillar cells, and neuronal fibers (turquoise), which travel through the tunnel of Corti (TC) and space of Nuel (SN). Pink arrows: supporting cells; purple arrow: tectorial membrane. Magnification = 10×; Scale = 200 μm.
Figure 2
Figure 2. μOCT images and immunohistochemically-stained regions of sensory and supporting cell rows within the guinea pig organ of Corti.
(a) Single 2D image from a μOCT imaging stack, depicting the regions of the inner pillar cells and inner hair cells (red arrow), outer pillar cells (orange arrow), and 3 rows of outer hair cells (blue arrows). The schematic in the top right-hand corner shows the orientation of the plane (pink) along which the image was sectioned relative to the orientation of the cochlea. Scale = 100 μm. (b) Single 2D image depicting individual outer hair cells (examples indicated with blue arrows). Scale = 50 μm. (c) Immunohistochemically-stained guinea pig organ of Corti whole mount, corresponding to the orientation presented in (a). Cytoskeletal actin within hair cells and supporting cells is labeled with rhodamine phallodin (red), neuronal processes are labeled with neurofilament-H (green), and cell nuclei are labeled with Hoechst stain (blue). Scale = 50 μm. (d) Zoomed-in view of immunohistochemically-stained guinea pig organ of Corti depicting the orientation presented in (b). Color convention as in (c). Scale = 25 μm.
Figure 3
Figure 3. μOCT image of nerve fiber bundles traversing the tunnel of Corti and space of Nuel to innervate outer hair cells (500 μm × 500 μm).
(a) Volumetric reconstruction of maximum-projected μOCT image stack, depicting bundles of nerve fibers traversing the organ of Corti towards the outer hair cell region. The schematic in the top right-hand corner shows the orientation of the virtual sectioning plane. Scale = 150 μm. (b) Schematic representation of the microanatomy in the top panel, with bundles of nerve fibers (NF) crossing the tunnel of Corti (TC) and/or the space of Nuel (SN). OPC = outer pillar cells. Scale = 150 μm. (c) For reference, a confocal laser scanning microscopy image of the guinea pig organ of Corti. Rhodamine phalloidin (red) marks outer and inner pillar cells (OPC and IPC, respectively), Hoechst stain (blue) marks cell nuclei, and neurofilament-H (green) marks neuronal fibers. Scale = 50 μm.
Figure 4
Figure 4. 3D volumetric reconstruction revealing bundles of nerve fibers traveling through the tunnel of Corti and space of Nuel.
(a) A labeled, colorized still from a 3D volumetric reconstruction of a μOCT image stack (Visualization 1a), “flying through” the space of Nuel (SN), showing bundles of nerve fibers (NF, blue) crossing the basal region of the SN. (b) A labeled, colorized still from a 3D volumetric reconstruction of a μOCT image stack (Visualization 1b), “flying through” the tunnel of Corti (TC), showing a single bundle of medial efferent nerve fibers crossing the central region of the TC, and the tunnel spiral bundle (TSB, yellow) running along the tunnel’s medial wall. Please refer to the Supplemental Materials to view Visualizations 1a and b. 500 μm × 500 μm field of view.
Figure 5
Figure 5. Two-dimensional μOCT images of the tunnel spiral bundle (TSB) (500 μm × 500 μm) within the guinea pig organ of Corti, in three perspectives.
Yellow cross hairs in (a) (cross-section of the organ of Corti and two fluid lumens, separated by a pillar cell) and (c) (looking down from above the organ of Corti) indicate the TSB’s (medial section, shown in (b)) specific position along the medial wall of the tunnel of Corti. The schematics in the top right-hand corner of each panel show the orientation of the 2D plane depicted, respectively. Scale = 100 μm.
Figure 6
Figure 6. Volumetrically reconstructed μOCT image (500 μm × 500 μm) and schematic of the guinea pig organ of Corti in situ.
(a) Volumetric reconstruction of μOCT-visualized sensory and non-sensory cells of the organ of Corti from the 2nd–3rd turn of the cochlea. (b) Schematic labeling structures visualized in the left panel, such as outer hair cells (OHC), bundles of nerve fibers (NF), and inner and outer pillar cells (IPC and OPC, respectively). MOD = modiolus; SL = spiral limbus; IHC = inner hair cell; TC = tunnel of Corti; SN = space of Nuel. Both scales = 100 μm.
Figure 7
Figure 7. μOCT instrumentation.
Schematic diagram of μOCT system. Supercontinuum laser (SCL) power is directed by collimating and focusing lenses (L) through a single mode fiber (SMF). Output light from the SMF is collimated and passed through an apodizing mirror (AM), resulting in a circular obscuration of the transmitted light, which is steered by a galvanometer mirror (GM) through an objective lens onto the sample. Light reflected by the AM is focused onto a reference mirror (RM), and the reference lens and mirror assembly can be translated in unison to adjust the reference path length. Back-scattered light from the sample is re-integrated at the SMF with light reflected by the RM. The return light is collimated and directed by the beam-splitter (BS) towards a diffraction grating (G). The spectrally dispersed light is then focused onto a line scan camera (LSC), which outputs raw spectrograms through a CameraLink (CL) interface to an image acquisition board (IMAQ) installed in a PC. The PC also controls scanning through a data acquisition card (DAQ), which produces an analog output (AO) voltage signal that controls the GM.

References

    1. Types of Hearing Loss. Center for Diease Control and Prevention, National Center on Birth Defects and Developmental Disabilities, http://www.cdc.gov/ncbddd/hearingloss/types.html. Accessed February 29, 2016 (2015).
    1. Ali Douraghy & Arion F. Chatziioannou. Basic Sciences of Nuclear Medicine, (Springer-Verlag Heidelberg Dordrecht, 2011).
    1. Nekolla S. G. & Saraste A. In Cardiac CT, PET, and MR (ed. Dilsizian V. & Pohost G. M.) 301–333 (Wiley-Blackwell, West Sussex, 2010).
    1. van der Jagt M. A. et al.. Visualization of human inner ear anatomy with high-resolution MR imaging at 7T: initial clinical assessment. AJNR. American journal of neuroradiology 36, 378–383 (2015). - PMC - PubMed
    1. Raphael Y. & Altschuler R. A. Structure and innervation of the cochlea. Brain research bulletin 60, 397–422 (2003). - PubMed

Publication types

MeSH terms