. 2017 Feb 1;595(3):777-803.
doi: 10.1113/JP273060. Epub 2016 Nov 4.

Accumulation of K+ in the synaptic cleft modulates activity by influencing both vestibular hair cell and calyx afferent in the turtle

Affiliations

Accumulation of K+ in the synaptic cleft modulates activity by influencing both vestibular hair cell and calyx afferent in the turtle

Donatella Contini et al. J Physiol. .

Abstract

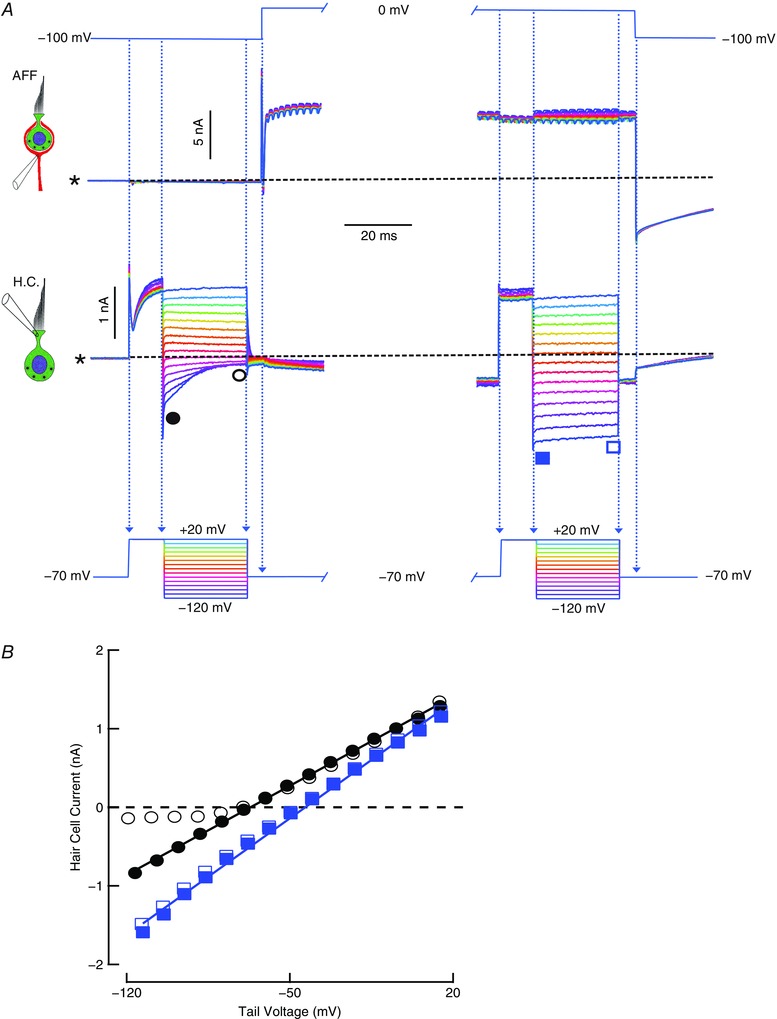
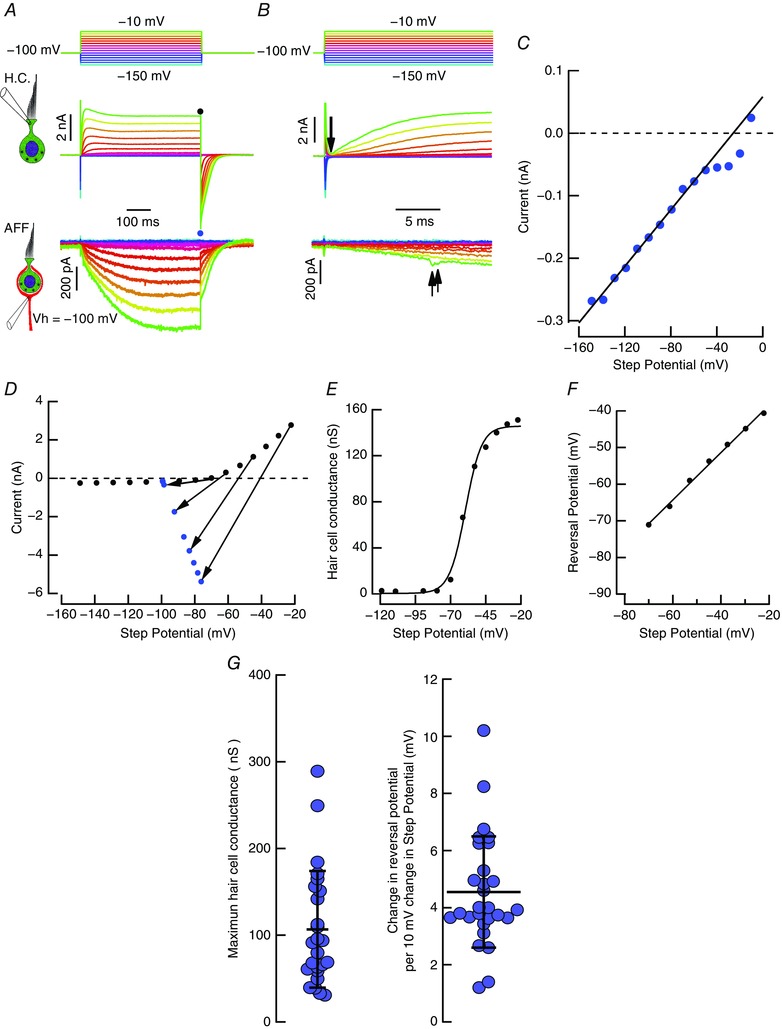
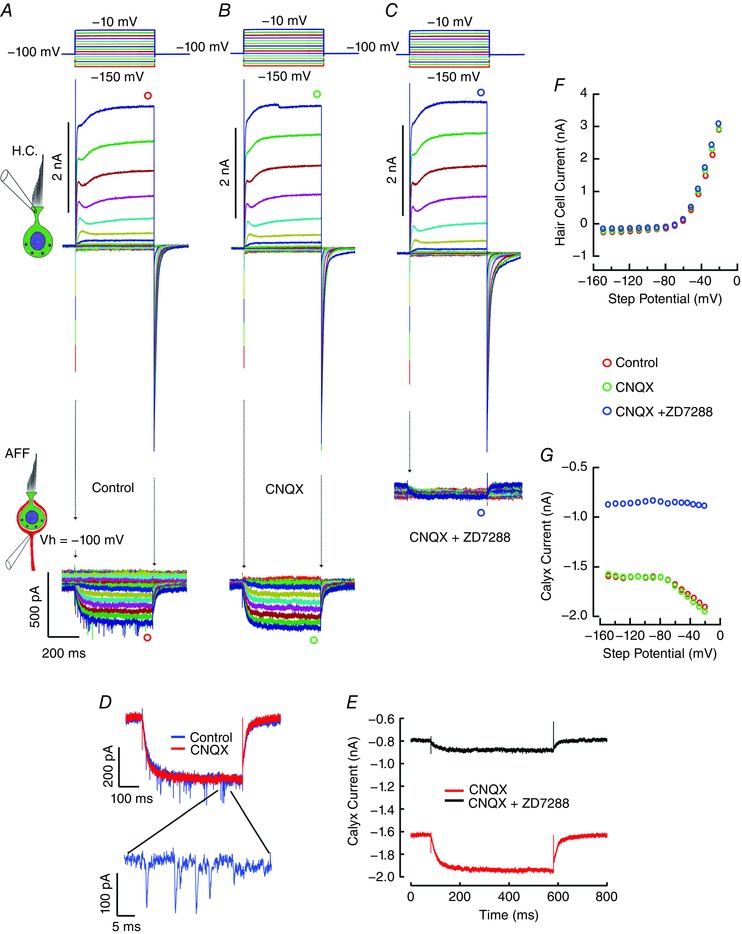
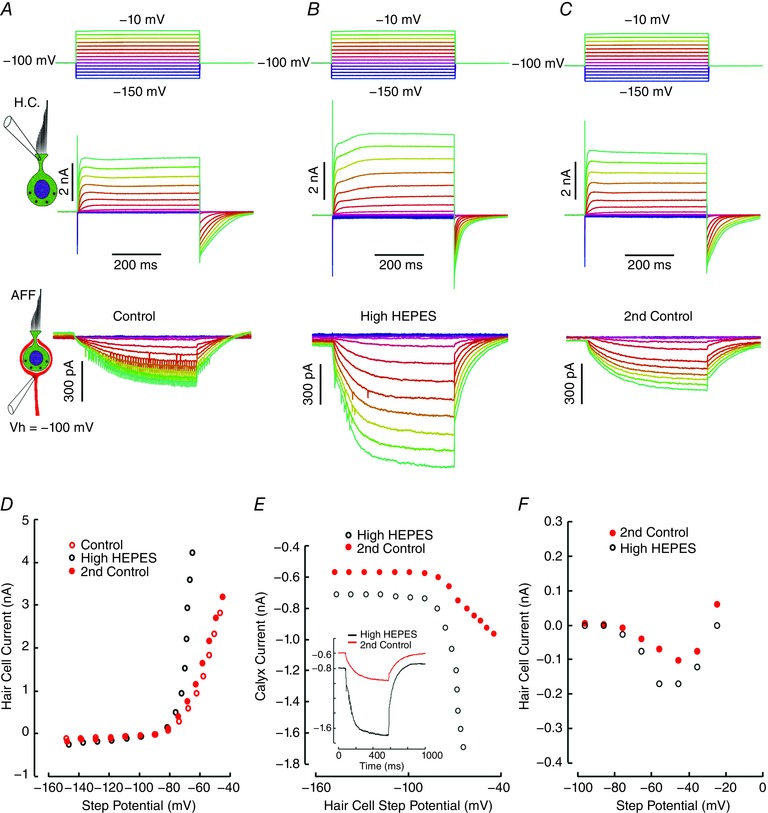
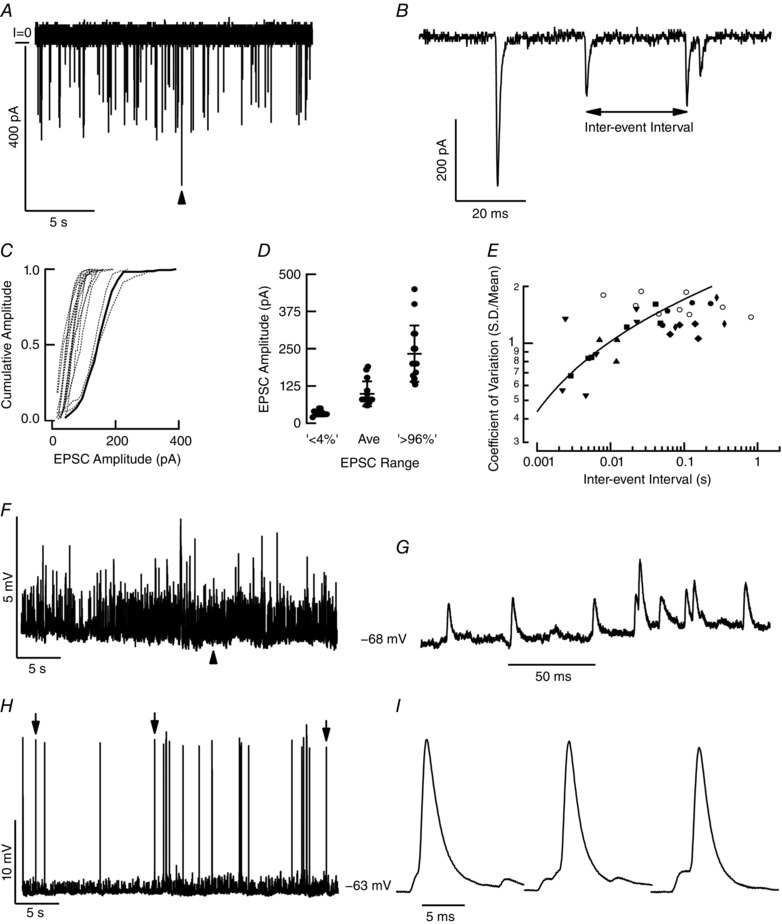
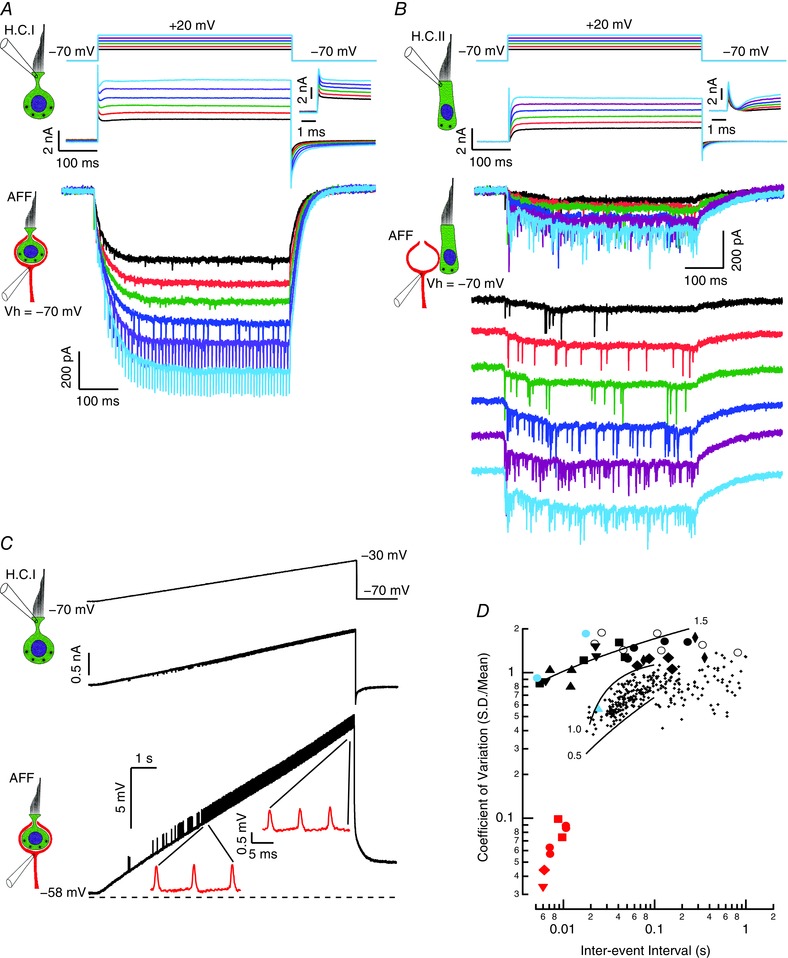
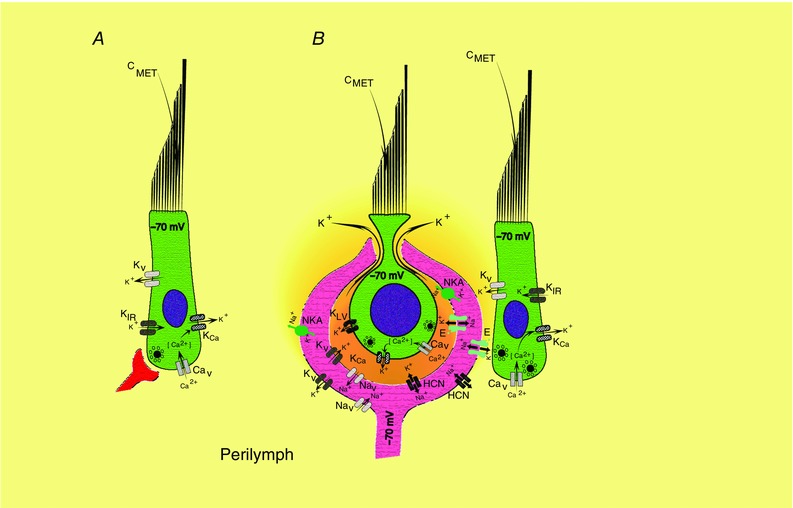
Key points: In the synaptic cleft between type I hair cells and calyceal afferents, K+ ions accumulate as a function of activity, dynamically altering the driving force and permeation through ion channels facing the synaptic cleft. High-fidelity synaptic transmission is possible due to large conductances that minimize hair cell and afferent time constants in the presence of significant membrane capacitance. Elevated potassium maintains hair cells near a potential where transduction currents are sufficient to depolarize them to voltages necessary for calcium influx and synaptic vesicle fusion. Elevated potassium depolarizes the postsynaptic afferent by altering ion permeation through hyperpolarization-activated cyclic nucleotide-gated (HCN) channels, and contributes to depolarizing the afferent to potentials where a single EPSP (quantum) can generate an action potential. With increased stimulation, hair cell depolarization increases the frequency of quanta released, elevates [K+ ]cleft and depolarizes the afferent to potentials at which smaller and smaller EPSPs would be sufficient to trigger APs.

Abstract: Fast neurotransmitters act in conjunction with slower modulatory effectors that accumulate in restricted synaptic spaces found at giant synapses such as the calyceal endings in the auditory and vestibular systems. Here, we used dual patch-clamp recordings from turtle vestibular hair cells and their afferent neurons to show that potassium ions accumulating in the synaptic cleft modulated membrane potentials and extended the range of information transfer. High-fidelity synaptic transmission was possible due to large conductances that minimized hair cell and afferent time constants in the presence of significant membrane capacitance. Increased potassium concentration in the cleft maintained the hair cell near potentials that promoted the influx of calcium necessary for synaptic vesicle fusion. The elevated potassium concentration also depolarized the postsynaptic neuron by altering ion permeation through hyperpolarization-activated cyclic nucleotide-gated (HCN) channels. This depolarization enabled the afferent to reliably generate action potentials evoked by single AMPA-dependent EPSPs. Depolarization of the postsynaptic afferent could also elevate potassium in the synaptic cleft, and would depolarize other hair cells enveloped by the same neuritic process increasing the fidelity of neurotransmission at those synapses as well. Collectively, these data demonstrate that neuronal activity gives rise to potassium accumulation, and suggest that potassium ion action on HCN channels can modulate neurotransmission, preserving the fidelity of high-speed synaptic transmission by dynamically shifting the resting potentials of both presynaptic and postsynaptic cells.

Keywords: excitatory synaptic transmission; hair cell; hyperpolarization-activated cyclic nucleotide-activated channels; potassium accumulation; synaptic modulation; vestibular system.


Figures

Figure 1
Figure 1. Dual recording from the sensory epithelium
A, schematic diagram of a primary afferent and its associated hair cells. A single myelinated afferent (red) may branch to several enveloping endings, each containing multiple type I hair cells. Additional input from type II hair cells may occur via synaptic input onto the outer face of the afferent (left‐hand synapse), or through bouton endings of fine collateral branches (right‐hand side). Efferent fibres (yellow) from the CNS are shown synapsing on both hair cells and the outer face of the calyx. B, fluorescence image of dye‐filled hair cell and afferent. C, confocal image showing one of three hair cells (green), enveloped by a complex calyx (red), with DAPI‐stained nuclei (blue). Four bouton endings associated with the dimorphic afferent are also visible (pink). D, central region of the posterior canal epithelium viewed in Nomarski differential interference contrast (DIC). The apical mechanically sensitive bundle is oriented toward the top of the panel, with the basolateral surface enveloped by the afferent ending below. E, DIC image of afferent electrode sealed onto the confluence of the afferent branches. Hair cell electrodes were sealed onto the most apical region of the basolateral surface not covered by the afferent (Fig. 1 B).
Figure 2
Figure 2. Paired responses of hair cell and afferent in current and voltage clamp
A, depolarizing current pulses, injected into a hair cell from the zero‐current potential of –70 mV, elicit a phasic voltage response. Simultaneous current‐clamp recording from the associated afferent reveal slow depolarizations that are proportional to the depolarization in the hair cell. Rapid depolarizations are visible in the largest traces when the afferent is depolarized above –74.3 mV. Synchrony of rapid afferent depolarizations and those in the hair cell for one level shown as inset. B, with the hair cell in current clamp and the afferent in voltage clamp, the depolarization of the hair cell (upper traces) is correlated with inward currents in the afferent (lower traces). C, hair cell and afferent in voltage clamp. Dashed line at zero current level. An outward current in the hair cell generates a slower inward current in the afferent, and hyperpolarization of the hair cell results in an outward current. D, depolarization of the afferent generates inward current in the hair cell and hyperpolarization of the afferent generates outward currents in the hair cell. Dashed line at zero current level.
Figure 3
Figure 3. Blocking potassium flux from the hair cell blocks the slow inward current in the afferent neuron
A, potassium flux was blocked by substituting (mm) 80 Na+, 20 4‐AP and 30 TEA for K+ in the recording pipette. Remaining 1% of typical hair cell current observed for K+‐filled electrodes is shown as the inset I–V. The slow inward current in the afferent was suppressed, although large EPSCs persist. B, afferent currents can be elicited by depolarizing and hyperpolarizing current steps. I h is visible for the largest hyperpolarizations. No currents are induced in the hair cell as a result of depolarizing or hyperpolarizing the afferent neuron.
Figure 4
Figure 4. Potassium accumulation in the cleft resulting from depolarizing the hair cell
A, repolarization protocol before and after prolonged hair cell depolarization, with the afferent held at –100 mV. Tail currents upon repolarization from a 10 ms depolarization to 20 mV (left traces) close more rapidly than those after a 250 ms depolarization (right traces). B, after 10 ms depolarization, the instantaneous (filled circles) and steady‐state (open circles) I–V curves for repolarization at the points indicated on the left traces of A, and after 250 ms depolarization, the instantaneous I–V curve (filled squares), that following 25 ms repolarization (open squares), and after 50 ms repolarization (crossed blue squares) for points indicated on the right traces of A. Asterisk and dashed line indicate the zero current level in the hair cell and a constant inward current of 2.695 nA in the afferent.
Figure 5
Figure 5. Potassium accumulation in the cleft resulting from depolarizing the afferent fibre
A, repolarization protocol before and after prolonged afferent depolarization. With the afferent held at –100mV, the hair cell tail currents upon repolarization from a 10 ms depolarization to 20 mV (left traces) close rapidly. After 245 ms afferent depolarization to 0 mV, the tails following a 10 ms depolarization to 20 mV remain largely open even after 25 ms (right traces). B, after 10 ms depolarization, the instantaneous (filled circles) and steady‐state (open circles) I–V curves for repolarization at the points indicated on the left traces of A, and after 245 ms afferent depolarization, instantaneous I–V curve (filled squares), and that following 25 ms repolarization (open squares) for points indicated on the right traces of A. Asterisk and dashed line indicate the zero current level in the hair cell, and a constant inward current of 2.703 nA in the afferent.
Figure 6
Figure 6. Analysis of chord conductances and reversal potential of hair cell current based on the steady‐state and tail currents
A, voltage‐clamp series applied to hair cell. Both hair cell and afferent were held at –100 mV. B, expanded view of the initial 25 ms of the responses in panel A. Arrow indicates a sampling point at 3× the electrode time constant, τ ≈ 35 μs. C, instantaneous hair cell I–V relationship at time point indicated by the downward arrow in panel B. Current deviations from the regression line for voltages depolarized to –60 mV were used to estimate I Ca. D, the steady‐state current (black circles), and the peak tail current after the capacity transient (blue circles) are plotted for each voltage. The slope of lines connecting corresponding steady‐state and tail currents are the conductance at the moment of transition. The point at which each line intersects the zero‐current axis is the reversal potential. E, chord conductances plotted against the corrected step potential. Conductances fit with a sigmoid function. F, reversal potentials plotted against the step potential. For depolarizations, the reversal potential vs. step potential is well fit by a line corresponding to a shift of 3.15 mV for each 10 mV of depolarization. G, aggregate conductance and reversal potential scatter plots at –100 mV. The maximal conductance averaged 106.74 ± 67.23 nS (n = 25), and the rate of shift in the reversal potential for each 10 mV of depolarization was 4.54 ± 1.95 mV (n = 28).
Figure 7
Figure 7. Response of the hair cell and afferent neuron pair to application of AMPAR and HCN blockers
A, with hair cell and afferent clamped at –100 mV, depolarization elicits outward current from the hair cell, with the slow inward current and EPSCs elicited in the afferent neuron. B, the experiment in the presence of 20 μm CNQX eliminates the large rapid EPSCs, but the slow inward current remains. Afferent response for the two largest traces from A and B are shown overlaid and expanded in panel D. C, addition of 200 μm ZD7288 to CNQX results in a decrease in the standing inward current in the afferent, as well as a reduction of 85% in the response elicited by hair cell depolarization. Afferent currents for maximal hair cell depolarizations in B and C are shown in expanded view in panel E. F, steady‐state I–V curve for presynaptic hair cell at the end of the depolarizing step under the three conditions. G, steady‐state I–V curve for postsynaptic neuron at the end of the depolarizing step in the hair cell under control and in the presence of CNQX and ZD7288.
Figure 8
Figure 8. Effect of increased pH buffering on hair cell and afferent responses
A, hair cell and afferent responses to voltage steps in 10 mm Hepes (control). Decay of tail current, τ = 62.6 ms. B, series repeated in 40 mm Hepes. Hair cell outward current and the induced inward current increase. Decay of the tail current, τ = 34.3 ms. C, subsequent return control in 10 mm Hepes. Decay time constant, τ = 61.6 ms. D, steady‐state hair cell current in 10 mm Hepes (control), and in 40 mm Hepes (High Hepes). E, effect of [Hepes]o on afferent I–V curve induced by depolarization of the hair cell in 10 mm (filled circles) and 40 mm Hepes (open circles). Inset, maximal afferent response to depolarization of the hair cell in normal (10 mm) and high Hepes (40 mm). F, inward calcium current I–V curve (measured as in Fig. 6 C) under normal (filled circles) and high Hepes (open circles).
Figure 9
Figure 9. Behaviour of spontaneous quantal events
A, spontaneous EPSCs recorded in the afferent neuron. B, trace at arrowhead in panel A expanded to show variation in amplitude and timing of EPSCs. C, cumulative amplitude histograms of EPSC amplitude for 15 cells. Thick line indicates amplitude histogram of the afferent shown in A and B. D, average amplitude and that of the smallest and largest 4% of events for these cells. E, coefficient of variation (CV) for 16 cells. Continuous line is fit to a power function for a unit (filled squares) with a standardized CV* at 50 ms of 1.5. F, in current clamp, spontaneous EPSPs arise from a baseline of –68 mV. G, trace at arrowhead in panel F expanded to show unitary EPSPs. H, an inward current of 200 pA depolarized the afferent to –63 mV. Large action potentials arise from single, large EPSPs as well as from the summation of smaller, contemporaneous EPSPs. I, expanded traces, corresponding to downward arrows in panel H showing EPSPs giving rise to APs.
Figure 10
Figure 10. Comparison of depolarization of type I and type II hair cells on afferent response
A, rapid outward currents (expanded inset) result from depolarization of a type I hair cell. Slow inward currents and EPSCs are evoked in the afferent. In the fourth trace (dark blue) the largest EPSCs trigger TTX‐blockable currents associated with generating APs. Larger inward currents give rise to high‐frequency, evenly spaced discharge. B, outward currents (expanded inset) develop slowly upon depolarization of a type II hair cell. Large EPSCs are evoked in the afferent, with small, slow inward current with the largest hair cell depolarization. In the lower set of afferent traces, the afferent responses are displaced from each other by 200 pA, to reveal the increased EPSC frequency associated with hair cell depolarization. C, ramp depolarization of a type I hair cell in voltage clamp generated a ramp of outward current. This was associated with a depolarization of the afferent held in current clamp. Continuous high‐frequency discharge, 117 Hz (expanded) at –51.9 mV increased to 143 Hz (expanded inset) at –43.9 mV. D, coefficient of variation in the timing between events. The small points are data from Brichta & Goldberg (2000 a) (adapted with permission from the American Physiological Society) and show regularity of calyceal and dimorphic afferents in the posterior semicircular canal of the turtle. Thin black lines are power functions delimiting units with CVs between 0.5 and 1.0. The large black symbols and thick black line are replotted from Fig. 9 E and show the regularity of EPSCs and EPSPs in the current study for 16 cells. The large blue filled circles and triangle show evoked APs for two afferents. The red symbols show the regularity of high‐frequency afferent discharge evoked by large inward currents.
Figure 11
Figure 11. Schematic diagrams of synaptic transmission between type II and type I hair cells and their afferent fibres
A, type II hair cells with bouton endings are depolarized by cationic transduction currents through the mechanically sensitive bundle. Positive feedback to further depolarize the cell is afforded by I Ca and the negative‐slope region of I KIR (Goodman & Art, 1996). Negative feedback is provided by I K and IKCa that would repolarize the cell. B, type I hair cells within a calyx are depolarized by cationic transduction currents through the mechanically sensitive bundle. Positive feedback to depolarize the cell is provided by I Ca, a glutamate transporter (not shown) (Dalet et al. 2012), and a shift in the K+ equilibrium potential, due to K+ accumulation in the cleft. The K+ current efflux is primarily through low‐voltage‐activating K+ channels (KLV), calcium‐activated K+ channels (KCa) and high‐voltage activating K+ channels (not illustrated). Type II hair cells synapsing on the external face of the afferent function in a manner similar to that of type II hair cells onto boutons. For both internal and external face synapses, the afferent is depolarized by glutamate acting on AMPARs. Positive feedback to depolarize the afferent further results from the actions of non‐inactivating Na+ currents (I Na), HCN channels (I h) and possibly glutamate transporters. Negative feedback, tending to repolarize the cell, has contributions from a wide variety of K+ channels (I K) and activity of the Na+/K+‐ATPase (NKA). Transporters and channels on the external face would experience relatively constant ion concentrations, while those on the inner face would change dynamically with activity.

Comment in

References

    1. Adelman WJ Jr, Palti Y & Senft JP (1973). Potassium ion accumulation in a periaxonal space and its effect on the measurement of membrane potassium ion conductance. J Membr Biol 13, 387–410. - PubMed
    1. Almers W (1972). Potassium conductance changes in skeletal muscle and the potassium concentration in the transverse tubules. J Physiol 225, 33–56. - PMC - PubMed
    1. Araque A, Parpura V, Sanzgiri RP & Haydon PG (1999). Tripartite synapses: glia, the unacknowledged partner. Trends Neurosci 22, 208–215. - PubMed
    1. Attwell D, Cohen I & Eisner D (1979). Membrane potential and ion concentration stability conditions for a cell with a restricted extracellular space. Proc R Soc Lond B Biol Sci 206, 145–161. - PubMed
    1. Attwell D & Iles JF (1979). Synaptic transmission: ion concentration changes in the synaptic cleft. Proc R Soc Lond B Biol Sci 206, 115–131. - PubMed

Publication types

Substances