. 2017 Jan;34(1):73-83.
doi: 10.1007/s11095-016-2040-z. Epub 2016 Sep 15.

A LC-MS/MS Method for Quantifying Adenosine, Guanosine and Inosine Nucleotides in Human Cells

Affiliations

A LC-MS/MS Method for Quantifying Adenosine, Guanosine and Inosine Nucleotides in Human Cells

Leah C Jimmerson et al. Pharm Res. 2017 Jan.

Abstract

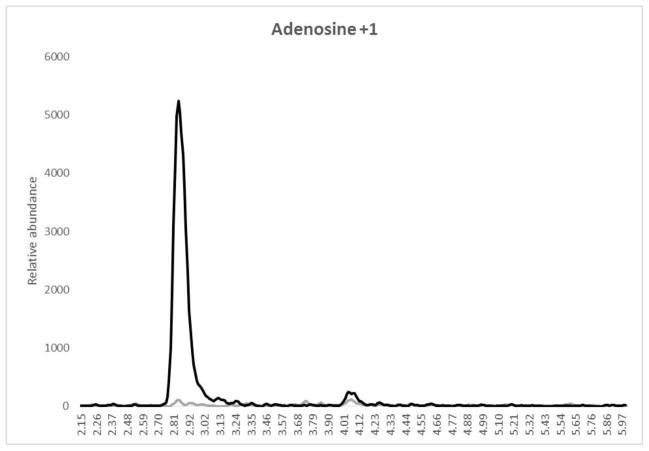
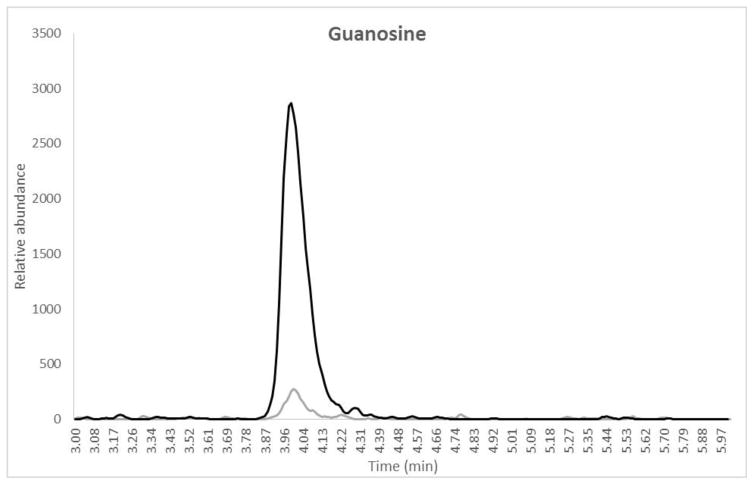
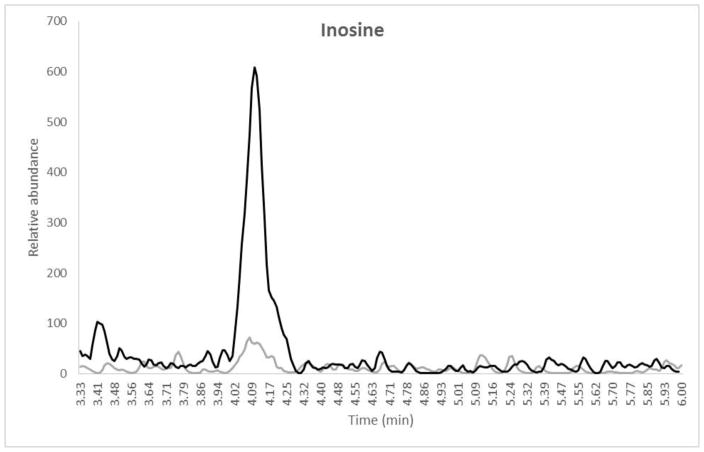
Purpose: To develop and validate a method for the simultaneous measurement of adenosine, guanosine, and inosine derived from mono (MP) and triphosphate (TP) forms in peripheral blood mononuclear cells (PBMCs), red blood cells (RBCs) and dried blood spots (DBS).

Methods: Solid phase extraction of cell lysates followed by dephosphorylation to molar equivalent nucleoside and LC-MS/MS quantification.

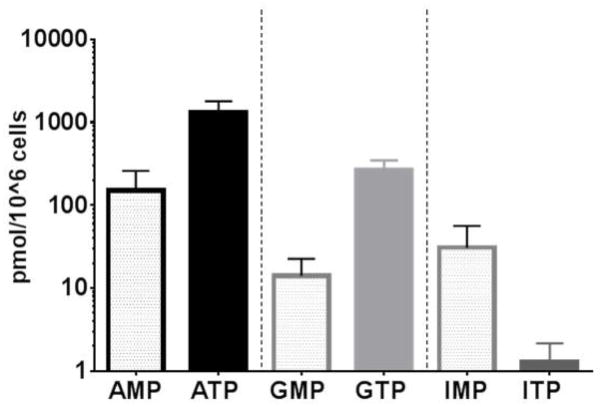
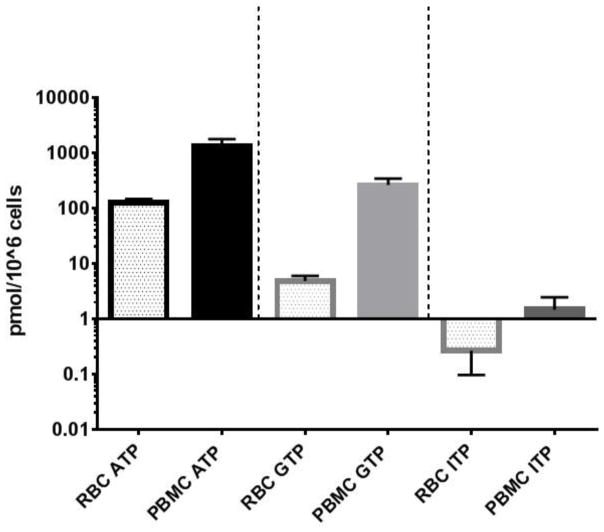
Results: The assay was linear for each of the three quantification ranges: 10-2000, 1.0-200 and 0.25-50 pmol/sample for adenosine, guanosine, and inosine, respectively. Intraassay (n = 6) and interassay (n = 18) precision (%CV) were within 1.7 to 16% while accuracy (%deviation) was within -11.5 to 14.7% for all three analytes. Nucleotide monophosphates were less concentrated than triphosphates (except for inosine) and levels in PBMCs were higher than RBCs for all three nucleotides (10, 55, and 5.6 fold for ATP, GTP and ITP, respectively). DBS samples had an average (SD) of -26% (22.6%) lower TP and 184% (173%) higher MP levels compared to paired RBC lysates, suggesting hydrolysis of the TP in DBS.

Conclusion: This method was accurate and precise for physiologically relevant concentrations of adenosine, guanosine and inosine nucleotides in mono- and triphosphate forms, providing a bioanalytical tool for quantitation of nucleotides for clinical studies.

Keywords: LC-MS/MS; analytical method; dried blood spots; intracellular quantification; purine nucleotides.


Figures

Figure 1
Figure 1
Overlay chromatograms with blank IS (gray) and LLOQ (black) for (a) Adenosine, retention time 3.12 min, (b) Guanosine, retention time 4.05 min and (c) Inosine, retention time 4.16 min. X-axis represents the retention time in minutes and the Y-axis is the relative abundance normalized to the LLOQ response. The total run time for the method was 6.0 minutes. Note that the sample was dephosphorylated from the TP fraction prior to analysis.
Figure 1
Figure 1
Overlay chromatograms with blank IS (gray) and LLOQ (black) for (a) Adenosine, retention time 3.12 min, (b) Guanosine, retention time 4.05 min and (c) Inosine, retention time 4.16 min. X-axis represents the retention time in minutes and the Y-axis is the relative abundance normalized to the LLOQ response. The total run time for the method was 6.0 minutes. Note that the sample was dephosphorylated from the TP fraction prior to analysis.
Figure 2
Figure 2
Mean (SD) concentrations of MP and TP for adenosine, guanosine and inosine at day 1 of RBV treatment. The Y-axis is the back transformed value of each analyte in pmol/106 cells. Black=Adenosine nucleotide, light gray=Guanosine nucleotide and dark gray=Inosine nucleotide. Clear bars are MP and solid bars are the TP fractions measured.
Figure 3
Figure 3
Comparison of mean (SD) adenosine, guanosine and inosine levels in RBCs and PBMCs at day 1 of RBV treatment. The Y-axis is back transformed and denotes analytes in pmol/106 cells. Black=ATP, light gray=GTP and dark gray=ITP with clear bars representing RBCs and solid bars representing PBMCs.

References

    1. Scheele KW. Examen chemicum calculi urinarii. Opuscula. 1776;73(2)
    1. Garrod AB. On the Blood and Effused Fluids in Gout, Rheumatism, and Bright’s Disease. Med Chir Trans. 1854;37:49–601. - PMC - PubMed
    1. Nyhan WL. Disorders of purine and pyrimidine metabolism. Mol Genet Metab. 2005;86(1–2):25–33. - PubMed
    1. Edwards NL, Fox IH. Disorders associated with purine and pyrimidine metabolism. Spec Top Endocrinol Metab. 1984;6:95–140. - PubMed
    1. Nuki G. Human purine metabolism: some recent advances and relationships with immunodeficiency. Ann Rheum Dis. 1983;42(Suppl 1):8–11. - PMC - PubMed

Publication types

LinkOut - more resources