. 2016 Sep 15;17(1):185.
doi: 10.1186/s13059-016-1042-9.

DNA replication stress mediates APOBEC3 family mutagenesis in breast cancer

Affiliations

DNA replication stress mediates APOBEC3 family mutagenesis in breast cancer

Nnennaya Kanu et al. Genome Biol. .

Abstract

Background: The APOBEC3 family of cytidine deaminases mutate the cancer genome in a range of cancer types. Although many studies have documented the downstream effects of APOBEC3 activity through next-generation sequencing, less is known about their upstream regulation. In this study, we sought to identify a molecular basis for APOBEC3 expression and activation.

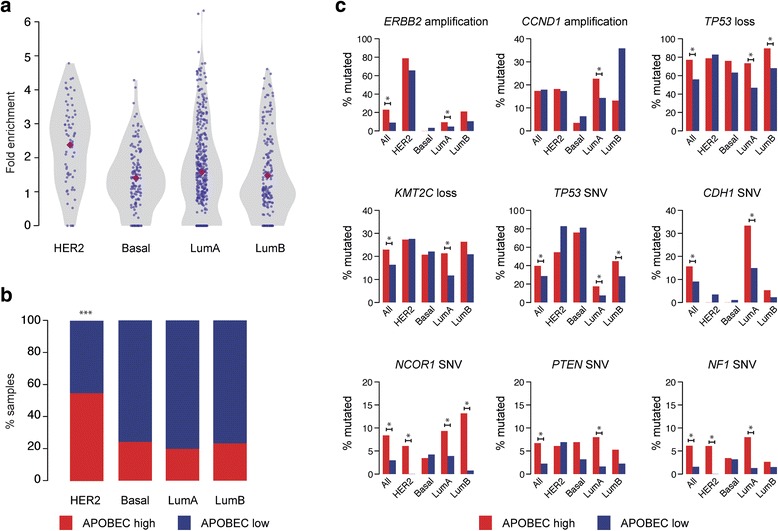
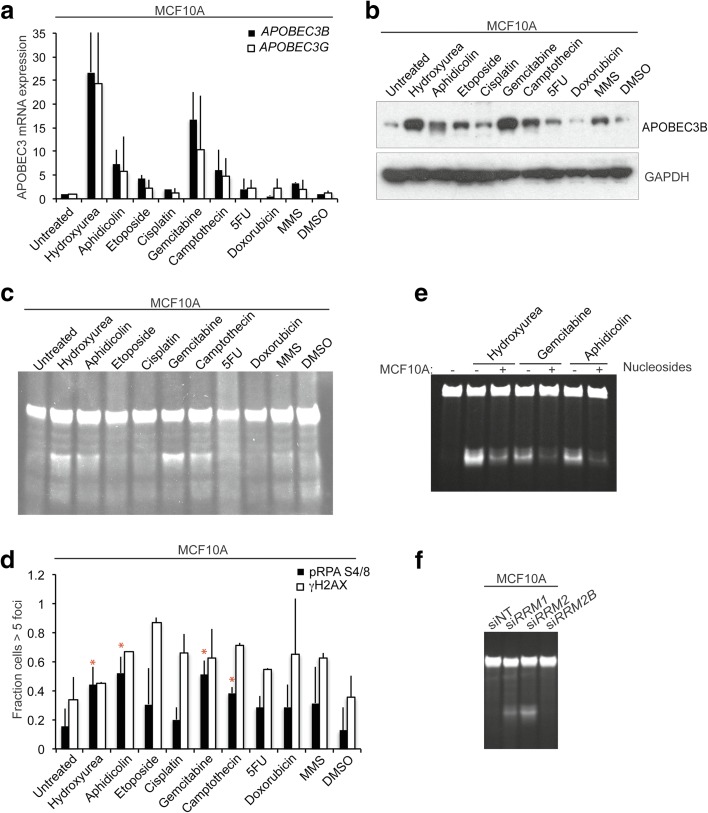
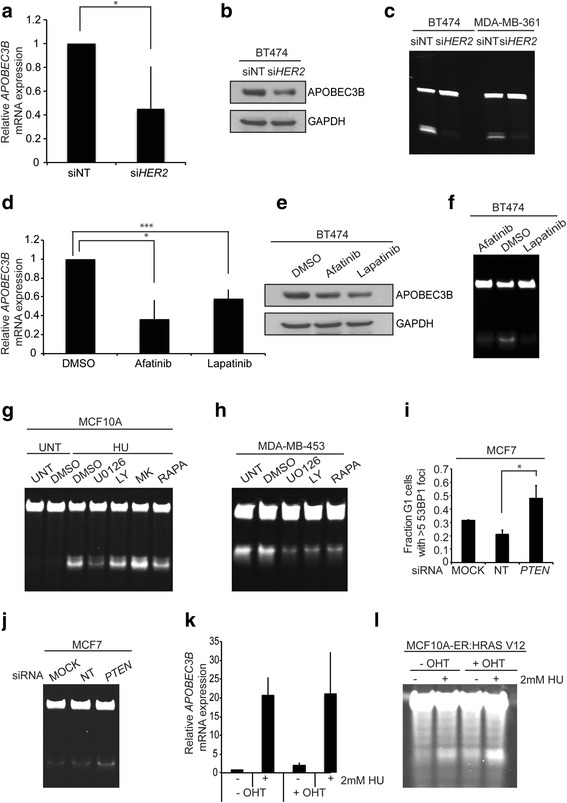
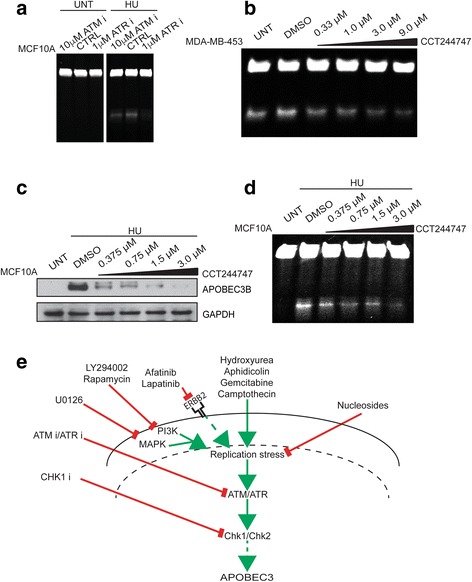
Results: HER2 amplification and PTEN loss promote DNA replication stress and APOBEC3B activity in vitro and correlate with APOBEC3 mutagenesis in vivo. HER2-enriched breast carcinomas display evidence of elevated levels of replication stress-associated DNA damage in vivo. Chemical and cytotoxic induction of replication stress, through aphidicolin, gemcitabine, camptothecin or hydroxyurea exposure, activates transcription of APOBEC3B via an ATR/Chk1-dependent pathway in vitro. APOBEC3B activation can be attenuated through repression of oncogenic signalling, small molecule inhibition of receptor tyrosine kinase signalling and alleviation of replication stress through nucleoside supplementation.

Conclusion: These data link oncogene, loss of tumour suppressor gene and drug-induced replication stress with APOBEC3B activity, providing new insights into how cytidine deaminase-induced mutagenesis might be activated in tumourigenesis and limited therapeutically.

Keywords: APOBEC; Genomic instability; Replication stress; Somatic mutation.


Figures

Fig. 1
Fig. 1
APOBEC3 mutational signatures and associated genes in breast cancer subtypes. a Violin plots showing APOBEC3 mutagenesis fold enrichment. The purple diamond represents the median in each subtype. b Boxplots showing percentage of ‘APOBEC high’ (red) and ‘APOBEC low’ (blue) samples in each subtype. Asterisks represent a significant p value <0.05 from pairwise post hoc tests. c Single-nucleotide variants (SNVs) and SCNAs associated with ‘APOBEC high’ tumour samples. Bars denote proportion of ‘APOBEC high’ (red) and ‘APOBEC low’ (blue) samples harbouring mutation. Amplification and loss refer to ≥2× ploidy and ≤1 copy number relative to ploidy, respectively. An asterisk denotes significant association in subtype (q < 0.1 by permutation test, corrected for analysis of multiple genes by the Benjamini–Hochberg method). Note differing scales used on the y-axis. Lum luminal
Fig. 2
Fig. 2
APOBEC3 activity and replication stress in breast cancer cell lines. a APOBEC3B (black), APOBEC3G (grey) and APOBEC3A (white) mRNA expression in 15 breast cancer cell lines as determined by quantitative PCR. HER2+ cell lines (red), basal cell lines (black), luminal cell lines (green). SKBR3 cells have a null mutation for APOBEC3B. Error bars represent standard deviation. b APOBEC3 activity in the 15 breast cancer cell lines used in a. Cells were lysed and subjected to oligonucleotide-based cytidine deamination assay followed by electrophoresis on 15 % TBE-urea gels. c Cells were grown for two population doublings on glass coverslips followed by fixation and staining with 53BP1 and cyclin A antibodies. The fractions of cyclin A-negative cells displaying more than five 53BP1 nuclear foci were scored. APOBEC3B mRNA expression was determined by quantitative PCR from parallel cell lysates. A Spearman’s rank correlation test was performed to correlate the fraction of 53BP1 nuclear bodies in cell lines with the level of APOBEC3B (r = 0.62, p = 0.0284). Error bars represent standard deviation. d BT474 cells were treated with 12.5–300 μM nucleosides for 72 h prior to lysis. Western blots were probed with the indicated antibodies. e BT474 cells were treated as in d followed by lysis and an APOBEC3 cytidine deamination assay
Fig. 3
Fig. 3
Induction of replication stress and APOBEC3 activity in breast cancer cell lines. a MCF10A cells were treated with the indicated drugs for 48 h followed by mRNA extraction, cDNA synthesis and quantitative PCR for APOBEC3B and APOBEC3G expression levels. b MCF10A cells were treated as in a followed by western blotting with the indicated antibodies. c MCF10A cells were treated as in a prior to lysis and a cytidine deamination assay for APOBEC3 activity using probe 2. d MCF10A cells were treated as in a followed by fixation and immunofluorescence for Ser139 γH2AX and S4/8 replication protein A phosphorylation (pRPA). Red asterisks indicate treatments inducing APOBEC3B mRNA, protein expression, activity levels and S4/8 RPA phosphorylation. e MCF10A cells were pre-treated with 300 μM exogenous nucleosides followed by incubation with the indicated drugs for an additional 24 h. Following lysis, APOBEC3 activity was measured by a cytidine deamination assay. f Ribonucleotide reductase subunits RRM1, RRM2 and RRM2B were depleted from MCF10A cells by RNA interference and, after 72 h, cells were lysed and subjected to an APOBEC3 cytidine deamination assay. 5FU 5-fluorouracil, MMS methyl methanesulfonate, siNT non-targeting control siRNA
Fig. 4
Fig. 4
HER2 expression and PTEN contribute to APOBEC3 activity. a APOBEC3B mRNA expression following silencing of HER2 expression in BT474 cells by RNAi. HER2 levels were depleted by RNAi and, after 72 h, cells were harvested and mRNA extracted. Following cDNA synthesis, APOBEC3B mRNA levels were determined by quantitative PCR; *p < 0.01 (t-test). siNT non-targeting control siRNA. b BT474 cells were treated as in a and, following lysis, western blots were probed with the indicated antibodies. c BT474 and MDA-MB-361 cells were treated as in a and, following lysis, samples were subjected to cytidine deamination assay to determine levels of APOBEC3 activity. d BT474 cells were treated with 10 nM afatinib or 30 nM lapatinib for 24 h followed by mRNA isolation and quantitative PCR to determine APOBEC3B mRNA expression levels; *p < 0.01, ***p < 0.005 (t-test). e BT474 cells were treated as in d and, following lysis, western blots were probed with the indicated antibodies. f BT474 cells were treated as in d and, following lysis, samples were subjected to cytidine-based deamination assay to determine levels of APOBEC3 activity. g MCF10A cells were treated with or without 2 mM hydroxyurea (HU) and exposed to the indicated drugs for 48 h followed by APOBEC3 cytidine deamination assay. h MDA-MB-453 cells were treated with the indicated drugs for 48 h followed by APOBEC3 cytidine deamination assay. i PTEN levels were depleted from MCF7 cells growing on glass coverslips by RNAi. Cells were fixed and stained with 53BP1 and cyclin A antibodies. The fraction of cyclin A-negative cells displaying more than five 53BP1 nuclear foci were scored; *p < 0.05 (t-test). j PTEN levels were depleted from MCF7 cells by RNAi. After 72 h cells were harvested and samples were subjected to cytidine deamination assay to determine APOBEC3 activity. k APOBEC3 activity in response to RAS induction and hydroxyurea (HU) treatment. MCF10A-ER:HRAS V12 cells were induced with tamoxifen (4-hydroxytamoxifen; 4- OHT) in either the presence or absence of hydroxyurea for 48 h, followed by mRNA isolation, cDNA synthesis and quantitative PCR to determine APOBEC3B expression levels. l MCF10A-ER:HRAS V12 cells were treated as in k. Cells were subsequently lysed and subjected to APOBEC3 cytidine deamination assay. LY LY294002, MK MK2206, NT non-targeting, RAPA rapamycin, UNT untreated
Fig. 5
Fig. 5
DNA damage signalling and APOBEC3 activity in breast cancer cell lines. a MCF10A cells were treated with ATM or ATR inhibitors for 24 h after which cells were treated with hydroxyurea (HU) for a further 48 h prior to lysis and cytidine deamination assay for APOBEC3 activity. b MDA-MB-453 cells were treated for 48 h with the indicated doses of Chk1 inhibitor CCT244747 followed by APOBEC3 cytidine deamination assay. c MCF10A cells were treated for 48 h with the indicated doses of Chk1 inhibitor CCT244747 and with 2 mM hydroxyurea for the last 24 h. Following lysis, western blots were probed with the indicated antibodies. d MCF10A cells were treated as in c before lysis and cytidine deamination assay to determine APOBEC3 activity. e Model illustrating mechanisms of APOBEC3 regulation by replication stress. CTRL control, UNT untreated

Comment in

References

    1. Hanahan D, Weinberg RA. Hallmarks of cancer: the next generation. Cell. 2011;144:646–74. doi: 10.1016/j.cell.2011.02.013. - DOI - PubMed
    1. Bartkova J, Horejsi Z, Koed K, Kramer A, Tort F, Zieger K, Guldberg P, Sehested M, Nesland JM, Lukas C, et al. DNA damage response as a candidate anti-cancer barrier in early human tumorigenesis. Nature. 2005;434:864–70. doi: 10.1038/nature03482. - DOI - PubMed
    1. Bartkova J, Rezaei N, Liontos M, Karakaidos P, Kletsas D, Issaeva N, Vassiliou LV, Kolettas E, Niforou K, Zoumpourlis VC, et al. Oncogene-induced senescence is part of the tumorigenesis barrier imposed by DNA damage checkpoints. Nature. 2006;444:633–7. doi: 10.1038/nature05268. - DOI - PubMed
    1. Burrell RA, McGranahan N, Bartek J, Swanton C. The causes and consequences of genetic heterogeneity in cancer evolution. Nature. 2013;501:338–45. doi: 10.1038/nature12625. - DOI - PubMed
    1. Gerlinger M, McGranahan N, Dewhurst SM, Burrell RA, Tomlinson I, Swanton C. Cancer: evolution within a lifetime. Annu Rev Genet. 2014;48:215–36. doi: 10.1146/annurev-genet-120213-092314. - DOI - PubMed

MeSH terms