. 2017 Jan 9;45(1):81-91.
doi: 10.1093/nar/gkw813. Epub 2016 Sep 14.

Co-regulation of paralog genes in the three-dimensional chromatin architecture

Affiliations

Co-regulation of paralog genes in the three-dimensional chromatin architecture

Jonas Ibn-Salem et al. Nucleic Acids Res. .

Abstract

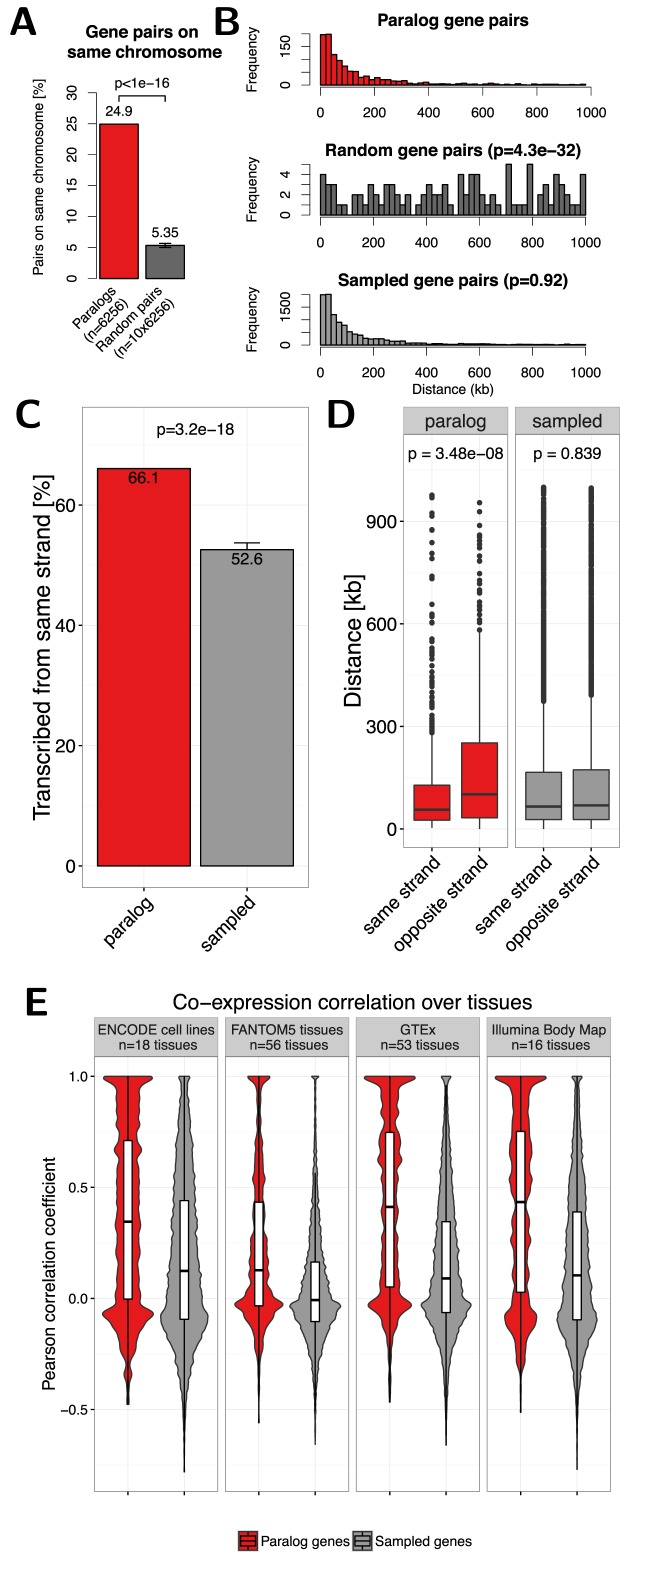
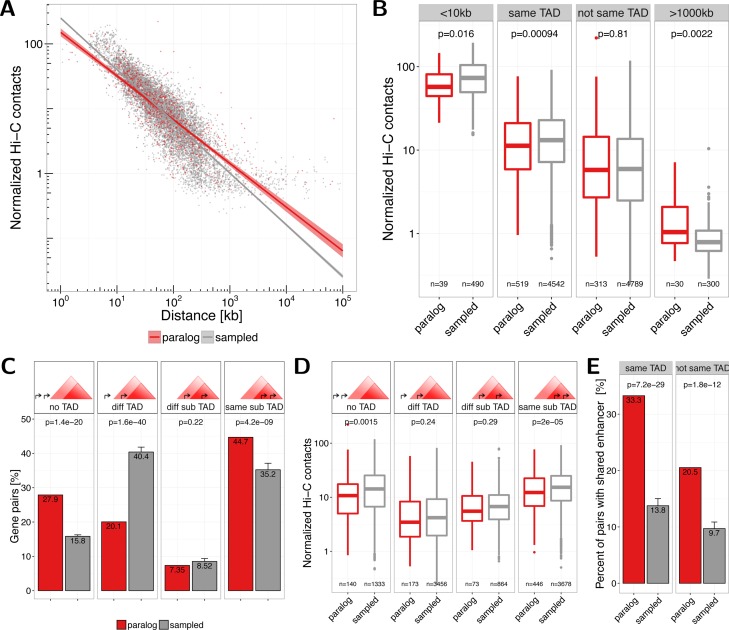
Paralog genes arise from gene duplication events during evolution, which often lead to similar proteins that cooperate in common pathways and in protein complexes. Consequently, paralogs show correlation in gene expression whereby the mechanisms of co-regulation remain unclear. In eukaryotes, genes are regulated in part by distal enhancer elements through looping interactions with gene promoters. These looping interactions can be measured by genome-wide chromatin conformation capture (Hi-C) experiments, which revealed self-interacting regions called topologically associating domains (TADs). We hypothesize that paralogs share common regulatory mechanisms to enable coordinated expression according to TADs. To test this hypothesis, we integrated paralogy annotations with human gene expression data in diverse tissues, genome-wide enhancer-promoter associations and Hi-C experiments in human, mouse and dog genomes. We show that paralog gene pairs are enriched for co-localization in the same TAD, share more often common enhancer elements than expected and have increased contact frequencies over large genomic distances. Combined, our results indicate that paralogs share common regulatory mechanisms and cluster not only in the linear genome but also in the three-dimensional chromatin architecture. This enables concerted expression of paralogs over diverse cell-types and indicate evolutionary constraints in functional genome organization.


Figures

Figure 1.
Figure 1.
(A) Percent of paralog (red) and random (dark gray) gene pairs that are located on the same chromosome. The error bar indicates the standard deviation observed in 10 times replicated random sampling of gene pairs. (B) Genomic distance distribution of paralog gene pairs (top), random gene pairs (center) and gene pairs sampled according to distance distribution of paralogs (bottom). Distances are measured in kilo base pairs (kb) between TSS of genes in pairs. P-values are calculated using Wilcoxon rank-sum test. (C) Percent of paralog (red) and sampled (gray) gene pairs that are transcribed from the same strand. Only pairs on the the same chromosome within 1 Mb are considered here. Error bars indicate the standard deviation observed in 10 times replicated sampling of gene pairs. (D) Boxplot of the genomic distance between paralogs and sampled gene pairs with the same or opposite strands. (E) Distribution of Pearson correlation coefficients of gene expression values in four independent datasets between paralog gene pairs (red) and sampled control gene pairs (gray). White boxes show 25th, 50th and 75th percent quantile of the data and the filled areas indicate the density distribution.
Figure 2.
Figure 2.
Shared enhancers among paralog gene pairs. (A) Percent of close paralog (red) and sampled control (gray) gene pairs with at least one shared enhancer. (B) Percent of gene pairs versus number of shared enhancers for paralog and sampled control gene pairs.
Figure 3.
Figure 3.
(A) Co-localization of close paralog genes within the same TAD compared against sampled gene pairs for TAD datasets from different cell types and studies. The first seven bars show values for TADs called in HeLa, HUVEC, K562, KBM7, NHEK, IMR90 and GM12878 cells by (13). The eighth bar shows the value for stable TADs across cell types form this study (at least 90% reciprocal overlap in 50% of cells). The last two bars show data for TADs called in hESC and IMR90 cells by (10). Error bars indicate standard deviation in 10 times replicated sampling of gene pairs. P-values are computed using Fisher's exact test. (B) Percent of gene pairs annotated to same A/B compartment according to Hi-C data in GM12878 cells from (13). Pairs located in the very same compartment interval were excluded. (C) Percent of gene pairs annotated to same sub compartment (A1, A2, B1, B2, B3, B4) according to (13). Pairs located in the same subcompartment interval were excluded. (D) Normalized Hi-C contact frequencies between TSSs of distal paralog gene pairs (n=30, median=1.04, average=1.86) and sampled background gene pairs (n=300, median=0.788, average=0.968). (E) Promoter capture-C contact frequencies between distal paralog gene pairs (n=6, median=15.5, average=16.2) and sampled background gene pairs (n=43, median=5, average=6.95).
Figure 4.
Figure 4.
(A) Normalized Hi-C contacts by genomic distance between paralog (red) and sampled (gray) gene pairs. Lines show linear regression fit separately for paralogs (red) and sampled (gray) pairs with 95% confidence intervals in shaded areas. (B) Normalized Hi-C contacts between pairs of paralogs (red) and sampled gene pairs (gray) for the groups: <10 kb genomic distance, located in the same TAD, not in the same TAD and with genomic distance >1000 kb. (C) Number of gene pairs located either in no TAD, in different TADs (or only one pair member in a TAD), both in a TAD but in different sub-TADs, or within the same sub-TAD, for paralogs (red) and sampled (gray) pairs. TADs from IMR90 cells from (13) were used, which nested in contrast to TAD calls from (10). (D) Normalized Hi-C contacts between pairs of paralogs (red) and sampled gene pairs (gray) for the four groups of pairs in sub-TAD structures shown in (C). (E) Percent of gene pairs with at least one shared enhancer for paralog genes (red) and sampled control genes (gray) separated for pairs in the same IMR90 TAD (left) or not (right).
Figure 5.
Figure 5.
(A) Co-occurrence of close paralog genes with the same TAD in mouse (left panel) and dog (right panel). (B) Hi-C contacts between promoter of distal gene pairs in Hi-C experiments in liver cells from mouse (left panel; n=66 and n=1005 for paralog and sampled gene pairs, respectively) and dog (right panel; n=21 and n=187 for paralog and sampled gene pairs, respectively). Hi-C data and TAD calls were taken from (14).
Figure 6.
Figure 6.
One-to-one orthologs of human paralog genes in mouse and dog genome. (A) Percent of mouse (left) and dog (right) orthologs of human paralog pairs that are in the same TAD in the mouse and dog genome, respectively. (B) Normalized Hi-C contacts between promoters of one-to-one orthologs of human distal paralogs in the mouse (left; n=21, median=8, average 16.0 for paralogs; n=379, median=4, average=5.39 for sampled) and dog (right; n=21, median=14, average=5.39 for paralogs; n=384, median=6, average=7.26 for sampled) genome. (C) Percent of gene pairs with conserved co-localization. Orthologs in the same TAD in mouse (left) and dog (right) as percent of all orthologs of human paralog pairs that are in the same TAD in human. For human TADs from IMR90 cells from (13) were used.

References

    1. Koonin E.V. Orthologs, paralogs, and evolutionary genomics. Annu. Rev. Genet. 2005;39:309–338. - PubMed
    1. Makova K.D., Li W.-H. Divergence in the spatial pattern of gene expression between human duplicate genes. Genome Res. 2003;13:1638–1645. - PMC - PubMed
    1. Ptashne M. Gene regulation by proteins acting nearby and at a distance. Nature. 1986;322:697–701. - PubMed
    1. Deng W., Lee J., Wang H., Miller J., Reik A., Gregory P.D., Dean A., Blobel G.A. Controlling long-range genomic interactions at a native locus by targeted tethering of a looping factor. Cell. 2012;149:1233–1244. - PMC - PubMed
    1. Carter D., Chakalova L., Osborne C.S., Dai Y.F., Fraser P. Long-range chromatin regulatory interactions in vivo. Nat. Genet. 2002;32:623–626. - PubMed

Publication types

LinkOut - more resources