. 2016 Nov 11;119(11):1190-1203.
doi: 10.1161/CIRCRESAHA.116.309764. Epub 2016 Sep 15.

Atherosclerosis-Driven Treg Plasticity Results in Formation of a Dysfunctional Subset of Plastic IFNγ+ Th1/Tregs

Affiliations

Atherosclerosis-Driven Treg Plasticity Results in Formation of a Dysfunctional Subset of Plastic IFNγ+ Th1/Tregs

Matthew J Butcher et al. Circ Res. .

Abstract

Rationale: Forkhead box P3+ T regulatory cells (Tregs) are key players in maintaining immune homeostasis. Evidence suggests that Tregs respond to environmental cues to permit or suppress inflammation. In atherosclerosis, Th1-driven inflammation affects Treg homeostasis, but the mechanisms governing this phenomenon are unclear.

Objective: Here, we address whether atherosclerosis impacts Treg plasticity and functionality in Apoe-/- mice, and what effect Treg plasticity might have on the pathology of atherosclerosis.

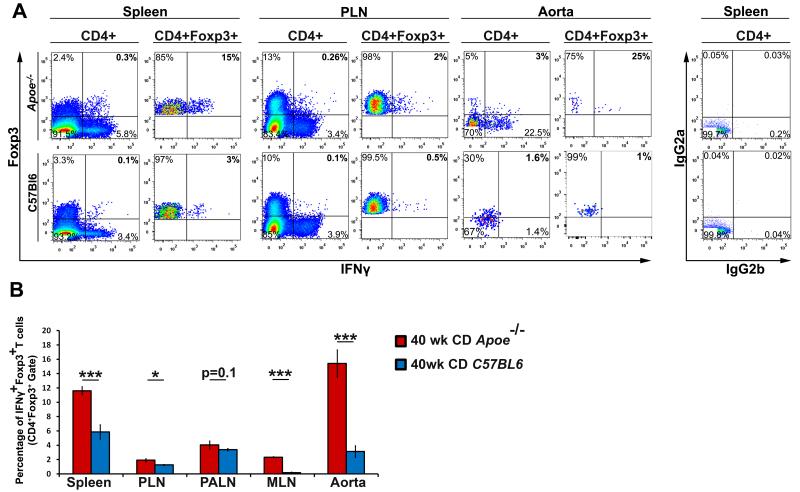
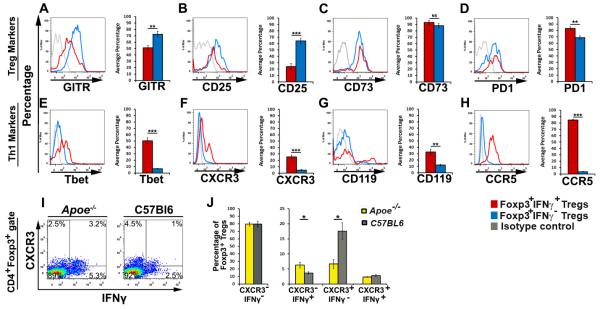
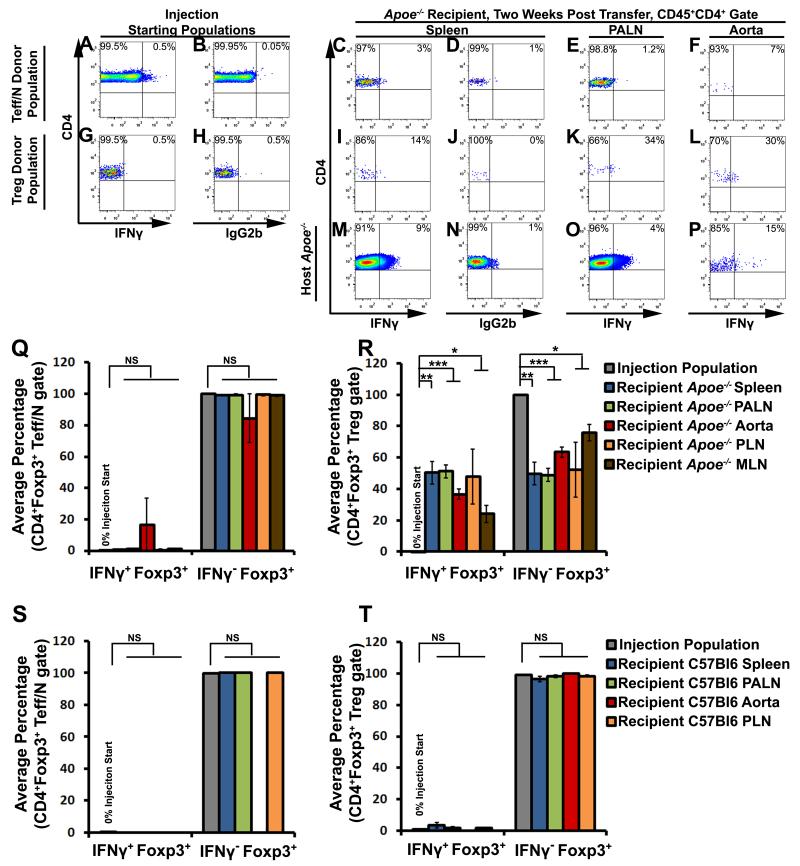
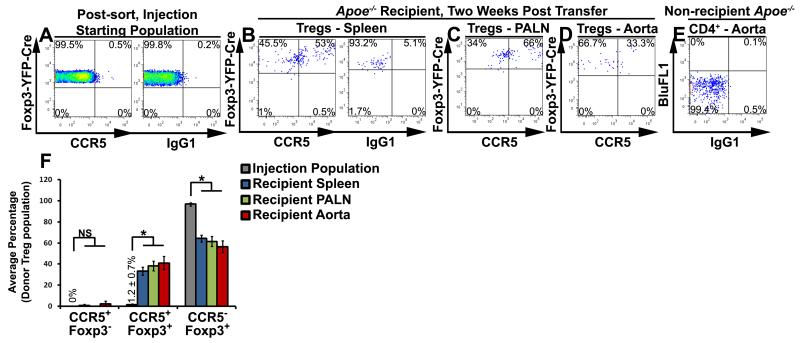
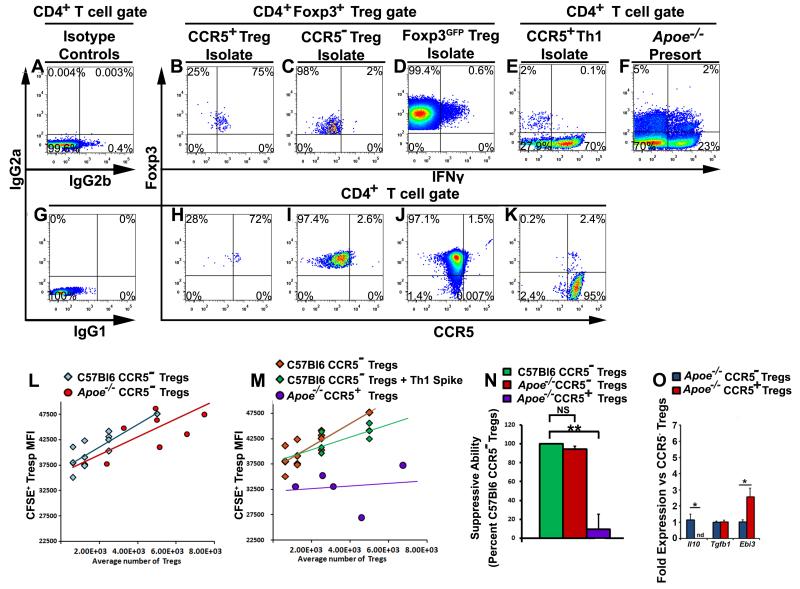
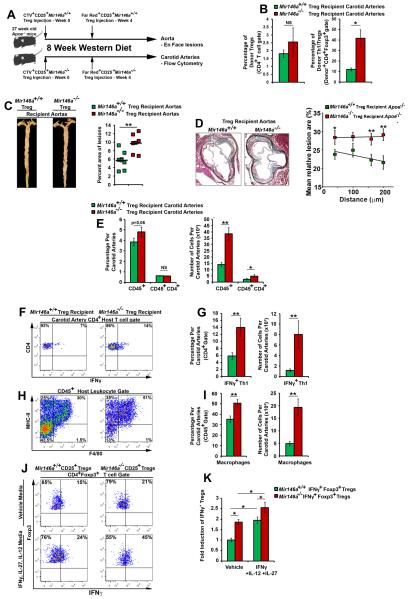
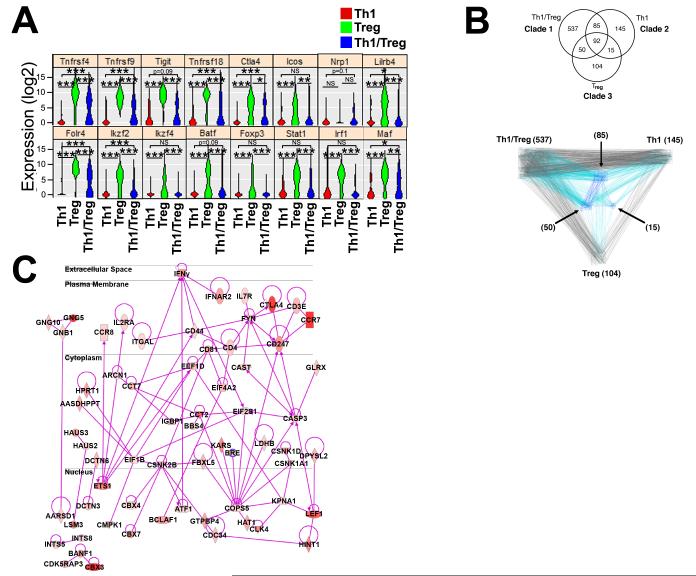
Methods and results: We demonstrate that atherosclerosis promotes Treg plasticity, resulting in the reduction of CXCR3+ Tregs and the accumulation of an intermediate Th1-like interferon (IFN)-γ+CCR5+ Treg subset (Th1/Tregs) within the aorta. Importantly, Th1/Tregs arise in atherosclerosis from bona fide Tregs, rather than from T-effector cells. We show that Th1/Tregs recovered from atherosclerotic mice are dysfunctional in suppression assays. Using an adoptive transfer system and plasticity-prone Mir146a-/- Tregs, we demonstrate that elevated IFNγ+ Mir146a-/- Th1/Tregs are unable to adequately reduce atherosclerosis, arterial Th1, or macrophage content within Apoe-/- mice, in comparison to Mir146a+/+ Tregs. Finally, via single-cell RNA-sequencing and real-time -polymerase chain reaction, we show that Th1/Tregs possess a unique transcriptional phenotype characterized by coexpression of Treg and Th1 lineage genes and a downregulation of Treg-related genes, including Ikzf2, Ikzf4, Tigit, Lilrb4, and Il10. In addition, an ingenuity pathway analysis further implicates IFNγ, IFNα, interleukin-2, interleukin-7, CTLA-4 (cytotoxic T-lymphocyte-associated protein 4), T-cell receptor, and Csnk2b-related pathways in regulating Treg plasticity.

Conclusions: Atherosclerosis drives Treg plasticity, resulting in the accumulation of dysfunctional IFNγ+ Th1/Tregs that may permit further arterial inflammation and atherogenesis.

Keywords: Treg cells; atherosclerosis; cell plasticity; immune system; immunology; inflammation; lymphocytes.


Figures

Figure 1
Figure 1. INγ-producing Foxp3+ peripheral Tregs are present and systemically elevated within atherosclerotic Apoe−/− mice
Forty week old Apoe−/− and C57Bl6 splenic, PLN, PALN, MLN, and aortic cell suspensions were prepared and stained for ICS. (A) Representative flow cytometry plots and isotype controls for the spleen, PLN, and two pooled aortas of Apoe−/− and C57Bl6 mice are shown. All plots are gated on CD45+CD4+ T cells or CD45+CD4+Foxp3+ Tregs and the numbers in each quadrant indicate percentage. (B) The average percentage of IFNγ+ Tregs within Apoe−/− and C57Bl6 organs. n=12 mice/genotype, four independent experiments. The means±SEM are shown. ***-p<0.001, **-p<0.01, *-p<0.05, unpaired student’s T test.
Figure 2
Figure 2. Elevated IFNγ+ Th1/Tregs express heterogeneous levels of Treg and Th1 lineage markers in atherosclerotic Apoe−/− mice
Forty week old Apoe−/− spleens (shown), PALNs, and aortas (not shown) were isolated and re-stimulated for ICS. CD45+CD4+Foxp3+ Tregs were gated and IFNγ+Foxp3+ (red histograms) and IFNγ Foxp3+ (blue histograms) subgates were examined for the expression of the Treg markers GITR (A), CD25 (B), CD73 (C), and PD1 (D), and the Th1 markers Tbet (E), CXCR3 (F), CD119 (G), and CCR5 (H). All gates were set using isotype controls (gray histogram) and the percentages of positive cells are shown (means±SEM). (I-J) Aged Apoe−/− and C57Bl6 spleens (shown), PALNs, and aortas (not shown) were re-stimulated for ICS. CD45+CD4+Foxp3+ Tregs were gated and examined for IFNγ and CXCR3 expression. (J) The percentages of IFNγ and CXCR3 subsets amongst Foxp3+ Tregs from aged Apoe−/− and C57Bl6 spleens. The means±SEM are shown. n=8 mice, 4 independent experiments. ***-p<0.001, **-p<0.01, *-p<0.05, unpaired student’s T test.
Figure 3
Figure 3. IFNγ+ Th1/Tregs arise from bona fide Foxp3+ Tregs, rather than naïve or effector memory T cells, in atherosclerotic Apoe−/− mice
Foxp3eGFP+CD4+ Tregs and Foxp3CD4+ T effector/naïve cells (Teff/N) were sorted from eight-twenty week old Foxp3eGFP mice. Purified Tregs and Teff/N cells were separately labeled with cell trace violet or CFSE, mixed, and co-injected into aged Apoe−/− recipients. Two weeks post-transfer, the recipients were examined for the presence of IFNγ+ Tregs by ICS. (A,B,G,H) Representative CD4+ gated IFNγ and isotype control staining in the Teff/N (A,B) and Treg (G,H) donor populations, at the time of injection. (C-P) CD4-gated representative Foxp3 and IFNγ staining in the donor Teff/N (C-F), donor Treg (I-L), and the endogenous CD4+ Apoe−/− T cell (M-P) populations, based on population-specific isotype controls (D,J,N). (Q,R) The percentage of transferred Teff/N (Q) or Tregs (R) that converted to IFNγ+Foxp3+ or IFNγFoxp3+ Tregs in the spleen (blue), PALNs (green), aorta (red), PLNs (orange), or MLNs (brown) of recipient Apoe−/− mice (n=5), in comparison to the starting population (five independent experiments). Bars indicate the population means±SEM. (S,T) Analogous adoptive Foxp3CD4+ Teff/naïve and Foxp3eGFP Treg transfers to 40 week old C57Bl6 recipient mice, as in (A-R). Percentage of IFNγ+Foxp3+ and IFNγFoxp3+ T cells within the donor Teff/N (S) or Treg (T) starting populations (gray), and recipient C57Bl6 spleens (blue), PALNs (green), aortas (red), and PLNs (orange) by ICS. n=3 recipients, three independent experiments. ***-p<0.001, **-p<0.01, *-p<0.05, Bonferroni-holm multiple comparison-corrected unpaired student’s T tests.
Figure 4
Figure 4. Adoptively transferred Tregs maintain stable Foxp3+ expression and assume a CCR5+ Th1/Treg or a CCR5 Treg phenotype in atherosclerotic Apoe−/− mice
Foxp3Yfp-cre/Yfp-creR26RtdTomato/tdTomato splenic CD4+ T cells were isolated from 8-20 week old mice and sorted for Foxp3yfp-cre+R26RtdTomato+ Tregs. Purified YFP-Cre+tdTomato+ Tregs were labeled with cell trace violet and injected into aged Apoe−/− recipients. Two weeks post-transfer, the recipients were harvested and examined for the presence of CCR5+ Th1/Tregs by flow cytometry. (A) Representative CCR5 and isotype control staining in the injection starting population. (B-E) Representative CCR5 staining in the recipient spleens (B), PALNs (C), and aorta (D), within the gated CTV+CD4+ donor cell population. (E) Isotype staining in a non-recipient Apoe−/− aorta. (F) The average percentage of transferred Tregs that assumed a CCR5+Foxp3, CCR5+Foxp3+, or CCR5Foxp3+ phenotype within the injection population (grey), recipient Apoe−/− spleen (blue), PALNs (green), and aorta (red). n=3 recipients, three independent experiments. ***-p<0.001, **-p<0.01, *-p<0.05, NS–not significant, Bonferroni-holm multiple comparison-corrected unpaired student’s T tests.
Figure 5
Figure 5. CCR5+ Th1/Tregs isolated from aged Apoe−/− mice are non-suppressive, ex vivo
Splenic CD4+ T cells were isolated from aged Apoe−/−, Foxp3eGFP, or Foxp3Yfp-cre/Yfp-creR26RtdTomato/tdTomato Apoe−/− and Foxp3Yfp-cre/Yfp-creR26RtdTomato/tdTomato C57Bl6 mice and the following subsets were purified for T cell suppression assays: CCR5 Tregs, CCR5+ Th1/Tregs, Foxp3eGFP+ Tregs, CCR5+ Th1, CD4+Foxp3 CFSE-labeled T responders (Tresp), and CD4-depleted splenocytes (APCs). (A-K) Representative IFNγ, Foxp3, CCR5, or isotype control staining. Isotype controls for IFNγ (A), and CCR5 (G). IFNγ staining within CD4+Foxp3+-gated Apoe−/− CCR5+ Th1/Treg (B), CCR5 Treg (C), C57Bl6 Foxp3GFP+ Treg (D), Apoe−/− CCR5+ Th1 (E) post sort isolates, and the CD4+ Apoe−/− pre-sort population (F). (H-K) Representative CCR5 staining for CCR5+ Th1/Treg (H), CCR5 Treg (I), C57Bl6 Foxp3GFP+ Treg (J), and CCR5+ Th1 (K) post sort isolates. (L,M,N) T cell suppression assay results. Comparison of (L) Apoe−/− and C57Bl6 CCR5 Tregs, (M) C57Bl6 CCR5 Tregs, C57Bl6 CCR5 Tregs spiked with Apoe−/− Th1 cells, and Apoe−/− CCR5+ Th1/Tregs in the suppression assays. (N) The mean suppressive ability of Apoe−/− CCR5 Tregs and Apoe−/− CCR5+ Th1/Tregs as a percentage of C57Bl6 CCR5 Treg suppression (n=6 independent experiments). (O) Sorted CD4+Foxp3+CCR5+ Tregs (Treg/Th1) and CD4+Foxp3+CCR5 Treg cells from aged 40 week-old chow diet Foxp3Yfp-cre/Yfp-CreR26RtdTomato/tdTomatoApoe−/− mice were processed for Il10, Tgfβ, and Ebi3 expression (n=4/ per cell type). The mean±SEM is shown. **-p<0.01, NS–not significant, Bonferroni-holm-corrected unpaired student’s T tests.
Figure 6
Figure 6. Th1/Treg-prone Mir146a−/− Tregs fail to reduce atherosclerosis and arterial inflammation in Apoe−/− mice
(A) Experimental design. 27 week-old Apoe−/− littermates received 1×10⁶ CTV-labeled Mir146a−/− or Mir146a+/+ Tregs and were subsequently placed on a WD regimen for 8 weeks (n= 5 male- and 3-4 female- Apoe−/− recipients/cohort). On week 4, both cohorts received an additional boost of 1×10⁶ FarRed+ Mir146a+/+ or Mir146a−/− Tregs. Eight weeks later, the aortas, carotid arteries, lymphoid organs, and blood were collected. (B) Percentage of donor and IFNγ+ Mir146a+/+ and Mir146a−/− Tregs within 2-3 concatenated recipient Apoe−/− carotids (n=3 concatenated samples/genotype). (C) Representative Mir146a+/+ (Green squares) and Mir146a−/− (Red squares) Treg recipient Apoe−/− Oil Red O staining and lesion percentage of the aorta. (D) Representative MOVAT staining and the percentage of aortic root lesions in Mir146a+/+ and Mir146a−/− Treg recipient mice. (E-I) Representative flow cytometry results for the Treg recipient Apoe−/− carotid arteries. (E) The percentage and number of CD45+ leukocytes and CD45+CD4+ T cells within the Apoe−/− recipient carotid artery (two carotid arteries/recipient). (F, G) Representative host CD4+ T cell IFNγ FACS staining and quantification within the Apoe−/− Treg recipient carotids. (H, I) Carotid artery F4/80+MHC-II+ macrophage representative flow cytometry staining and quantification within the Apoe−/− recipients (n= 7-8 Apoe−/− recipients/Treg population, three independent experiments. (J, K) Mir146a−/− Tregs readily undergo plasticity in response to IL-27, IL-12, and IFNγ. CD25+ Mir146a+/+ and Mir146a−/− Tregs were isolated and cultured in complete RPMI1640 with CD3/CD28 antibodies, and IL-2 (50ng/ml, Vehicle), or IL-2, IL-12 (25ng/ml), IL-27 (25ng/ml), and IFNγ (25ng/ml) for 4 days and assessed for IFNγ+Foxp3+ Tregs Representative flow cytometry plots, (J) fold induction of IFNγ+ Tregs vs the Mir146a+/+ Treg vehicle controls. n = 3 independent experiments. The mean±SEM is shown. *-p<0.05, **-p<0.01, NS-Not significant, unpaired, one-tailed Bonferroni-Holm-corrected student’s T tests.
Figure 7
Figure 7. scRNA-seq reveals down-regulation of multiple Treg immunosuppressive genes within plastic Th1/Tregs
Sorted 40 week old Apoe−/− splenic CD4+CD73+PD1+CD25+CCR5+ T cells were used to create single cell libraries for Fluidigm C1-based SMARTer RNA-Seq (Supplemental Fig. 3, n=3-4 mice/experiment, 6 experiments, 270 single T cell libraries). The sequenced, processed single T cell libraries were hierarchically clustered into Th1 (red, n=83), Treg (green, n=21), and Th1/Treg (blue, n=72) cells and analyzed for differential gene expression. (A) Select significantly different violin plots are shown for each subset. (B-C) Summary of the IPA-based re-sorting and clustering. (B) A Venn diagram of genes with an expression level above 100 reads, and IPA generated connectivity among the categories of unique and shared genes for clades 1-3. (C) The 537 genes uniquely expressed by clade 1 were used to generate a predicted network that is highly expressed in Th1/Tregs. The average expression levels among a representative set of clade 1 cells is overlaid, with the intensity of red showing denoting higher FPKM counts. ***-p<0.001, **-p<0.01, *-p<0.05, NS–not significant, Tukey ANOVA post-hoc tests.

Comment in

References

    1. Libby P, Lichtman AH, Hansson GK. Immune Effector Mechanisms Implicated in Atherosclerosis: From Mice to Humans. Immunity. 2013;38:1092–104. - PMC - PubMed
    1. Galkina E, Ley K. Immune and inflammatory mechanisms of atherosclerosis (*) Annu Rev Immunol. 2009;27:165–97. - PMC - PubMed
    1. Ait-Oufella H, Salomon BL, Potteaux S, et al. Natural regulatory T cells control the development of atherosclerosis in mice. Nat Med. 2006;12:178–80. - PubMed
    1. Klingenberg R, Gerdes N, Badeau RM, et al. Depletion of FOXP3+ regulatory T cells promotes hypercholesterolemia and atherosclerosis. J Clin Invest. 2013;123:1323–34. - PMC - PubMed
    1. Cheng X, Yu X, Ding YJ, Fu QQ, Xie JJ, Tang TT, Yao R, Chen Y, Liao YH. The Th17/Treg imbalance in patients with acute coronary syndrome. Clin Immunol. 2008;127:89–97. - PubMed

Substances