. 2016:2016:1384523.
doi: 10.1155/2016/1384523. Epub 2016 Aug 18.

S-Nitrosylation Proteome Profile of Peripheral Blood Mononuclear Cells in Human Heart Failure

Affiliations

S-Nitrosylation Proteome Profile of Peripheral Blood Mononuclear Cells in Human Heart Failure

Sue-Jie Koo et al. Int J Proteomics. 2016.

Abstract

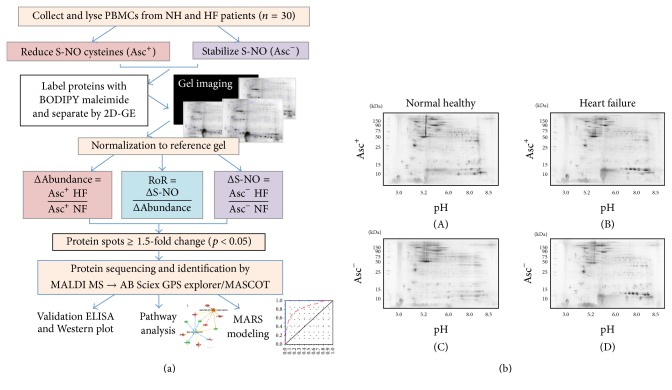
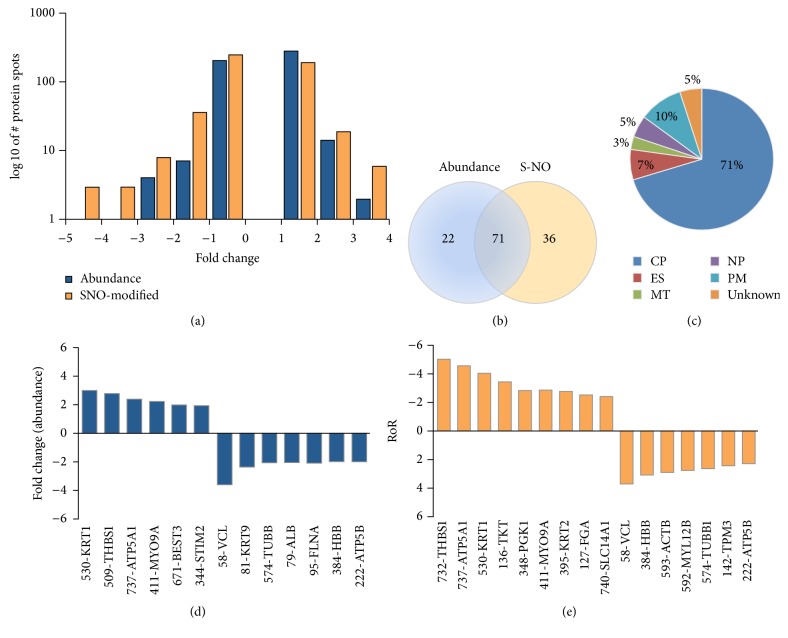
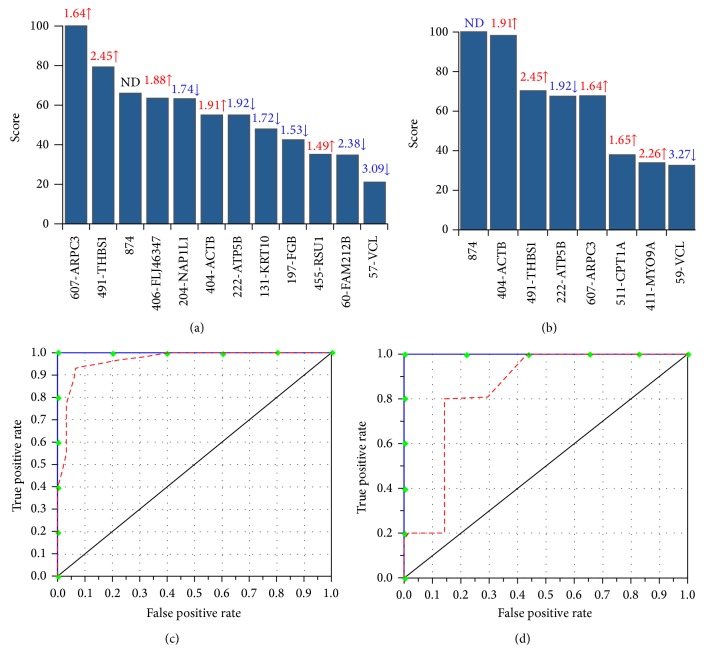
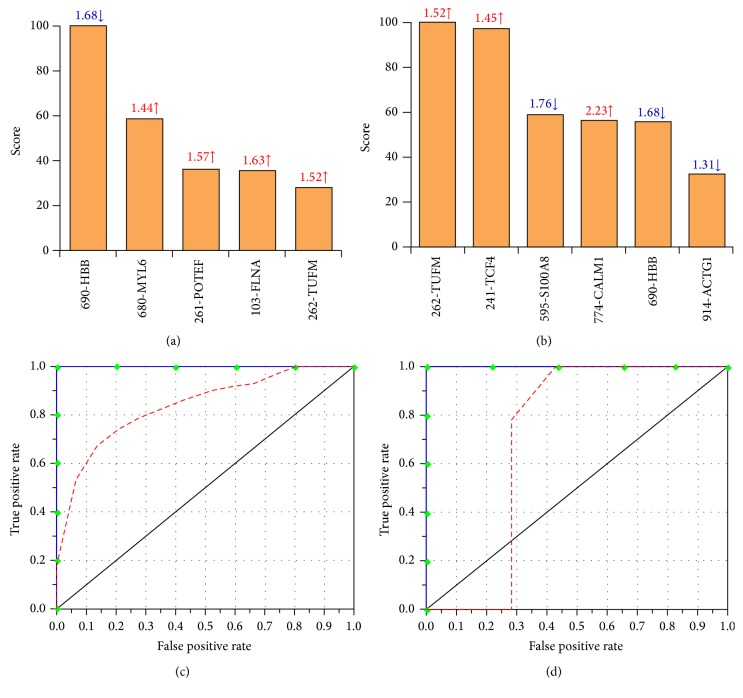
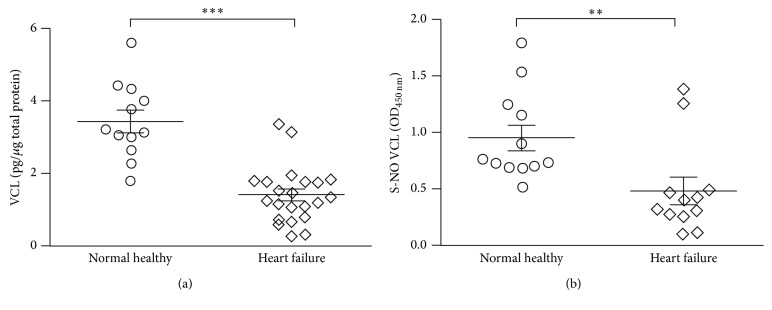
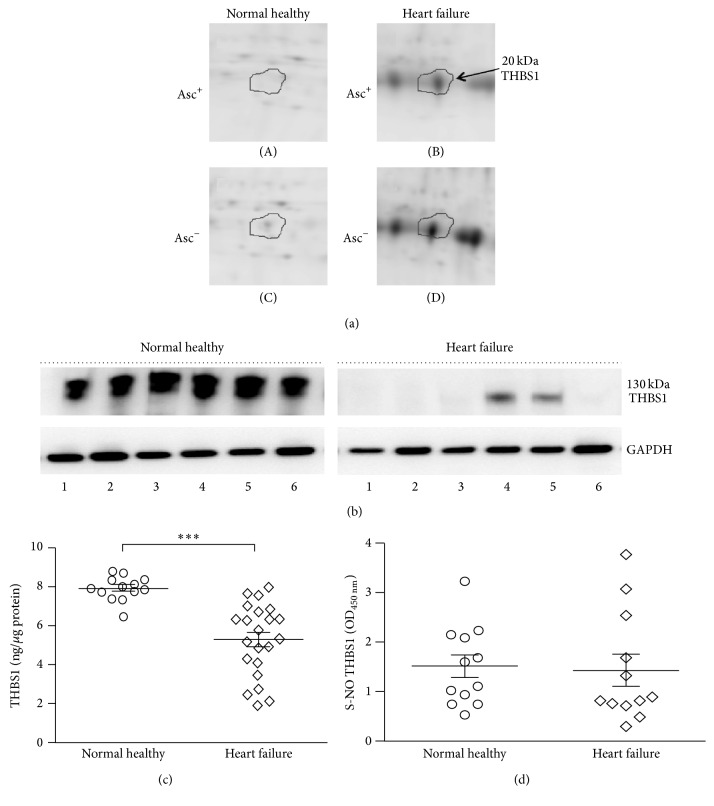
Nitric oxide (NO) protects the heart against ischemic injury; however, NO- and superoxide-dependent S-nitrosylation (S-NO) of cysteines can affect function of target proteins and play a role in disease outcome. We employed 2D-GE with thiol-labeling FL-maleimide dye and MALDI-TOF MS/MS to capture the quantitative changes in abundance and S-NO proteome of HF patients (versus healthy controls, n = 30/group). We identified 93 differentially abundant (59-increased/34-decreased) and 111 S-NO-modified (63-increased/48-decreased) protein spots, respectively, in HF subjects (versus controls, fold-change | ≥1.5|, p ≤ 0.05). Ingenuity pathway analysis of proteome datasets suggested that the pathways involved in phagocytes' migration, free radical production, and cell death were activated and fatty acid metabolism was decreased in HF subjects. Multivariate adaptive regression splines modeling of datasets identified a panel of proteins that will provide >90% prediction success in classifying HF subjects. Proteomic profiling identified ATP-synthase, thrombospondin-1 (THBS1), and vinculin (VCL) as top differentially abundant and S-NO-modified proteins, and these proteins were verified by Western blotting and ELISA in different set of HF subjects. We conclude that differential abundance and S-NO modification of proteins serve as a mechanism in regulating cell viability and free radical production, and THBS1 and VCL evaluation will potentially be useful in the prediction of heart failure.


Figures

Figure 1
Figure 1
(a) Schematic work flow. PBMCs were obtained from heart failure subjects (HF, n = 30) and normal healthy (NH, n = 30) subjects. Each sample was divided into two fractions, and S-NO cysteines were reduced with ascorbate (Asc+) in one fraction and stabilized with neocuproine in 2nd fraction (Asc). All fractions were labeled with BODIPY FL N-(2-aminoethyl) maleimide (binding to reduced cysteine) and resolved by 2-dimensional gel electrophoresis. Gel images were normalized against a reference gel. Ratiometric calculation of differential protein abundance from BODIPY-fluorescence units in Asc+ aliquots (normal versus experimental) was calculated for all the protein spots (Δprotein abundance = Asc+ HF/Asc+ NH). The S-NO modification levels were quantified by calculation of the ratio of fluorescence units from Asc aliquots (ΔS-NO = Asc HF/Asc NH). The ratio of ratios (RoR), that is, ΔS-NO/Δprotein abundance = [Asc HF/Asc NH]/[Asc+ HF/Asc+ NH], was calculated to obtain the change in S-NO levels normalized for protein abundance. The fold changes in abundance and S-NO-modification of the protein spots in all gels were log transformed and subjected to statistical analysis as described in Materials and Methods. Protein spots that changed in abundance or S-NO modification by |≥1.5-fold| at p < 0.05 were submitted to mass spectrometry analysis for protein identification. The protein datasets were analyzed by ingenuity pathway analysis and MARS modeling, and selected proteins were confirmed for differential abundance and S-NO modification levels by multiple assays. (b) Two-dimensional gel images of protein spots in PBMCs of heart failure (HF) subjects and normal healthy controls. BD-labeled PBMC lysates were separated in the 1st-dimension by isoelectric focusing on 11 cm nonlinear pH 3–11 immobilized pH gradient strips and in the 2nd-dimension by sodium dodecyl sulfate polyacrylamide gel electrophoresis (SDS-PAGE) on an 8–16% gradient gel. Gel images were obtained at 100 µm resolution using the Typhoon Trio Variable Mode Imager (GE Healthcare) to quantify BD-labeled proteins (Ex488 nm/Em520±15 nm). Shown are representative gel images of Asc+ ((A) and (B)) and Asc ((C) and (D)) PBMCs from NH ((A) and (C)) controls and HF ((B) and (D)) subjects and approximate size (vertical) and pI (horizontal) ranges.
Figure 2
Figure 2
Identification of differentially abundant and S-NO-modified protein spots in PBMCs of HF subjects. Protein spots that exhibited significant change in abundance or S-NO-modification in HF subjects with respect to NH controls (p < 0.05) are marked on the reference gel and were submitted for protein identification by MALDI-TOF MS analysis (listed in Table 1).
Figure 3
Figure 3
(a) Frequency of changes in abundance of protein spots in HF subjects. Shown is the frequency of protein spots that were changed in abundance or S-NO modification in HF subjects with respect to normal controls (p < 0.05). (b) Venn diagram. Shown is the number of protein spots that were increased in abundance and/or S-NO modification levels in HF subjects. (c) Classification of differentially expressed proteins from the proteomic analysis. Ontological classification of differentially regulated proteins in terms of cellular localization was performed by ingenuity pathway analysis. The compositions of the protein categories are presented as percentages of all individually identified proteins. CP: cytoplasmic, ES: extracellular/secreted, MT: mitochondrial, NP: nucleoplasm, PM: plasma membrane. ((d) and (e)) Fold change in abundance (d) and S-NO modification (e) of top molecules identified to be of relevance in HF subjects. Ratio of ratio (RoR) is defined in legend of Figure 2. A negative RoR indicates increased S-NO modification, while a positive RoR indicates increased reduction of protein thiols.
Figure 4
Figure 4
MARS analysis of differentially abundant protein spots in HF subjects. Inputs to the model were protein spots that were differentially abundant at p < 0.05 with B-H correction in HF (31 spots, n = 30) subjects with respect to NH controls (n = 30). We employed 10-fold cross-validation ((a) and (c)) and 80% testing/20% training ((c) and (d)) approaches to assess the fit of the model for testing dataset. Shown are the protein spots identified with high ranking (score >20) by CV (a) and 80/20 (b) approaches for creating the MARS model for classifying HF from NH subjects. Protein spots in panels (a) and (b) are identified as spot number-protein name, and fold changes (increase ↑, red; decrease ↓, blue) are plotted. The ROC curves show the prediction success of the CV (c) and 80/20 (d) models. Blue curves: training data (AUC/ROC: 1.00), red curve: testing data (AUC/ROC: 0.97 for CV and 0.857 for 80/20).
Figure 5
Figure 5
MARS analysis of differentially S-NO modified protein spots in HF subjects. Inputs to the model were protein spots that were differentially S-NO modified at p < 0.05 with B-H correction in HF (42 spots, n = 30) subjects with respect to NH controls (n = 30). We employed 10-fold cross-validation ((a) and (c)) and 80% testing/20% training ((c) and (d)) approaches to assess the fit of the model for testing dataset. Shown are the protein spots identified with high ranking (score >20) by CV (a) and 80/20 (b) approaches for creating the MARS model for classifying HF subjects from NH controls. Protein spots in panels (a) and (b) are identified as spot #-protein name, and RoR values (increase ↑, red; decrease ↓, blue) are plotted. The ROC curves show the prediction success of the CV (c) and 80/20 models (d). Blue curves: training data ((AUC/ROC: 1.00); red curve: testing data (AUC/ROC: 0.85 for CV and 0.714 for 80/20).
Figure 6
Figure 6
Validation of expression profile of vinculin (VCL) in HF subjects. PBMC protein lysates (5 µg) from NH controls (n = 12) and HF subjects (n = 22) were subjected to sandwich and biotin-switch ELISA, respectively, for the detection of VCL (a) and SNO-modified VCL (b) levels. Mann Whitney U test was performed to evaluate the significance (∗∗ p < 0.01, ∗∗∗ p < 0.001).
Figure 7
Figure 7
Validation of expression profile of thrombospondin 1 (THBS1) in HF subjects. (a) The expanded view of the corresponding spot for THBS1 peptides (20 kDa) from representative 2D gel images of Asc+ ((A) and (B)) and Asc ((C) and (D)) PBMCs from NH controls ((A) and (C)) and HF ((B) and (D)) subjects is shown. (b) PBMC lysates (5 µg) of NH controls (n = 6) and HF subjects (n = 6) were subjected to Western blotting for the detection of THBS1 levels. GAPDH in (b) is shown as loading control. (c) ELISA was performed on 5 µg of PBMC lysates for the detection of THBS1 abundance (NH n = 13, HF n = 22) and S-NO modification status (NH n = 12 and HF n = 12). Mann Whitney U test was performed to evaluate the significance ∗∗∗ p < 0.001. (d) Shown are the SNO-modified THBS1 levels in PBMC lysates of NH and HF subjects, determined by a biotin-switch ELISA.

References

    1. Alwan A. Global Status Report on Noncommunicable Diseases. Geneva, Switzerland: World Health Organization, WHO Press; 2011. http://www.who.int/nmh/publications/ncd_report_full_en.pdf.
    1. World Health Organization. Chagas Disease: Control and Elimination. Report of the Secretariat. Geneva, Switzerland: UNDP/World Bank/WHO; 2010. http://apps.who.int/gb/ebwha/pdf_files/WHA63/A63_17-en.pdf.
    1. Gopal D. M., Sam F. New and emerging biomarkers in left ventricular systolic dysfunction—insight into dilated cardiomyopathy. Journal of Cardiovascular Translational Research. 2013;6(4):516–527. doi: 10.1007/s12265-013-9462-3. - DOI - PMC - PubMed
    1. Schulz R., Kelm M., Heusch G. Nitric oxide in myocardial ischemia/reperfusion injury. Cardiovascular Research. 2004;61(3):402–413. doi: 10.1016/j.cardiores.2003.09.019. - DOI - PubMed
    1. Lima B., Lam G. K. W., Xie L., et al. Endogenous S-nitrosothiols protect against myocardial injury. Proceedings of the National Academy of Sciences of the United States of America. 2009;106(15):6297–6302. doi: 10.1073/pnas.0901043106. - DOI - PMC - PubMed

LinkOut - more resources