. 2016 Sep 15;63(6):1006-20.
doi: 10.1016/j.molcel.2016.08.014.

PHD3 Loss in Cancer Enables Metabolic Reliance on Fatty Acid Oxidation via Deactivation of ACC2

Affiliations

PHD3 Loss in Cancer Enables Metabolic Reliance on Fatty Acid Oxidation via Deactivation of ACC2

Natalie J German et al. Mol Cell. .

Abstract

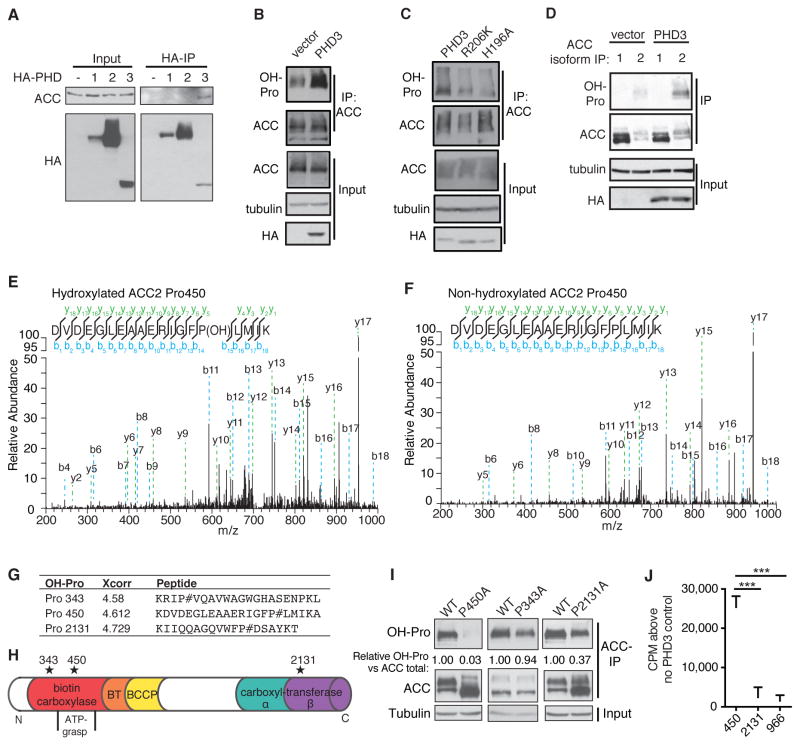
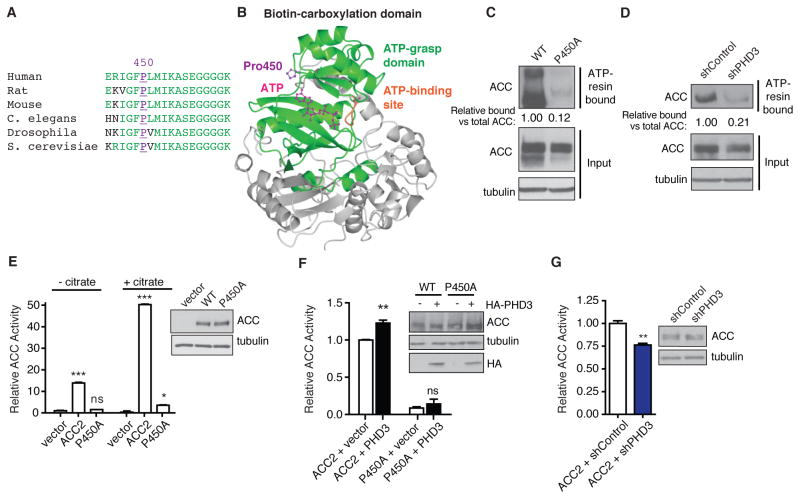
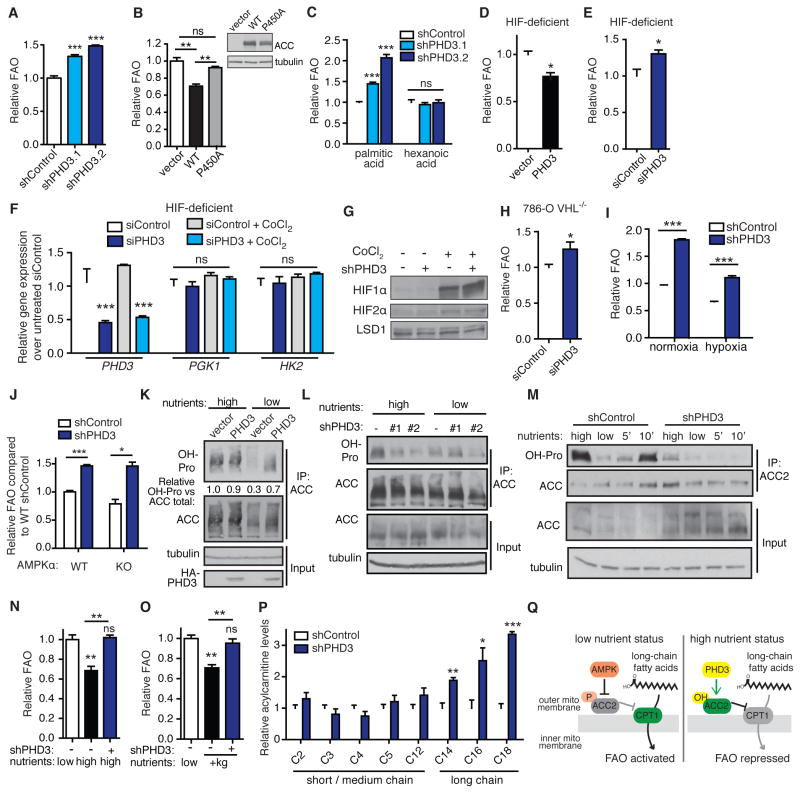
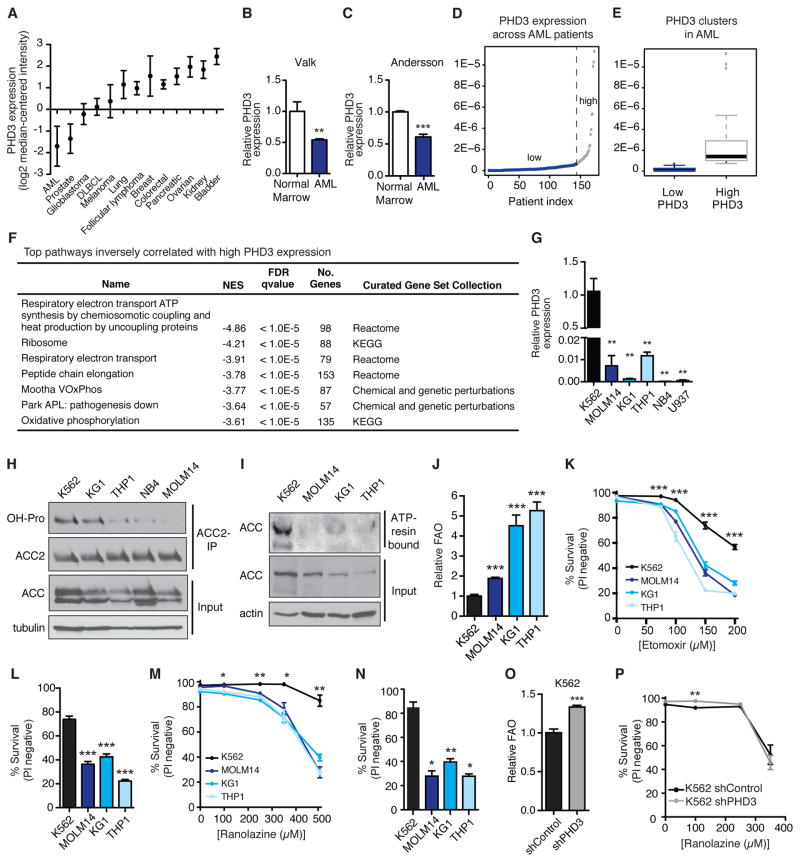
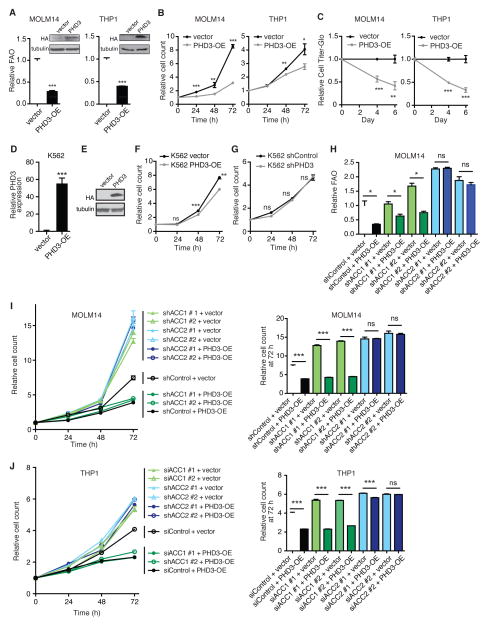
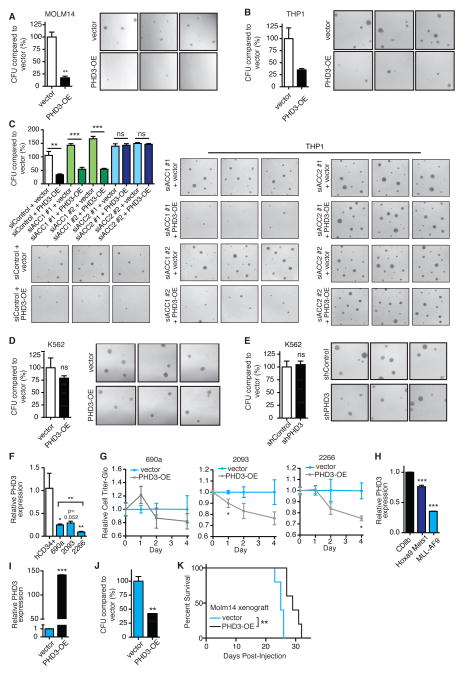
While much research has examined the use of glucose and glutamine by tumor cells, many cancers instead prefer to metabolize fats. Despite the pervasiveness of this phenotype, knowledge of pathways that drive fatty acid oxidation (FAO) in cancer is limited. Prolyl hydroxylase domain proteins hydroxylate substrate proline residues and have been linked to fuel switching. Here, we reveal that PHD3 rapidly triggers repression of FAO in response to nutrient abundance via hydroxylation of acetyl-coA carboxylase 2 (ACC2). We find that PHD3 expression is strongly decreased in subsets of cancer including acute myeloid leukemia (AML) and is linked to a reliance on fat catabolism regardless of external nutrient cues. Overexpressing PHD3 limits FAO via regulation of ACC2 and consequently impedes leukemia cell proliferation. Thus, loss of PHD3 enables greater utilization of fatty acids but may also serve as a metabolic and therapeutic liability by indicating cancer cell susceptibility to FAO inhibition.


Figures

Figure 1
Figure 1. ACC interacts with PHD3 and is modified by hydroxylation at Pro450
(A) HA-tagged PHD1-3 or empty vector was transfected into 293T cells and immunoprecipitated with HA affinity resin. ACC co-immunoprecipitated with PHD3, as detected by immunoblot. (B–C) Immunoblot to detect ACC hydroxylation. ACC was immunoprecipitated from 293T cells overexpressing HA-PHD3, vector, or catalytically inactive PHD3 mutants (R206K and H196A). Cells had been treated in serum-free, low glucose medium for 12 h prior to immunoprecipitation (IP). WT PHD3 increased hydroxylation, as detected by immunoblot with hydroxyproline (OH-Pro) antibody. (D) Immunoblot to measure hydroxylation of ACC1 versus ACC2 in 293T cells overexpressing vector or PHD3. ACC1 and ACC2 were immunoprecipitated using isoform-specific antibodies. Cells were treated 12 h with serum-free, low glucose medium prior to IP. (E–F) Representative mass spectra identifying the hydroxylated and non-hydroxylated versions of residue P450 in ACC2 peptides. ‘b’ fragments (blue) contain the N-terminal amino acid and are labeled from the N to C terminus. ‘y’ fragments (green) contain the C-terminal amino acid and are labeled from the C to N terminus. (G–H) Hydroxyproline residues and locations in ACC2 domains. ACC2 was overexpressed in 293T cells and immunoprecipitated with ACC antibody. Hydroxylation sites were identified using LC-MS2. BT = biotin transferase domain. BCCP = biotin carboxyl carrier protein. Xcorr = cross correlation score. (I) Hydroxylation of transiently overexpressed WT ACC2 versus proline to alanine point mutants. Relative hydroxyproline were quantified using ImageJ software. (J) In vitro hydroxylation assay. ACC2 peptides (12.5 nmol) with the indicated proline residue were incubated in reactions containing 0.02 μmol [1-14C]α-ketoglutarate and 1.2 μg recombinant PHD3. [14C]CO2 formed upon hydroxylation was captured on Whatman paper inside capped vials and analyzed by scintillation counting (n = 2). ***p < 0.001. Data represent mean ± SEM. See also Table S1.
Figure 2
Figure 2. Hydroxylation at site P450 promotes ACC2 activity and ATP binding
(A) Residue P450 (purple) in ACC2 is conserved in the ATP grasp domain throughout species. Alignment shows the ACC2 isoform in human, rat and mouse, and ACC in C. elegans, drosophila and S. cerevisiae, organisms lacking distinct ACC isoforms. Other conserved residues are in green. (B) P450 (purple) is located in the ACC2 ATP-grasp domain (green) adjacent to the catalytic site ATP (magenta). ATP is capped at the phosphate end by the known nucleotide binding residues (orange). This model was generated by superposition of human ACC2 biotin carboxylase domain (PDB: 3JRW) with e. coli ATP-bound ACC biotin carboxylase domain (PDB: 1DV2). (C) ATP-affinity of overexpressed WT versus P450A ACC2. ATP-binding was assessed by IP with ATP-affinity resin (Jena Bioscience) and immunoblot with ACC antibody. Relative levels were quantified by ImageJ. (D) ATP-affinity assay of transiently overexpressed ACC2 from 293T cells stably expressing shRNA against PHD3 or non-targeting control. Bound ACC2 was analyzed by immunoblot and quantified by ImageJ. (E) ACC activity in cells overexpressing vector, WT ACC2 or P450A mutant (n = 3). 10 μg ACC2 plasmid was overexpressed. Reactions (50 μg protein lysate) were performed ± 2 mM citrate. Immunoblots show loading controls. (F) ACC activity in cells co-overexpressing ACC2 or P450A and HA-PHD3 or empty vector (n = 4). 10 μg HA-PHD3 or vector was overexpressed plus 2 μg ACC2 plasmid. Less ACC2 plasmid was required here compared to (E) so the additive effect of PHD3 could be better observed. Reactions were done with citrate. (G) ACC activity in cells overexpressing 2 μg ACC2 plasmid with PHD3 knockdown or control (n = 3). Reactions were done with citrate. Knockdown was performed with shPHD3 #2 and confirmed in Figure S2A. For panels (E–G), *p < 0.05, **p < 0.01, ***p < 0.001. Data represent mean ± SEM. See also Figure S1.
Figure 3
Figure 3. PHD3 represses FAO in response to nutrient abundance and independently of HIF and AMPK
(A) Palmitate oxidation by 293T cells following stable PHD3 knockdown by shRNA (shPHD3.1 and shPHD3.2) or non-targeting control (shControl) (n = 4). (B) Palmitate oxidation in complete medium in 293T cells overexpressing WT or mutant ACC2 (n = 3). (C) Oxidation of long chain palmitic acid versus medium chain hexanoic acid in 293T cells expressing shPHD3 or non-targeting control shRNA (n = 3). (D–E) Palmitate oxidation in HIF-deficient mouse hepatoma 4 (B13NBii1) cells. FAO was assessed 48 h after transfection with human HA-PHD3 or vector or with siPHD3 or siControl (n = 3). (F) Validation of HIF deficiency in HIFβ-null hepatoma cells. PHD3 expression and HIF target gene expression in HIFβ-deficient cells transfected with siRNA against PHD3 or control, and treated with or without the HIFα-stabilizing compound CoCl2 (250 μM, 6 h) (n = 4). (G) Immunoblot of HIF1α and 2α levels in 293T cells with PHD3 knockdown or control. HIFα was made more identifiable by 6 h treatment with 250 μM CoCl2 in separate control samples. (H) Effect of PHD3 knockdown on palmitate oxidation in 786-O VHL−/− cells (n = 3). (I) Palmitate oxidation in 293T cells following 12 h pre-incubation in normoxia or hypoxia (1% O2). Cells were maintained under normoxia or hypoxia during FAO analysis (n = 4). (J) Palmitate oxidation in WT versus AMPKα KO MEFs expressing shRNA against PHD3 or non-silencing control (n = 3). (K) ACC hydroxylation in 293T cells following 12 h incubation in high versus low nutrient medium. High nutrient DMEM contains 4.5 g/L glucose and serum. Low nutrient DMEM contains 1 g/L glucose without serum. ACC was immunoprecipitated and hydroxylation was detected by immunoblot. (L) 293T cells expressing shRNA against PHD3 or control were incubated 12 h in high or low nutrient media prior to analyzing ACC hydroxylation. (M) ACC hydroxylation dynamically responds to cellular nutrient cues. WT immortalized MEFs were incubated in high or low nutrient medium for 6 h, or in low nutrient medium for 6 h followed by adding back high nutrient medium for 5 or 10 min. ACC-IP was performed in lysis buffer containing the PHD inhibitor DMOG (1 mM) to minimize hydroxylation in the lysis buffer. Hydroxylation was detected by immunoblot. (N) Impact of PHD3 knockdown on the ability of MEFs to modulate FAO in response to low or high nutrient medium (n = 3). (O) Impact of PHD3 knockdown on the ability of 293T cells to suppress FAO in response to supplementing low glucose, serum-free medium with dimethyl ketoglutarate (+kg, 5 mM) for 6 h prior to and during 2 hr FAO analysis (n = 3). (P) Acylcarnitine levels measured by metabolomics analysis of 293T cells grown in high nutrient medium following stable knockdown of PHD3 or control. Levels were normalized to cell count in parallel plates (n = 6 for control, n = 3 for shPHD3). (Q) Two-part model of ACC2 regulation. Under low nutrient conditions, AMPK responds to the AMP/ATP ratio to phosphorylate and inhibit ACC2, thus promoting long chain FAO. Under high nutrient conditions, PHD3 hydroxylates and activates ACC2 to limit long chain FAO. *p < 0.05, **p < 0.01, ***p < 0.001. Data represent mean ± SEM. See also Figure S2.
Figure 4
Figure 4. PHD3 expression is repressed in AML, contributing to altered ACC and a dependency on FAO
(A) Gene expression of PHD3 in patient samples across cancer types. Data obtained from Ramaswamy multi-type cancer analysis Oncomine dataset. (B–C) Relative PHD3 gene expression in normal marrow versus AML patient samples. Data obtained from Valk and Andersson Leukemia Oncomine datasets. (D) PHD3 gene expression across AML patient samples from datasets in TCGA. Patients were classified as low vs. high PHD3 based on performing univariate clustering on PHD3 levels using a Gaussian mixture model with two clusters. (E) Box plot showing stratification of low and high PHD3expression in TCGA AML patient samples, as calculated in (D). Nearly 80% of patients fell into the low PHD3 group. (F) Table of top curated gene sets that are inversely correlated with high-PHD3 AML patient samples, as determined by GSEA. Pathways were ranked by false discovery rate (FDR) q value and normalized enrichment score (NES). (G) PHD3 expression using PPIA as a reference gene. K562 = CML cell line. MOLM14, KG1, THP1, NB4 and U937 = AML cell lines. (H) ACC2 hydroxylation in leukemia cell lines. Because the ACC2 antibody does not work well for detecting endogenous input levels of ACC2 by immunoblot, an ACC antibody was used to show input. (I) ATP-affinity of ACC in leukemia cell lines. (J) Palmitate oxidation by leukemia cell lines in complete medium (n = 3). (K–L) Viability of leukemia cells assessed by PI staining and FACS after 96 h treatment with etomoxir (n = 3). All data points with drug treatment are significant by p < 0.001 for all cell lines compared to K562. Bar graph highlights sensitivity to 150 μM etomoxir. (M–N) Viability of leukemia cells after 96 h treatment with ranolazine (n = 3). All data points with drug treatment are significant by at least p < 0.05 or p < 0.01 compared to K562. Bar graph highlights sensitivity to 500 μM ranolazine. (O) PHD3 knockdown boosts FAO in K562 cells (n = 3). (P) In K562 cells that normally express high PHD3, PHD3 knockdown does not create a dependency on FAO. K562 cells expressing shPHD3 or shControl were treated 96 h +/− ranolazine, and viability was assessed by PI staining (n = 3). *p < 0.05, **p < 0.01, ***p < 0.001. Bar graphs and cell viability curves represent mean ± SEM. See also Figure S3.
Figure 5
Figure 5. PHD3 overexpression in low-PHD3 AML cells blunts FAO and cell proliferation in an ACC2-dependent manner
(A) Palmitate oxidation in MOLM14 and THP1 cells following stable overexpression of empty vector or PHD3 (n = 3). Immunoblots show stable overexpression of HA-PHD3. (B) Growth curves of MOLM14 and THP1 cells overexpressing vector or PHD3 (n = 3). (C) ATP CellTiter-Glo analysis in MOLM14 and THP1 cells overexpressing vector or PHD3 (n = 4). (D–E) PHD3 gene expression (n = 3) and immunoblot in K562 cells following overexpression of PHD3 or vector. (F–G) Growth curves of K562 cells overexpressing HA-PHD3 or empty vector (n = 3), or shRNA against PHD3 or control. (H) ACC2, but not ACC1, is required for PHD3 to repress palmitate oxidation in MOLM14 cells (n = 3). Cells were first infected with lentivirus expressing shRNA against ACC isozymes or control and conferring puromycin resistance. Following puromycin selection, PI-negative cells were sorted by FACS. These cells were infected with PHD3 or vector conferring hygromycin resistence. Following selection with hygromycin D, PI-negative cells were collected and used for subsequent assays. (I–J) Overexpressed PHD3 acts through ACC2, but not ACC1, to blunt AML cell proliferation. Growth curves were assessed by cell counting in MOLM14 and THP1 cells following knockdown of ACC1 or ACC2, as well as overexpression of empty vector or PHD3 (n = 3). Relative cell number at 72 h, compared to count at time 0, is highlighted on the right. MOLM14 cells were generated as above. THP1 cells were generated by viral overexpression of PHD3 or vector, followed by FACS selection of PI-negative cells. Subsequently, ACC1, ACC2 or control knockdown was achieved by siRNA. *p < 0.05, **p < 0.01, ***p < 0.001. Data represent mean ± SEM. See also Figures S4 and S5.
Figure 6
Figure 6. Restoring high PHD3 expression impairs AML colony formation and potency
(A–B) CFU and representative images of MOLM14 and THP1 cells overexpressing vector or PHD3. CFU were imaged 8 d after plating MOLM14 and 20 d after plating THP1 using a Nikon Eclipse Ti-U microscope at 200× magnification and SPOT camera software 5.0. (C) CFU and representative images of THP1 cells overexpressing vector or PHD3 in the presence of siRNA against ACC1, ACC2 or control. CFU were imaged 18 d after plating (n = 3). (D–E) CFU and representative images from K562 cells expressing PHD3 or vector, or shRNA against PHD3 or control. CFU were imaged 10 d after plating (n = 2–3). (F) PHD3 gene expression in primary human CD34+ cells from bone marrow filtrate of a healthy control or AML patient samples (690a, 2093 and 2266, blue bars). PPIA was the reference gene. (G) ATP CellTiter-Glo analysis in AML patient samples following overexpression of vector or PHD3 (n = 4). (H) PHD3 gene expression in primary mouse CD11b control cells or AML cells obtained from Hoxa9 Meis1 and MLL-AF9 mouse models. (I) PHD3 gene expression in primary mouse MLL-AF9 AML cells following stable overexpression of empty vector or PHD3 (n = 2). (J) CFU from MLL-AF9 cells overexpressing vector or PHD3, counted 10 d after plating (n = 3). (K) Kaplan-Meier survival curves of NSG mice xenotransplanted with MOLM14 cells overexpressing vector or PHD3 (n = 5). *p < 0.05, **p < 0.01, ***p < 0.001. Data represent mean ± SEM. See also Figure S6.

References

    1. Abu-Elheiga L, Oh W, Kordari P, Wakil SJ. Acetyl-CoA carboxylase 2 mutant mice are protected against obesity and diabetes induced by high-fat/high-carbohydrate diets. Proc Natl Acad Sci USa. 2003;100:10207–10212. - PMC - PubMed
    1. Almarza-Ortega DB. Human Acetyl-CoA Carboxylase 2. Molecular Cloning, Characterization, Chromosomal Mapping, and Evidence for Two Isoforms. Journal of Biological Chemistry. 1997;272:10669–10677. - PubMed
    1. Amrit FRG, Steenkiste EM, Ratnappan R, Chen S-W, McClendon TB, Kostka D, Yanowitz J, Olsen CP, Ghazi A. DAF-16 and TCER-1 Facilitate Adaptation to Germline Loss by Restoring Lipid Homeostasis and Repressing Reproductive Physiology in C. elegans. PLoS Genetics. 2016;12(2):1–35. - PMC - PubMed
    1. Andersson A, Ritz C, Lindgren D, Edén P, Lassen C, Heldrup J, Olofsson T, Råde J, Fontes M, Porwit-MacDonald A, et al. Microarray-based classification of a consecutive series of 121 childhood acute leukemias: prediction of leukemic and genetic subtype as well as of minimal residual disease status. Leukemia. 2007;21:1198–1203. - PubMed
    1. Barger JF, Gallo CA, Tandon P, Liu H, Sullivan A, Grimes HL, Plas DR. S6K1 determines the metabolic requirements for BCR-ABL survival. Oncogene. 2012;32:453–461. - PMC - PubMed

Publication types

MeSH terms