Review
. 2017 Mar 4;47(2):138-153.
doi: 10.1080/10408347.2016.1233805. Epub 2016 Sep 16.

Colorimetric Sensor Arrays for the Detection and Identification of Chemical Weapons and Explosives

Affiliations
Review

Colorimetric Sensor Arrays for the Detection and Identification of Chemical Weapons and Explosives

Michael J Kangas et al. Crit Rev Anal Chem. .

Abstract

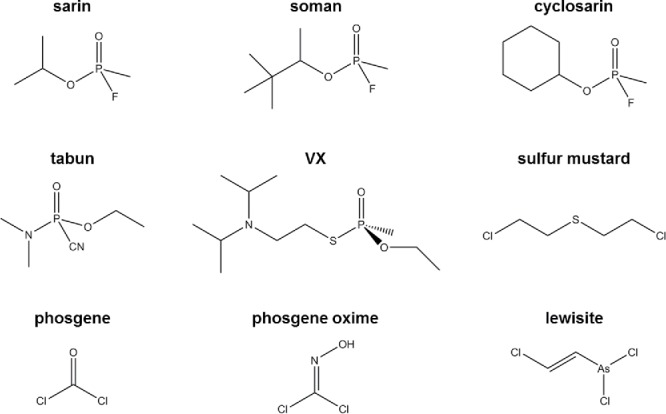
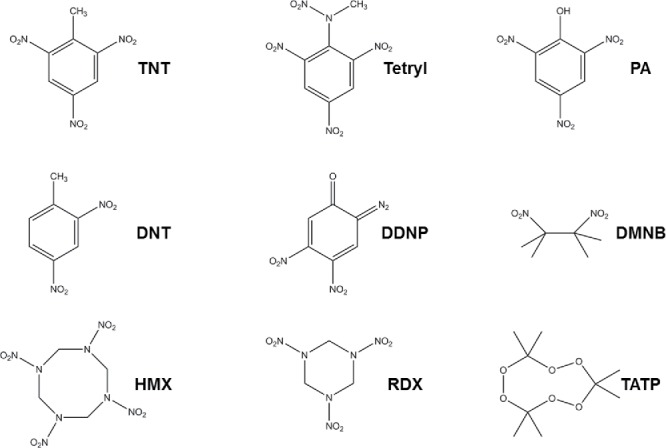
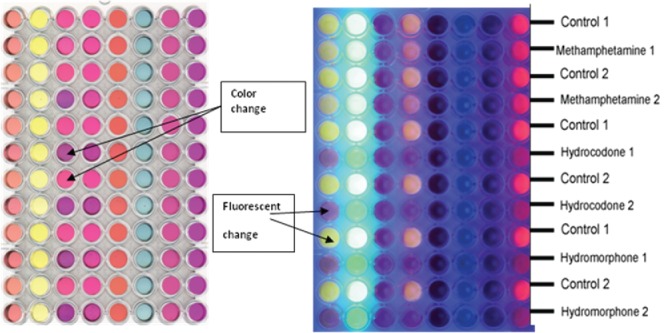
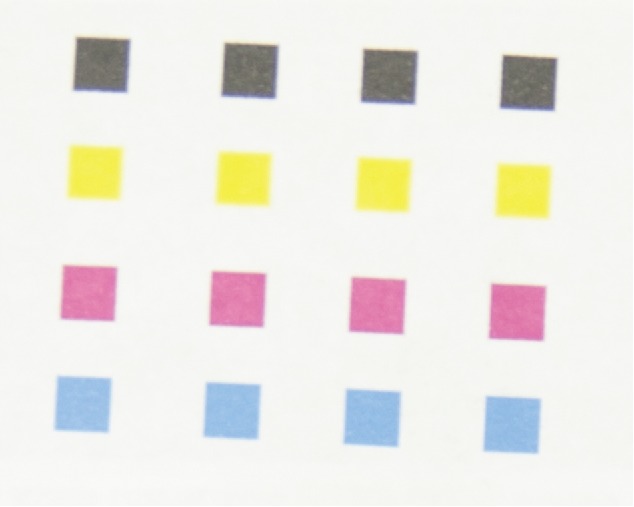
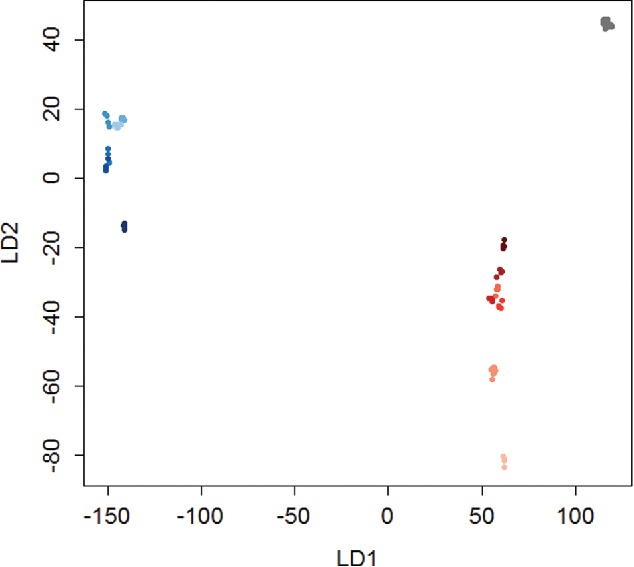
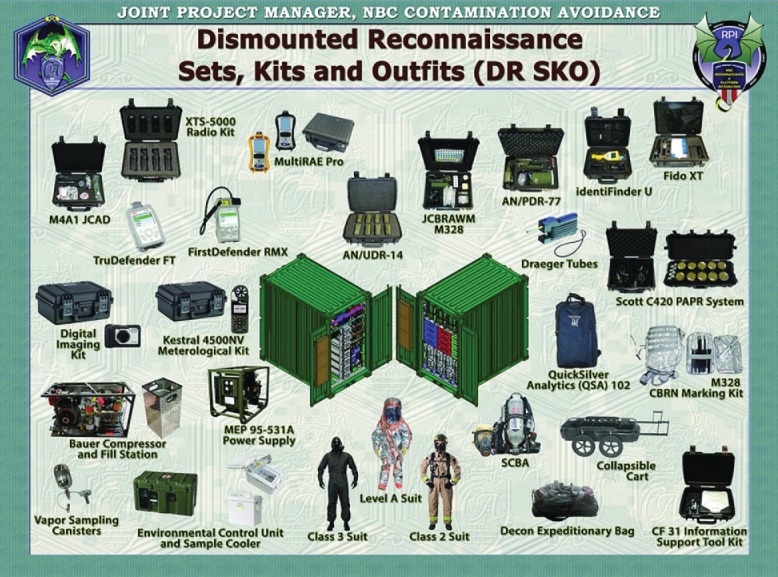
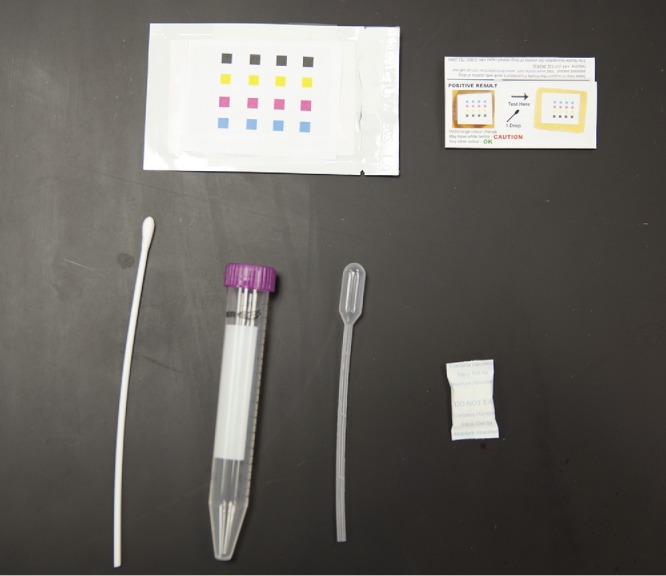
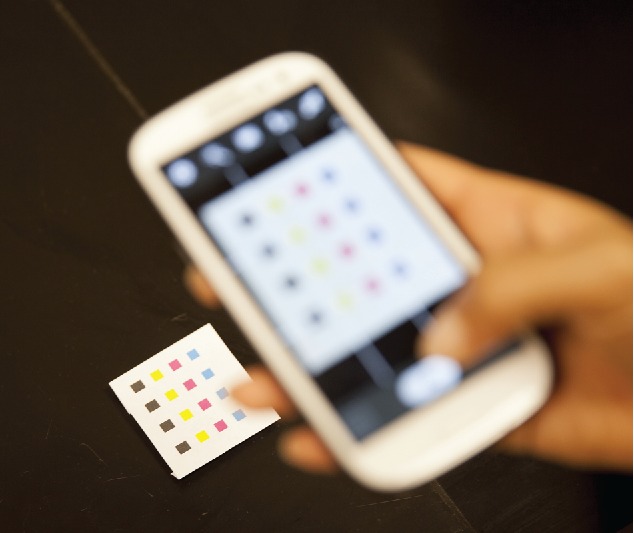
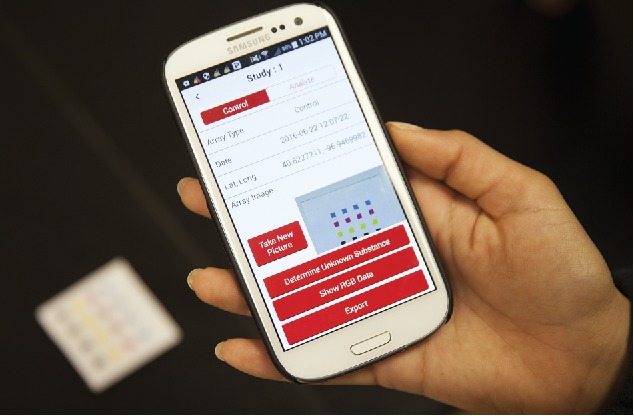
There is a significant demand for devices that can rapidly detect chemical-biological-explosive (CBE) threats on-site and allow for immediate responders to mitigate spread, risk, and loss. The key to an effective reconnaissance mission is a unified detection technology that analyzes potential threats in real time. In addition to reviewing the current state of the art in the field, this review illustrates the practicality of colorimetric arrays composed of sensors that change colors in the presence of analytes. This review also describes an outlook toward future technologies, and describes how they could possibly be used in areas such as war zones to detect and identify hazardous substances.

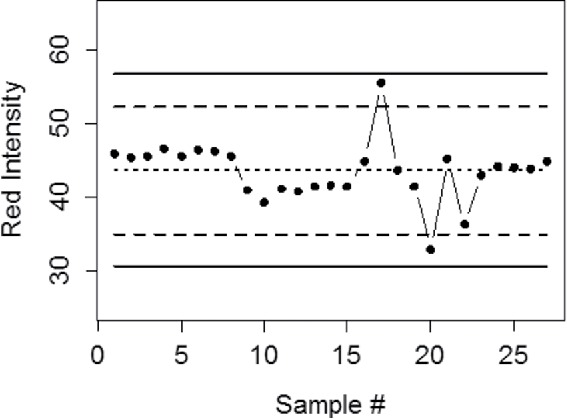
Keywords: Colorimetric arrays; chemical detection; explosives; field testing; handheld devices; principal component analysis; red green blue (RGB) analysis; smartphone technology.


Figures

Figure 1.
Figure 1.
Structures of selected warfare agents.
Figure 2.
Figure 2.
Structures of selected explosives. TNT (2,4,6-trinitrotoluene), DNT (2,4 dinitrotoluene), HMX (octahydro-1,3,5,7-tetranitro-1,3,5,7-tetrazocine), Tetryl (2,4,6-trinitrophenylmethylnitramine), DDNP (diazodinitrophenol), RDX (cyclotrimethylenetrinitramine), PA (picric acid), DMNB (2,3-dimethyl-2,3-dinitrobutane), TATP (triaceonetriperoxide).
Figure 3.
Figure 3.
An in-house created liquid-based sensor array showing changes in color (left) and fluorescence in the image (right) in the presence of various narcotic samples. The color changes compared to a water control sample can be used to identify the analytes.
Figure 4.
Figure 4.
A colorimetric array printed with a commercially available inkjet printer showing four rows of four different sensors.
Figure 5.
Figure 5.
Euclidean distance for 0.5 – 10 M NaOH (blue) and HCl (red), and a water control (grey). For both analytes, the color is darker for higher concentrations.
Figure 6.
Figure 6.
Biplot from principal component analysis (PCA). Water (grey), HCl (red), and NaOH (blue) each form distinct groups, and the NaOH concentrations form distinct groups. The cluster in the top left quadrant represents the HCl samples, while the cluster on the far right represents NaOH, and the cluster in the left lower quadrant represents the control samples (water). The ellipses represent 90% confidence intervals. PC1 and PC2 are the first and second components from PCA, respectively.
Figure 7.
Figure 7.
Three dimensional plot using PCA results based on the first three components. The 1.0 M (yellow) and 0.5 M (orange) samples are separated from the HCl samples at higher concentrations. The various concentrations are clearly separated, as the 10 M samples appear in the upper left quadrant, and the lower concentrations are aligned linearly downwards towards the bottom right. The lowest concentration (0.5 M) samples are the furthest (light blue) from the highest concentration (red) samples. The ellipses represent 90% confidence intervals.
Figure 8.
Figure 8.
Hierarchical cluster analysis (HCA) for 0.5 – 10 M concentrations of NaOH (blue), HCl (red), and water control (grey). For both analytes the color is darker for higher concentrations. Distinct clusters are formed for water, NaOH, and HCl. Some misclassifications for concentrations are present, particularly in the acid samples. The y-axis shows the Euclidean distance squared (based on RGB units).
Figure 9.
Figure 9.
Linear discriminant analysis (LDA) for 0.5 – 10 M concentrations of NaOH (blue), HCl (red), and a water control (grey). For both analytes, the color is darker for higher concentrations. There is clear a separation between the water, HCl, and NaOH samples, and moderate separation between the concentrations of acid and base. LD1 and LD2 are the first and second directions from LDA, respectively (units are based on RGB values).
Figure 10.
Figure 10.
The Dismounted Reconnaissance Set that is currently used by the US Army. Figure obtained from Chemical, Biological, Radiological, & Nuclear Information Resource Center (CBRN IRC), 2014.
Figure 11.
Figure 11.
Prototype printed colorimetric array analysis kit. The kit contains the sensor array, disposable pipet, instructions, and silica gel desiccant sealed inside a protective foil packet.
Figure 12.
Figure 12.
Image collection with a smartphone. With a built in camera and processing power, a smart device could easily be used as the basis for an inexpensive, portable chemical identification system.
Figure 13.
Figure 13.
An example of a smartphone app for data collection and analysis. A smartphone with an appropriately designed app can automate the image collection, image processing, and sample identification steps and serve as a simple user-friendly device.
Figure 14.
Figure 14.
In-house created control chart for the red channel bromophenol blue. The points are measurements, and show that the sensor has not changed over many measurements. The solid lines are 3-standard deviation control limits, and the dashed lines are 2-standard deviation upper and lower warning lines.

References

    1. Afkhami A.; Sarlak N.. A Novel Cyanide Sensing Phase Based on Immobilization of Methyl Violet on A Triacetylcellulose Membrane. Sens. Actuators B: Chem. 2007, , 437–441. doi: 10.1016/j.snb.2006.06.012 - DOI
    1. Alkasir R. S. J.; Rossner A.; Andreescu S.. Portable Colorimetric Paper-Based Biosensing Device for the Assessment of Bisphenol A in Indoor Dust. Environ. Sci. Technol. 2015, , 9889–9897. doi: 10.1021/acs.est.5b01588 - DOI - PubMed
    1. Amani M.; Chu Y.; Waterman K. L.; Hurley C. M.; Platek M. J.; Gregory O. J.. Detection of Triacetone Triperoxide (TATP) Using a Thermodynamic Based Gas Sensor. Sens. Actuators B: Chem. 2012, , 7–13. doi: 10.1016/j.snb.2011.11.019 - DOI
    1. Ariza-Avidad M.; Salinas-Castillo A.; Cuéllar M. P.; Agudo-Acemel M.; Pegalajar M. C.; Capitán-Vallvey L. F.. Printed Disposable Colorimetric Array for Metal Ion Discrimination. Anal. Chem. 2014, , 8634–8641. doi: 10.1021/ac501670f - DOI - PubMed
    1. Arrayit Corporation [WWW Document]. http://shop.arrayit.com/ Accessed on June.17.16, 2016.

MeSH terms