. 2016 Dec 13;7(50):82185-82199.
doi: 10.18632/oncotarget.11985.

Synthetic lethal interaction of cetuximab with MEK1/2 inhibition in NRAS-mutant metastatic colorectal cancer

Affiliations

Synthetic lethal interaction of cetuximab with MEK1/2 inhibition in NRAS-mutant metastatic colorectal cancer

Bernardo Queralt et al. Oncotarget. .

Abstract

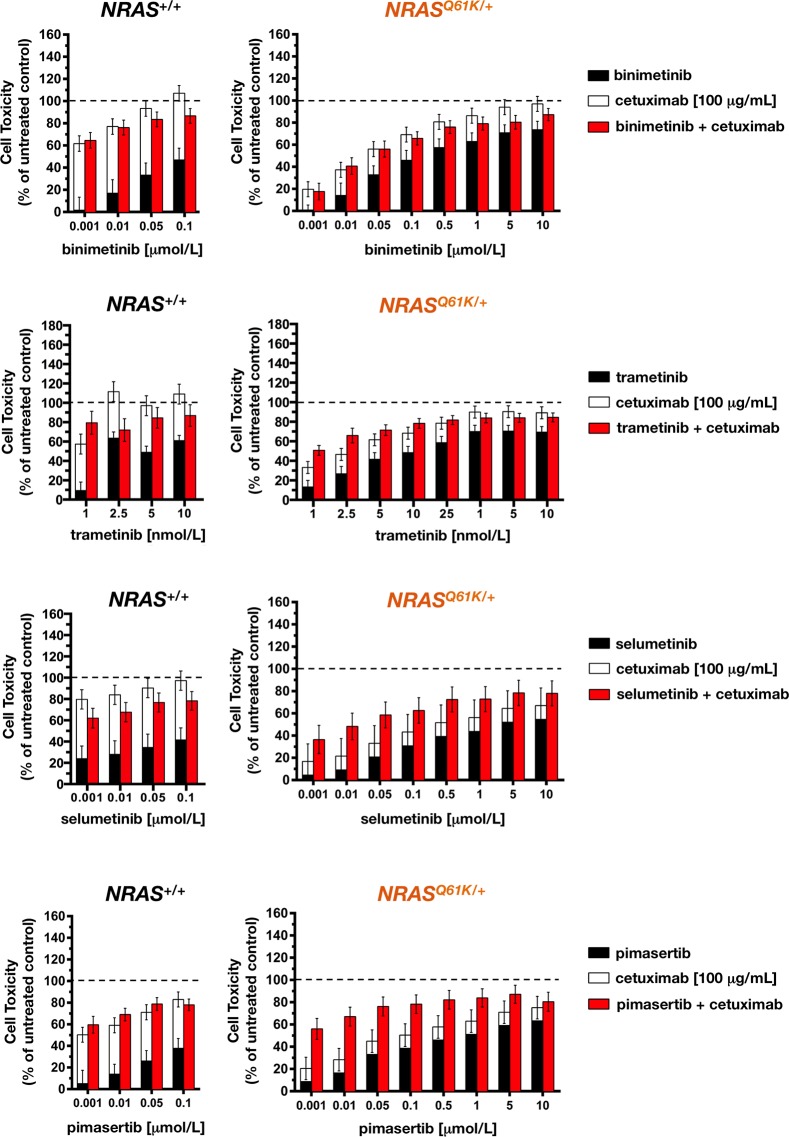
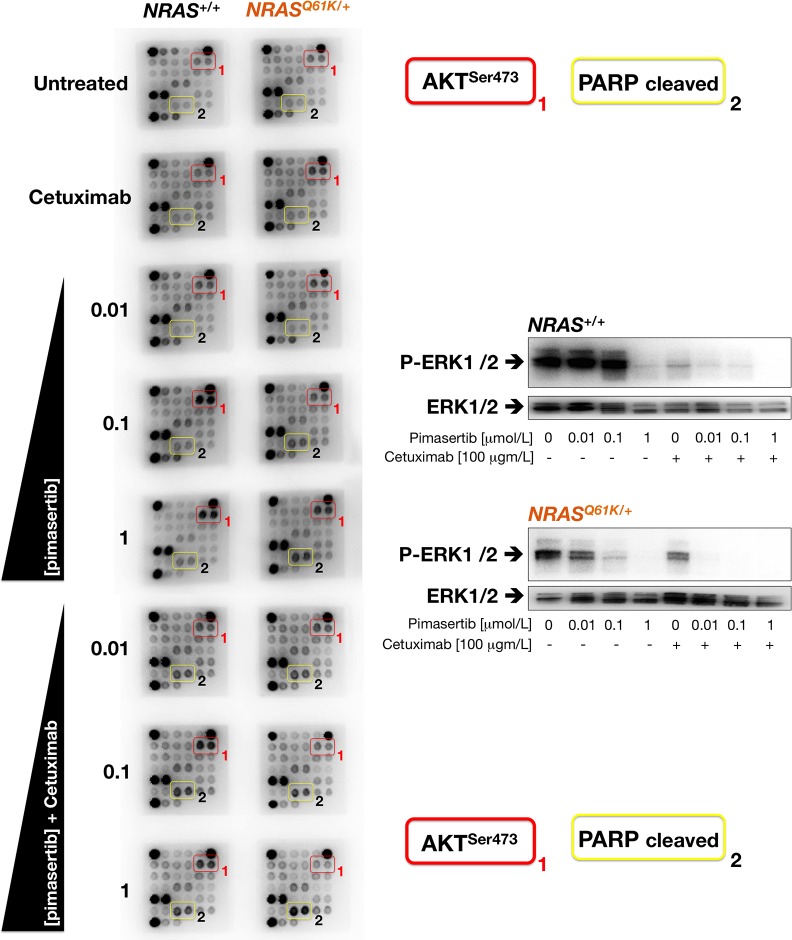
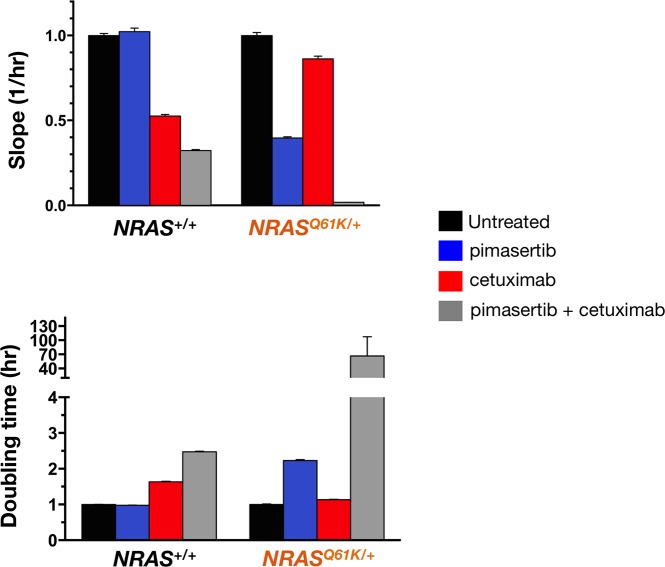
KRAS mutations are an established predictor of lack of response to EGFR-targeted therapies in patients with metastatic colorectal cancer (mCRC). However, little is known about the role of the rarer NRAS mutations as a mechanism of primary resistance to the anti-EGFR monoclonal antibody cetuximab in wild-type KRAS mCRC. Using isogenic mCRC cells with a heterozygous knock-in of the NRAS activating mutation Q61K, we aimed to elucidate the mechanism(s) by which mutant NRAS blocks cetuximab from inhibiting mCRC growth. NRASQ61K/+ cells were refractory to cetuximab-induced growth inhibition. Pathway-oriented proteome profiling revealed that cetuximab-unresponsive ERK1/2 phosphorylation was the sole biomarker distinguishing cetuximab-refractory NRASQ61K/+ from cetuximab-sensitive NRAS+/+ cells. We therefore employed four representative MEK1/2 inhibitors (binimetinib, trametinib, selumetinib, and pimasertib) to evaluate the therapeutic value of MEK/ERK signaling in cetuximab-refractory NRAS mutation-induced mCRC. Co-treatment with an ineffective dose of cetuximab augmented, up to more than 1,300-fold, the cytotoxic effects of pimasertib against NRASQ61K/+ cells. Simultaneous combination of MEK1/2 inhibitors with cetuximab resulted in extremely high and dose-dependent synthetic lethal effects, which were executed, at least in part, by exacerbated apoptotic cell death. Dynamic monitoring of real-time cell growth rates confirmed that cetuximab synergistically sensitized NRASQ61K/+ cellsto MEK1/2 inhibition. Our discovery of a synthetic lethal interaction of cetuximab in combination with MEK1/2 inhibition for the NRAS mutant subgroup of mCRC underscores the importance of therapeutic intervention both in the MEK-ERK and EGFR pathways to achieve maximal therapeutic efficacy against NRAS-mutant mCRC tumors.

Keywords: KRAS; MEK1/2; NRAS; cetuximab; colon cancer.


Conflict of interest statement

CONFLICTS OF INTEREST

The authors declare no competing financial interests.

Figures

Figure 1
Figure 1. Mono-allelic activation of NRAS is sufficient to confer refractoriness to cetuximab in mCRC cells
Cell viability of NRAS+/+, NRASQ61K/+, and PIK3CAH1047R/+ SW48 cells cultured with 100 μg/mL cetuximab was assessed using an MTT assay. All assays were performed at least three times in triplicate. n. s. Non-significant differences were identified by Student's t test for paired values; *P < 0.01 compared to control cells by Student's t test for paired values.
Figure 2
Figure 2. ERK1/2 activation is unresponsive to cetuximab resistance in NRAS mutant mCRC cells
Left panels. Phospho-proteome profiling of mCRC cells in response to cetuximab. Total cell lysates (750 μg) from NRAS+/+ and NRASQ61K/+ cells before and after treatment with 100 μg/mL cetuximab (48 h) were incubated on membranes of the phospho-proteomics platforms, human Phospho-MAPK (top panels; 23 different MAPKs and other serine/threonine kinases) and human Phospho-Kinase Arrays (bottom panels; 43 different kinases and 2 related total proteins), as described in “Methods and materials”. Figure shows representative phospho-proteome analyses. Equivalent results were obtained in two independent experiments. Right panels. Bar graphs show the results of densitometry analysis of the scanned phospho-arrays. Signal values include the background correction and the intensities normalization to the corresponding positive control values on each array.
Figure 3
Figure 3. NRAS mutant mCRC cells are more resistant to MEK1/2 inhibitors
Cell viability of NRAS+/+, NRASQ61K/+, and PIK3CAH1047R/+ cells cultured with the MEK1/2 inhibitors binimetinib, trametinib, selumetinib, and pimasertib was assessed using an MTT assay. Concentrations causing 50% reduction in cell viability (IC50 values) were calculated in the absence (top) or presence (bottom) of cetuximab. *P < 0.01 compared with control cells by ANOVA followed by Scheffé's multiple contrasts.
Figure 4
Figure 4. Cetuximab synergistically augments the toxicity of MEK1/2 against NRAS mutant mCRC cells
Cells seeded in 96-well plates (2,000-3,000 cells per well) were cultured in triplicate with or without graded concentrations of MEK1/2 plus/minus 100 μg/mL cetuximab, which were not renewed during the entire period of cell exposure. For each pair of columns, the height of the left columns represents the sum of the toxic effect of each agent and, therefore, the expected toxicity if their effects were additive when used in combination. The total height of the right columns represents the observed toxicity when the agents were used in combination. The difference between the heights of the paired columns reflects the magnitude of antagonism or synergism on cell toxicity between MEK1/2 inhibitors and cetuximab in NRAS+/+ (left panels) and NRASQ61K/+ (right panels) cells. Results are shown as mean (columns) ± SD (error bars) from at least three experiments in which triplicate wells were analyzed.
Figure 5
Figure 5. Cetuximab markedly sensitizes NRAS mutant mCRC cells to MEK1/2 inhibition
The cell viability effects from exposure of NRAS mutant cells to MEK1/2 inhibitors were analyzed by generating concentration-effect curves as a plot of the fraction of unaffected (surviving) cells versus drug concentration. Dose-response curves were plotted as percentages of the control cells' absorbance (= 100%), which was obtained from wells treated with appropriate concentrations of agent vehicles that were processed simultaneously. IC50 values were designated for the concentrations of the agents decreasing absorbance values at 570 nm by 50%, as determined by interpolation using MTT-based colorimetric cell viability assays. Values are means ± SD from at least three experiments in which triplicate wells were analyzed. Sensitization factors were obtained by dividing IC50 values of MEK1/2 inhibitors alone by those obtained when cetuximab (100 μg/mL) was simultaneously supplemented.
Figure 6
Figure 6. Cetuximab augments MEK1/2 inhibitor-induced apoptotic cell death in NRAS mutant mCRC cells
Quantification of apoptosis-related cell death in NRAS+/+ (left panels) and NRASQ61K/+ (right panels) cells in response to 72 h treatment with graded concentrations of MEK1/2 inhibitors in the absence or presence of cetuximab (100 μg/mL), was determined as described in “Materials and methods”. Results are shown as mean (columns) ± SD (error bars) from at least three experiments in which duplicate wells were analyzed.
Figure 7
Figure 7. Cetuximab prevents AKT activation and promotes PARP cleavage in pimasertib-treated NRAS mutant mCRC cells
Left. Figure shows representative chemiluminiscent array images from the PathScan Intracellular Signaling array kit showing key phosphorylated signaling nodes in NRAS+/+ (left panels) and NRASQ61K/+ (right panels) treated with graded concentrations of pimasertib in the absence or presence of cetuximab. Right. Representative immunoblot analysis showing expression of phospho-ERK1/2 and corresponding total-ERK1/2 after exposure to graded concentration of pimasertib in the absence or presence of cetuximab.
Figure 8
Figure 8. MEK1/2 inhibitor and cetuximab synergistically decrease the proliferation rate of NRAS mutant mCRC cells
The rate of proliferation was monitored in real-time using the xCELLligence system. Figure shows the rates of proliferation (top panel) and cell doubling times (bottom panel) in the presence of pimasertib (10 nmol/L), cetuximab (100 μg/mL), or pimasertib + cetuximab as determined by analyzing the growth curves shapes of NRAS+/+ (left panels) and NRASQ61K/+ between the 24 and 96 h hour interval. Results are shown as mean (columns) ± SD (error bars) from at least two experiments in which triplicate wells were analyzed.

References

    1. Siena S, Sartore-Bianchi A, Di Nicolantonio F, Balfour J, Bardelli A. Biomarkers predicting clinical outcome of epidermal growth factor receptor-targeted therapy in metastatic colorectal cancer. J Natl Cancer Inst. 2009;101:1308–24. - PMC - PubMed
    1. Bardelli A, Siena S. Molecular mechanisms of resistance to cetuximab and panitumumab in colorectal cancer. J Clin Oncol. 2010;28:1254–61. - PubMed
    1. De Roock W, Claes B, Bernasconi D, De Schutter J, Biesmans B, Fountzilas G, Kalogeras KT, Kotoula V, Papamichael D, Laurent-Puig P, Penault-Llorca F, Rougier P, Vincenzi B, et al. Effects of KRAS, BRAF, NRAS, and PIK3CA mutations on the efficacy of cetuximab plus chemotherapy in chemotherapy-refractory metastatic colorectal cancer: a retrospective consortium analysis. Lancet Oncol. 2010;11:753–62. - PubMed
    1. Misale S, Di Nicolantonio F, Sartore-Bianchi A, Siena S, Bardelli A. Resistance to anti-EGFR therapy in colorectal cancer: from heterogeneity to convergent evolution. Cancer Discov. 2014;4:1269–80. - PubMed
    1. Meriggi F, Vermi W, Bertocchi P, Zaniboni A. The Emerging Role of NRAS Mutations in Colorectal Cancer Patients Selected for Anti-EGFR Therapies. Rev Recent Clin Trials. 2014;9:8–12. - PubMed

MeSH terms