. 2016 Sep 20;45(3):497-512.
doi: 10.1016/j.immuni.2016.08.012. Epub 2016 Sep 13.

Multi-tiered Reorganization of the Genome during B Cell Affinity Maturation Anchored by a Germinal Center-Specific Locus Control Region

Affiliations

Multi-tiered Reorganization of the Genome during B Cell Affinity Maturation Anchored by a Germinal Center-Specific Locus Control Region

Karen L Bunting et al. Immunity. .

Abstract

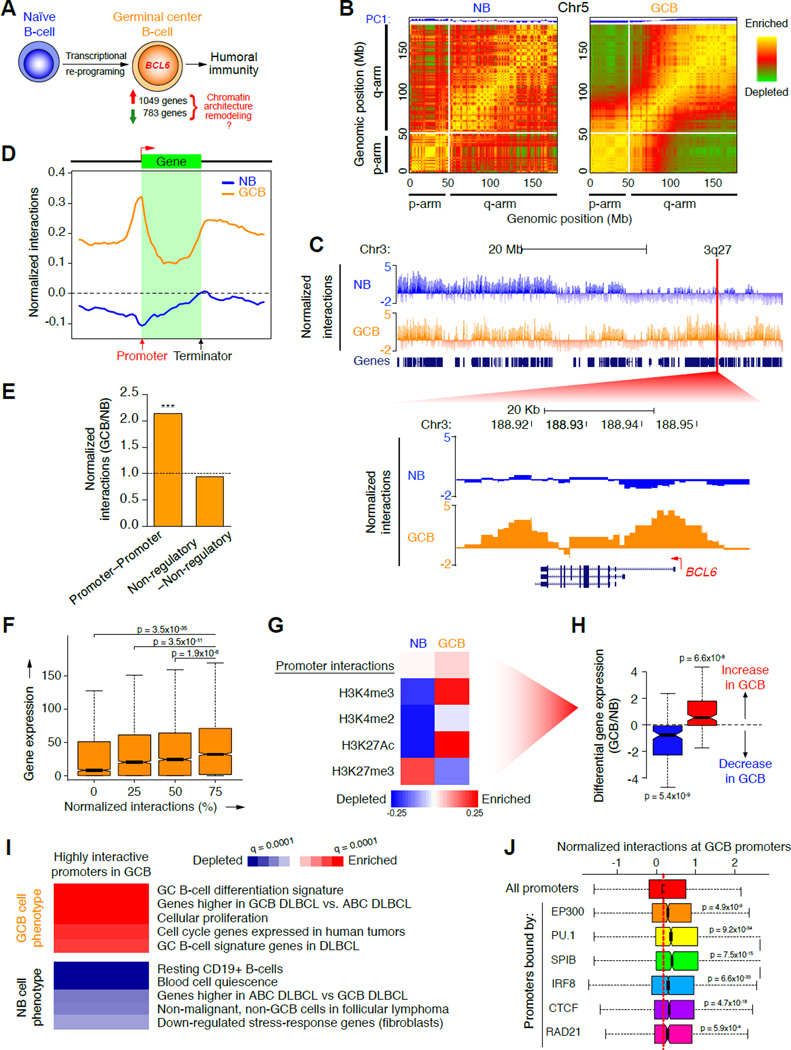
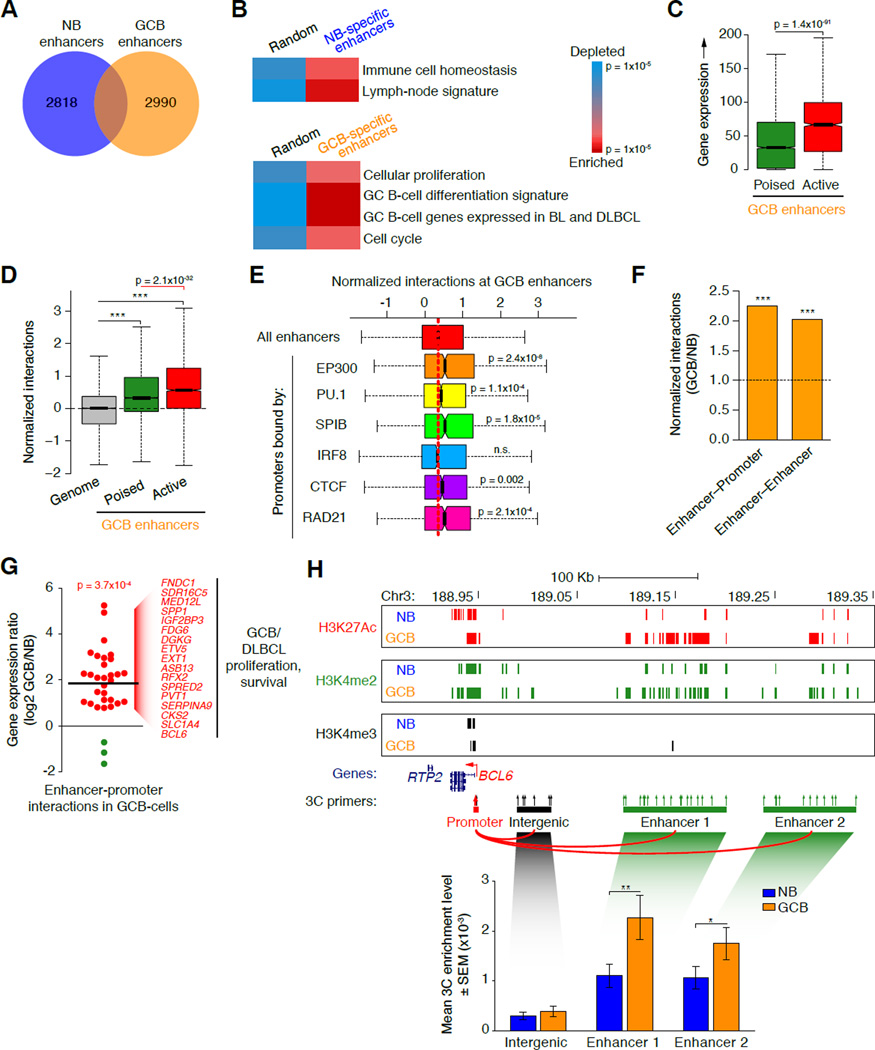
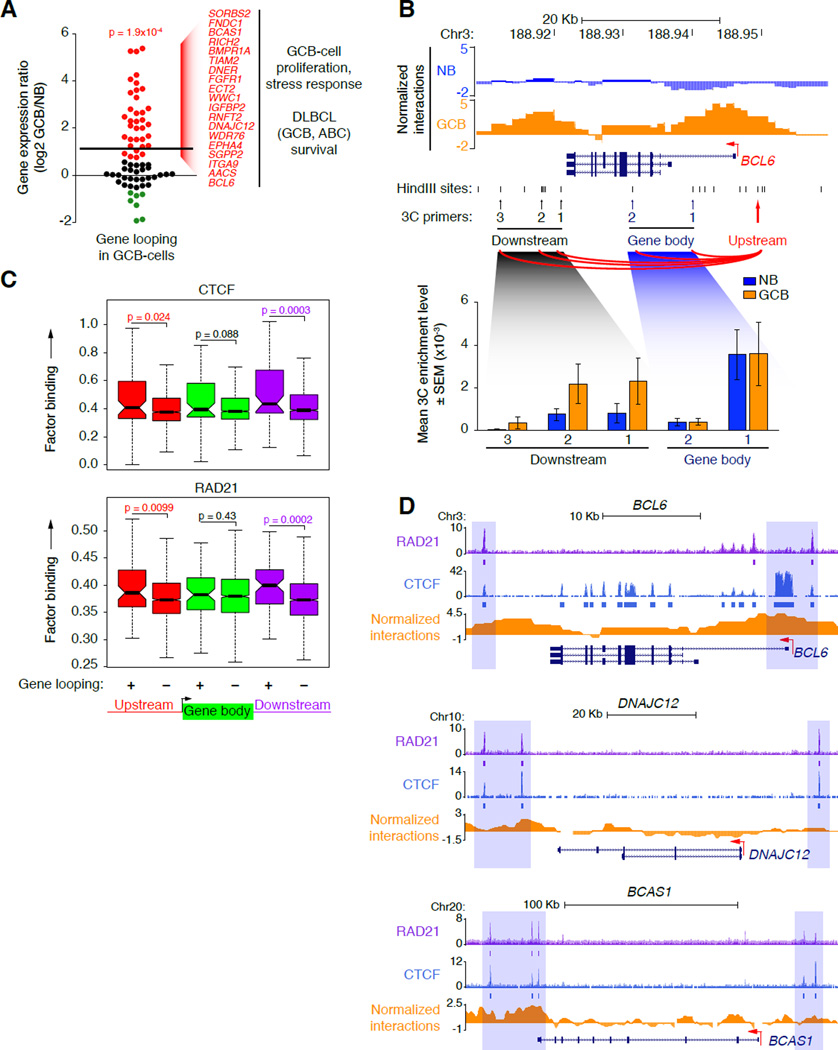
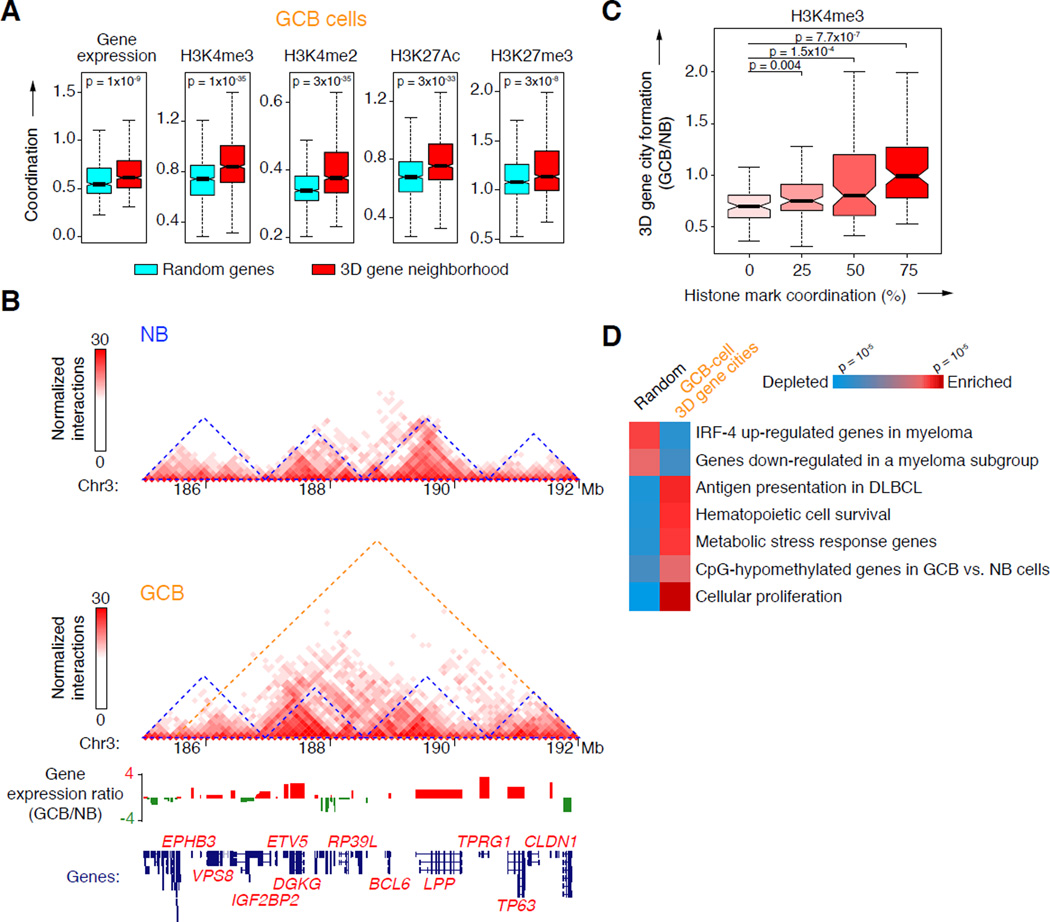
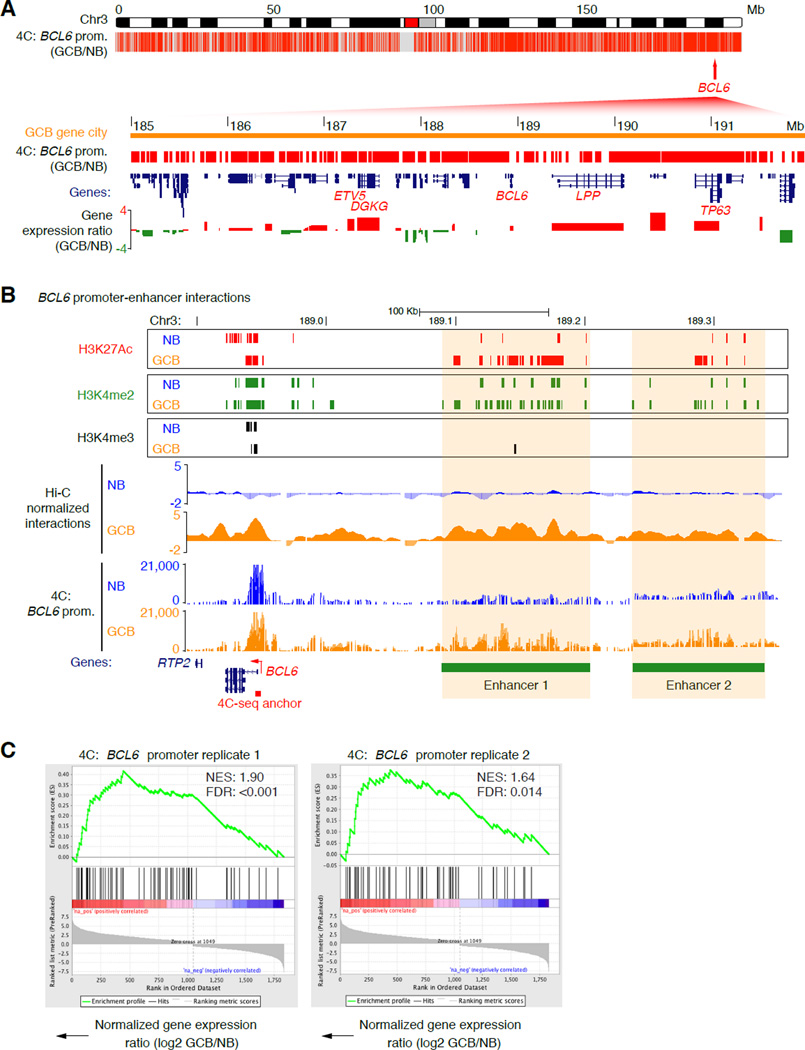
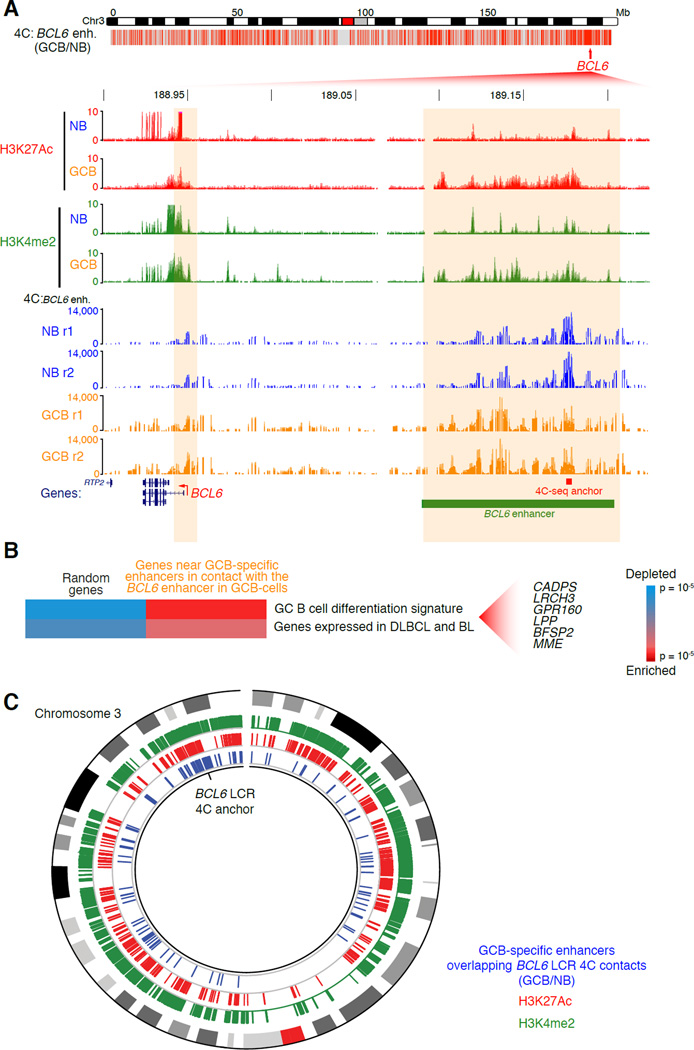
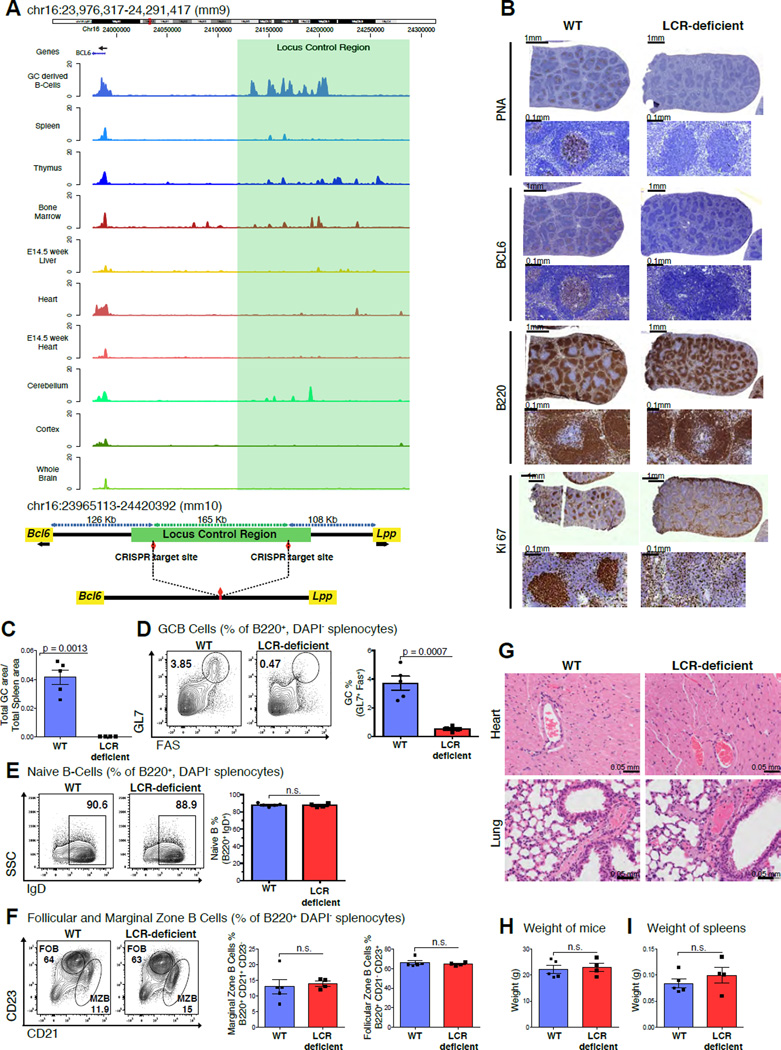
During the humoral immune response, B cells undergo a dramatic change in phenotype to enable antibody affinity maturation in germinal centers (GCs). Using genome-wide chromosomal conformation capture (Hi-C), we found that GC B cells undergo massive reorganization of the genomic architecture that encodes the GC B cell transcriptome. Coordinate expression of genes that specify the GC B cell phenotype-most prominently BCL6-was achieved through a multilayered chromatin reorganization process involving (1) increased promoter connectivity, (2) formation of enhancer networks, (3) 5' to 3' gene looping, and (4) merging of gene neighborhoods that share active epigenetic marks. BCL6 was an anchor point for the formation of GC-specific gene and enhancer loops on chromosome 3. Deletion of a GC-specific, highly interactive locus control region upstream of Bcl6 abrogated GC formation in mice. Thus, large-scale and multi-tiered genomic three-dimensional reorganization is required for coordinate expression of phenotype-driving gene sets that determine the unique characteristics of GC B cells.


Figures

Figure 1
Figure 1. Topological shifts in GCB-cells involve chromosome unpacking and increased promoter interactivity
A, Illustration of transcriptional changes during germinal center B-cell differentiation. 1,049 and 783 genes are up and down-regulated respectively, as determined by RNA-seq. B, Pearson correlation matrix plots of intra-chromosomal interactions across chromosome 5 at 1 Mb scale in NB and GCB-cells, showing PC1 and loss of interactions between the p (short) and q (long) arms of chromosomes in GCB-cells. The degree of correlation is indicated by yellow (enrichment), green (depletion) or red (no correlation). Centromere positions are indicated by the lack of DNA mappability (white). C, UCSC Genome Browser tracks showing normalized interaction frequencies, as measured by Hi-C, for naïve B and GCB-cells across a region of chromosome 3, with a zoomed in view of a 3q27 locus encoding BCL6. D, Profiles of the abundance of genome-wide interactions (normalized) across regions encoding genes (± 50 Kb) in naïve B and GCB-cells. E, Relative enrichment of promoter–promoter and non-regulatory–non-regulatory interactions, as a fraction of all interactions in GCB versus naïve B-cells. ***p<10−15, χ2 test. F, Correlation between gene expression (RPKM) and normalized interaction frequency percentiles (quartiles) in naïve B and GCB-cells. Median gene expression was compared between the 25% most interactive promoters and all other quartiles, using non-parametric Wilcoxon tests. G, Principal component analysis of promoter interactions (Hi-C) and histone modification peaks (ChIP-seq), in naïve and GCB-cells. Degree of correlation is indicated by the color key showing enrichment (red) and depletion (blue) and represents normalized read counts (for Hi-C and ChIP-seq data). Only genes in this principal component were differentially expressed as shown in: H, Differential gene expression (log2 ratio) of genes enriched (red) or depleted (blue) in the principal component promoter set shown in G. p-values were calculated using a threshold of >20% expression change between naïve B and GCB-cells. I, The heatmap represents GSEA of genes with highly interactive promoters in GCB-cells showing gene signatures that are positively or negatively enriched (FDR = 0.01). J, Correlations between normalized promoter interaction frequencies and enrichment of the listed regulatory factors as determined by ChIP-chip or ChIP-seq in GCB-cells (compared to all promoters). Significance was determined using Mann-Whitney’s test. n.s., non-significant. See also figure S1.
Figure 2
Figure 2. GCB-cells manifest widespread reprogramming of enhancer interactions
A, Venn diagram showing numbers of unique and overlapping naïve B and GCB-cell specific enhancer regions (H3K4me2pos H3K4me3neg). B, Relative enrichment and depletion for genes <50 Kb away from naïve B and GCB-cell-specific enhancers (versus a random set of genes), showing enrichment of naïve B and GCB-cell signature genes, respectively. C, Expression (RPKM) of genes <50 Kb away from poised (H3K27Acneg H3K4me2pos H3K4me3neg) versus active (H3K27Acpos H3K4me2pos H3K4me3neg) GCB-specific enhancers. D, Normalized interaction frequencies (as measured by Hi-C) at poised versus active GCB-specific enhancers versus the whole genome. E, Correlations between normalized interaction frequencies (measured by HiC) and factor binding, as determined by ChIP-seq, at GCB-cell specific enhancers (compared to all enhancers). Significance was determined using Mann-Whitney’s test. n.s., non-significant. F, Relative enrichment of enhancer–promoter and enhancer–enhancer interactions, as a fraction of all interactions in GCB versus naïve B-cells. ***p<10−15, χ2 test. G, Log2 normalized ratio of gene expression in GCB versus naïve B-cells for 32 genes with highest enhancer-promoter interactivity in GCB-cells (FDR = 0.05, Fisher’s exact test with BH correction). Genes up or downregulated in GCB-cells are colored red or green, respectively. Line indicates the average gene expression ratio for the 32 genes H, UCSC Genome Browser tracks in naïve B and GCB-cells showing chromatin marks and locations of 3C primers (arrows) across a region upstream of BCL6. The red arrow denotes the anchor point for all 3C PCRs. Bar graphs show the mean 3C enrichment in naïve B and GCB-cell, 3C DNA templates (n=3) at the regions indicated. Primer pairs were averaged across each region. Asterisk indicates significance using a one-tailed, unpaired t-test (**: p<0.05; *: p<0.1). See also figure S2.
Figure 3
Figure 3. GCB-cell genes form gene loops in concert with CTCF and cohesin binding
A, Log2 normalized ratio of gene expression in GCB versus naïve B-cells for 70 genes with increased 5’ to 3’ gene looping in GCB-cells (FDR = 0.05, Fisher’s exact test with BH correction). Genes up or downregulated in GCB-cells are colored red or green, respectively. The upper line indicates the average gene expression ratio of the 70 genes. B, UCSC Genome Browser tracks in naïve B and GCB-cells showing normalized interaction frequency, HindIII sites and locations of 3C primers (arrows) across the BCL6 gene region. The red arrow denotes the upstream anchor point. Bar graphs show the mean 3C enrichment in naïve B and GCB-cell 3C DNA templates (n=3) at the locations indicated. C, Average binding frequency of CTCF and RAD21 as determined by ChIP-seq, within the gene body or upstream or downstream regions (± 50 Kb) of genes with increased or decreased gene looping in GCB-cells (+ and −, respectively). Significance was determined using Mann-Whitney’s test. D, UCSC Genome Browser tracks showing normalized Hi-C interactions and locations of CTCF and RAD21 binding (normalized read counts) at representative genes with increased 5’ to 3’ looping in GCB-cells. ChIP-seeqer-defined peaks (ChIP enrichment over input) at these 5’ to 3’ sites are indicated by boxes below the tracks of normalized read counts and are highlighted by blue shading. See also Figure S3.
Figure 4
Figure 4. Altered 3D gene neighborhoods coordinate changes in chromatin and gene expression in GCB-cells
A, Degree of coordination of gene expression as detected by RNA-seq or histone modifications by ChIP-seq within 3D gene neighborhoods (red) or among randomly selected genes (blue) in GCB-cells. B, Two-dimensional heat maps of normalized interaction frequencies in naïve B and GCB-cells and log2 gene expression ratio (GCB/naïve B) across a chromosome 3 region. 3D gene neighborhoods in naïve B and GCB-cells are indicated (blue and orange triangles, respectively). Gene expression ratios between GCB vs. naïve B-cells determined by RNA-seq is shown below, along with location of each gene. C, Ratio of 3D gene city formation versus H3K4me3 coordination in GCB versus naïve B-cells. Significance was determined using Mann-Whitney’s test. D, Gene set enrichment and depletion among genes located within newly formed 3D gene cities in GCB-cells (>80% increase in interaction frequency) versus a random set of genes. The color scale indicates statistical significance of enrichment and depletion. See also Figure S4.
Figure 5
Figure 5. The BCL6 promoter interacts extensively with other GC expressed genes
A, Plot showing locations of BCL6 promoter contacts made in GCB-cells (versus NB-cells), as detected by 4C-seq across chromosome 3 (p<0.05, Fisher’s exact test). (Below) Zoomed-in view of the GCB-cell 3D gene city showing BCL6 gene contacts, locations of genes, histone modifications and log2 gene expression ratio (GCB/NB). GCB-cell-specific genes are highlighted. B, Genome visualization tracks showing H3K4me3 H3K4me2 and H3K27Ac histone modification peaks, normalized Hi-C interaction frequencies (merged), and normalized read counts of 4C contacts made with the BCL6 gene promoter in NB and GCB-cells (representative of 2 independent experiments) across the BCL6 gene region on chromosome 3. Increased interactions between the BCL6 promoter and two upstream enhancer elements (1 and 2) are evident in GCB-cells (highlighted). C, GSEA showing a positive correlation between up-regulated gene expression and genes in contact with the BCL6 promoter in GCB-cells. NES = normalized enrichment score. See also Figure S5.
Figure 6
Figure 6. A BCL6 upstream LCR forms an extensive GC-specific contact network
A, (Top) Plot showing locations of BCL6 LCR contacts made in GCB-cells (versus NB-cells), as detected by 4C-seq across chromosome 3 (p<0.05, Fisher’s exact test). (Below) Zoomed-in view of the BCL6 gene and LCR showing histone modifications as detected by ChIPseq, and normalized read counts of contacts made with the BCL6 enhancer bait sequence, as detected by replicate 4C-seq, in NB and GCB-cell replicates. B, Gene set enrichment and depletion among genes near to GCB-specific enhancers that form contacts with the putative GCB-cell specific LCR upstream of BCL6 in GCB-cells. Significant genes are listed (p<0.002). C, Circos plot showing (in blue) chromosomal locations of the enhancer-enhancer contacts made between the BCL6 LCR (4C anchor) and other GCB-specific enhancers in GCB-cells (but not in naïve B-cells), as detected by 4C-seq across chromosome 3 (p<0.05, Fisher’s exact test). Regions of enrichment of histone modifications (H3K4me2 and H3K27Ac) as measured by ChIP-seq are shown in green and red, respectively. The outermost ring of the plot is an ideogram of chromosome 3 with cytogenetic bands represented in gray scale and the centromere in red.
Figure 7
Figure 7. Disruption of the LCR leads to GC formation defects
A, Tracks for H3K27Ac read densities (top panel) normalized to input for murine tissues including GC derived malignant B-cells and other Bcl6 expressing tissues. The region shaded in green represents the location of the syntenic LCR. Schematic illustrating the locus upstream of Bcl6 in the mouse genome before and after CRISPR-mediated deletion (bottom panel). B, Immunohistochemistry images of mouse spleens stained with antibodies against PNA, BCL6, B220 and Ki67. C, Bar plot representing the splenic area occupied by GCs based on PNA-IHC in WT vs. LCR-deficient mice. D, Representative flow cytometry plots of WT and LCR-deficient mice (left panel), quantification for GCB (GL7+FAS+) (right panel). E, F, Representative flow cytometry plots of naïve B-cells (B220+, IgD+), follicular (B220+, CD23high) and marginal zone B-cells (B220+, CD21high). G, Representative images of H&E stained Heart and Lung sections from the WT and LCR-deficient mice. H, I, Bar plots depicting average weight of the mice and spleens in the WT and LCR-deficient groups. Data in B, C, D, E, F, G, H and I are representative from one of two replicate experiments with 5 WT littermates and 4 LCR-deficient mice. The data is shown as mean ± SEM. Significance is calculated by performing a two-tailed, unpaired t-test. P-values are listed wherever the difference is significant. See also Figure S6.

Comment in

References

    1. Apostolou E, Ferrari F, Walsh RM, Bar-Nur O, Stadtfeld M, Cheloufi S, Stuart HT, Polo JM, Ohsumi TK, Borowsky ML, et al. Genome-wide Chromatin Interactions of the Nanog Locus in Pluripotency, Differentiation, and Reprogramming. Cell Stem Cell. 2013;12:699–712. - PMC - PubMed
    1. Bai Y, Srinivasan L, Perkins L, Atchison ML. Protein acetylation regulates both PU.1 transactivation and Ig kappa 3' enhancer activity. J Immunol. 2005;175:5160–5169. - PubMed
    1. Baù D, Sanyal A, Lajoie BR, Capriotti E, Byron M, Lawrence JB, Dekker J, Marti-Renom MA. The three-dimensional folding of the α-globin gene domain reveals formation of chromatin globules. Nat Struct Mol Biol. 2011;18:107–114. - PMC - PubMed
    1. Bickmore WA, van Steensel B. Genome architecture: domain organization of interphase chromosomes. Cell. 2013;152:1270–1284. - PubMed
    1. Cantone I, Fisher AG. Epigenetic programming and reprogramming during development. Nat Struct Mol Biol. 2013;20:282–289. - PubMed

Publication types

MeSH terms

Substances