. 2016 Sep 20;45(3):669-684.
doi: 10.1016/j.immuni.2016.08.015. Epub 2016 Sep 13.

Unsupervised High-Dimensional Analysis Aligns Dendritic Cells across Tissues and Species

Affiliations

Unsupervised High-Dimensional Analysis Aligns Dendritic Cells across Tissues and Species

Martin Guilliams et al. Immunity. .

Abstract

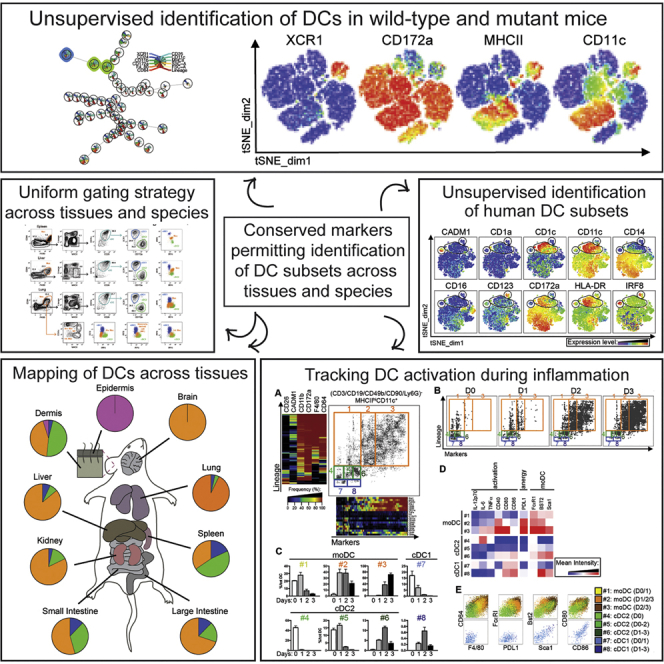
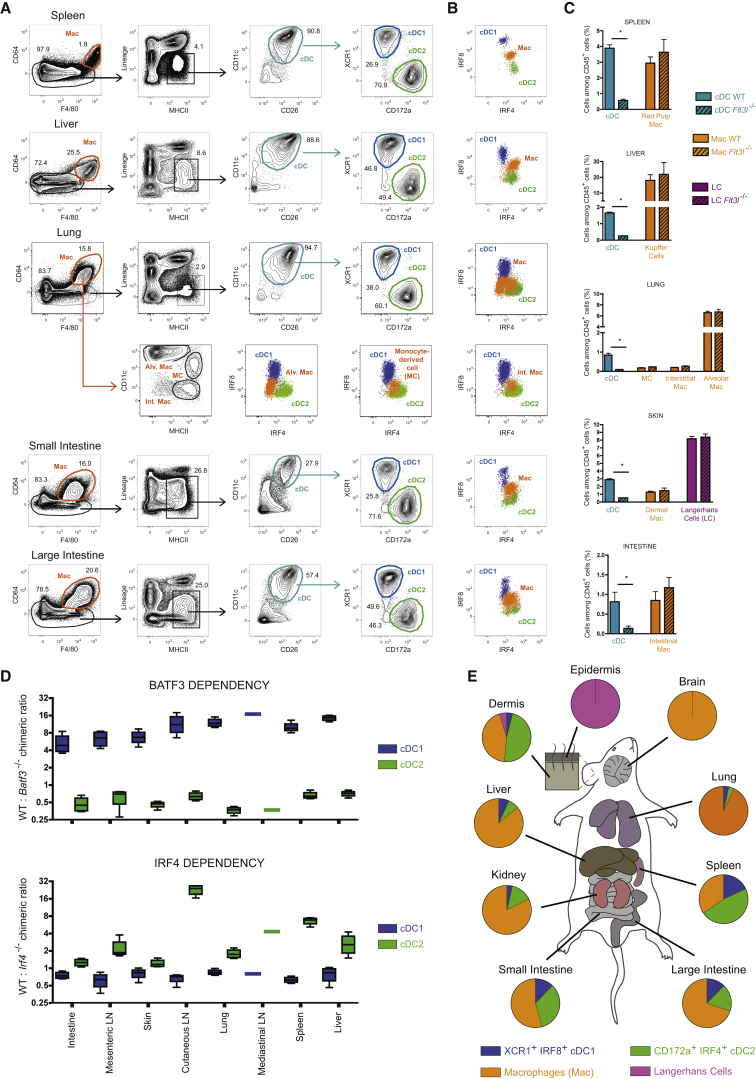
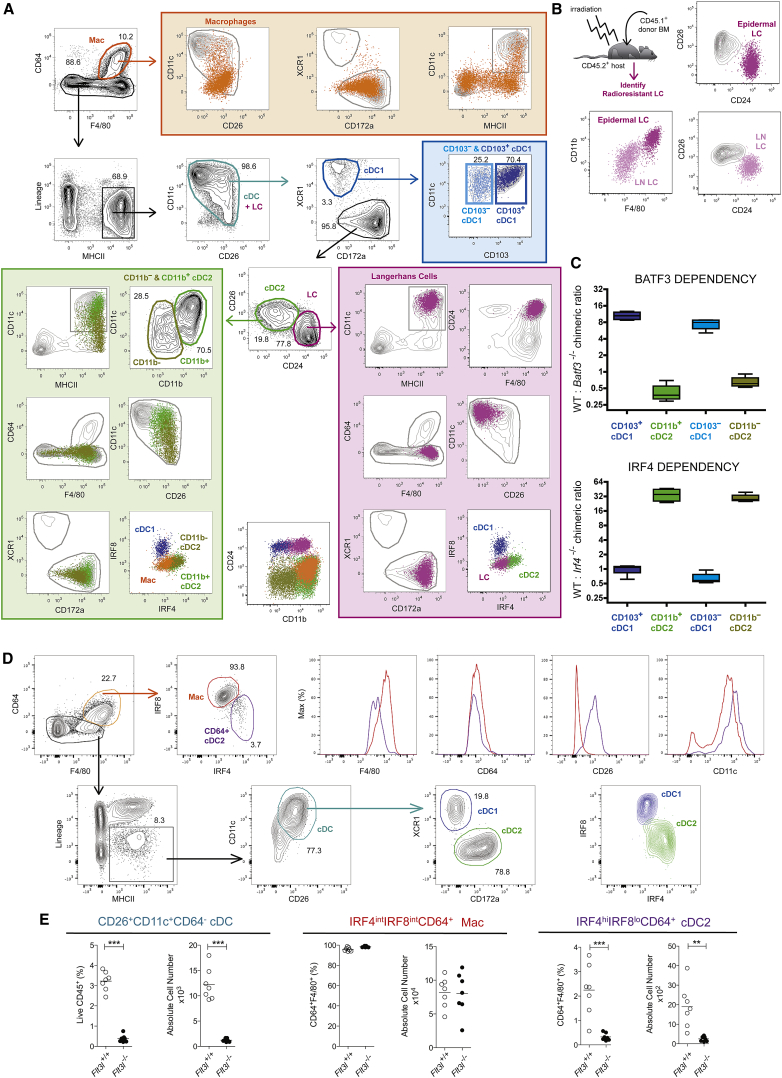
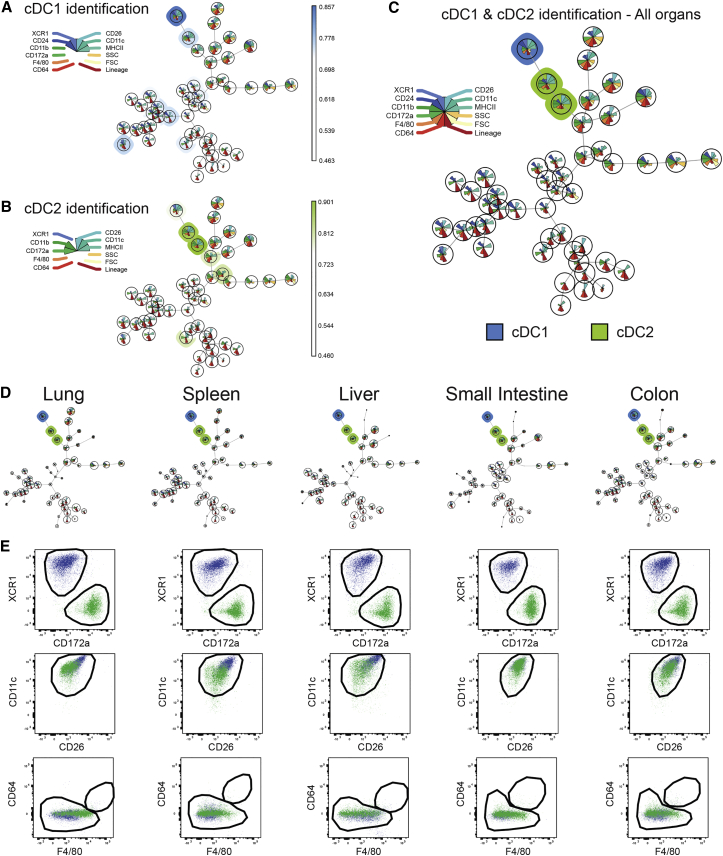
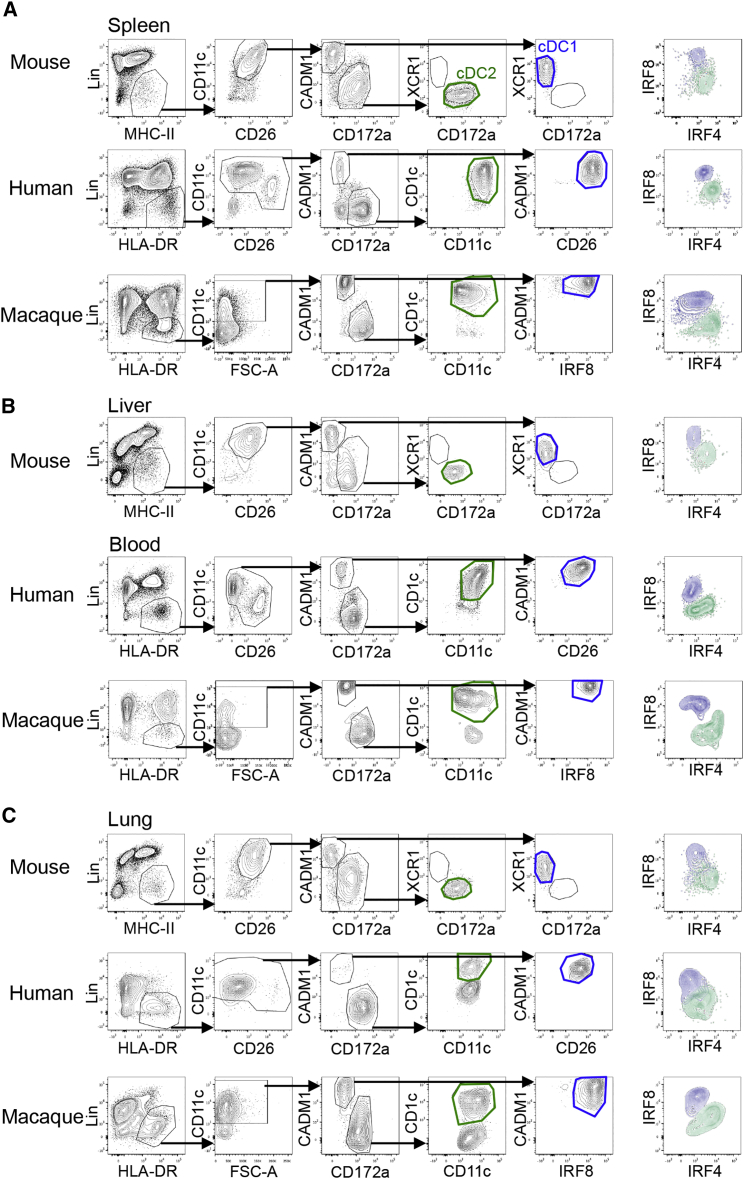
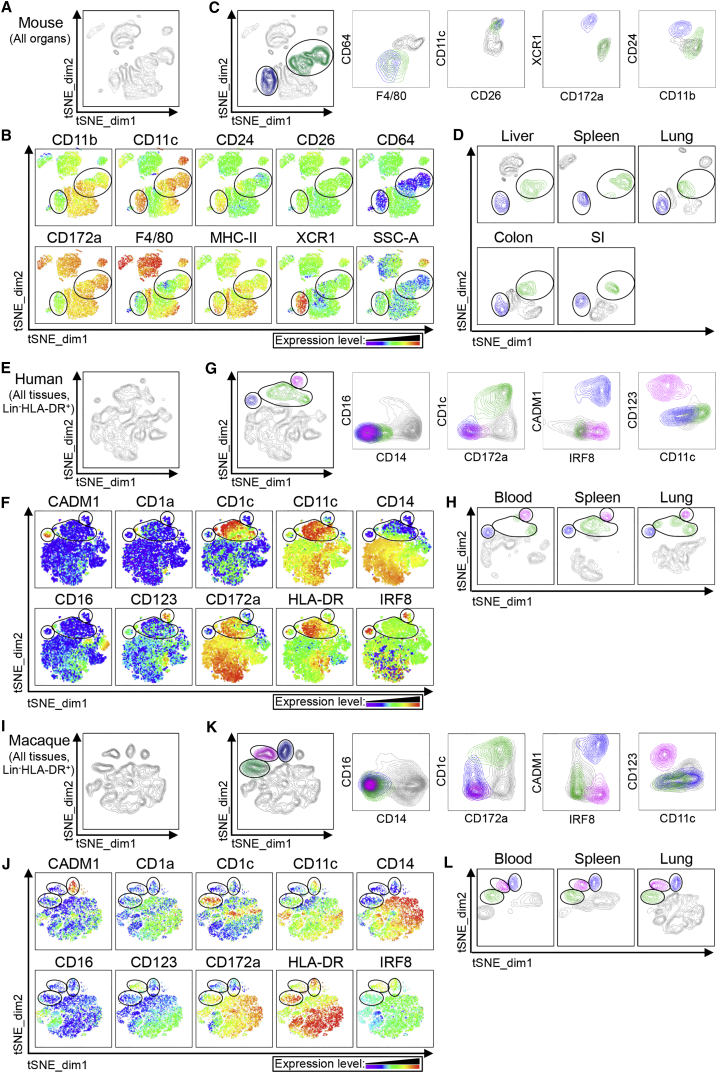
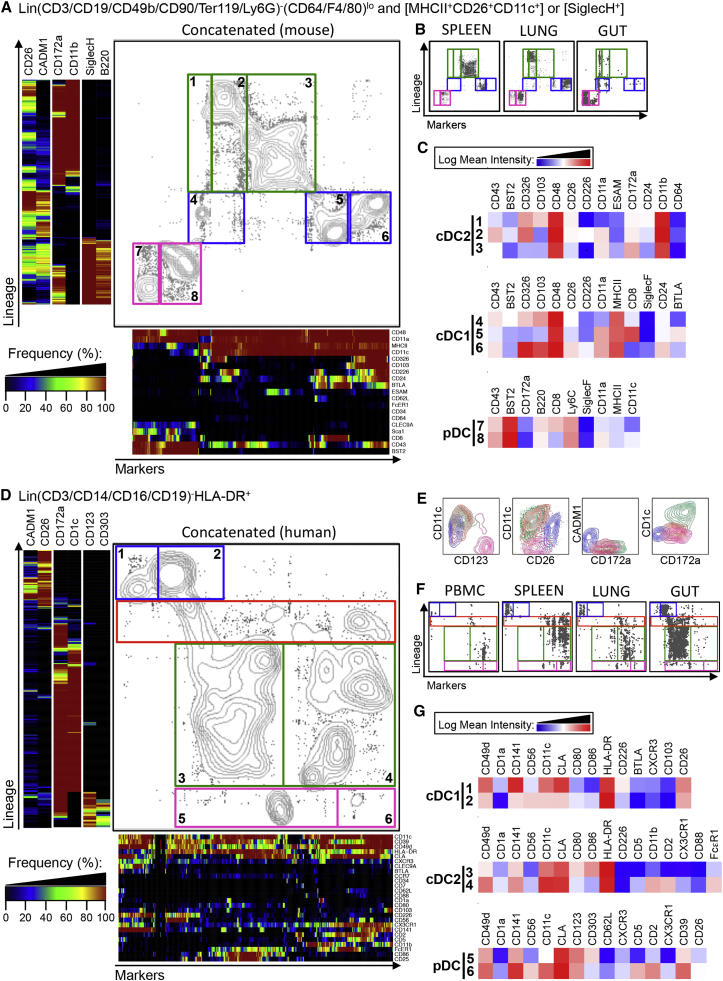
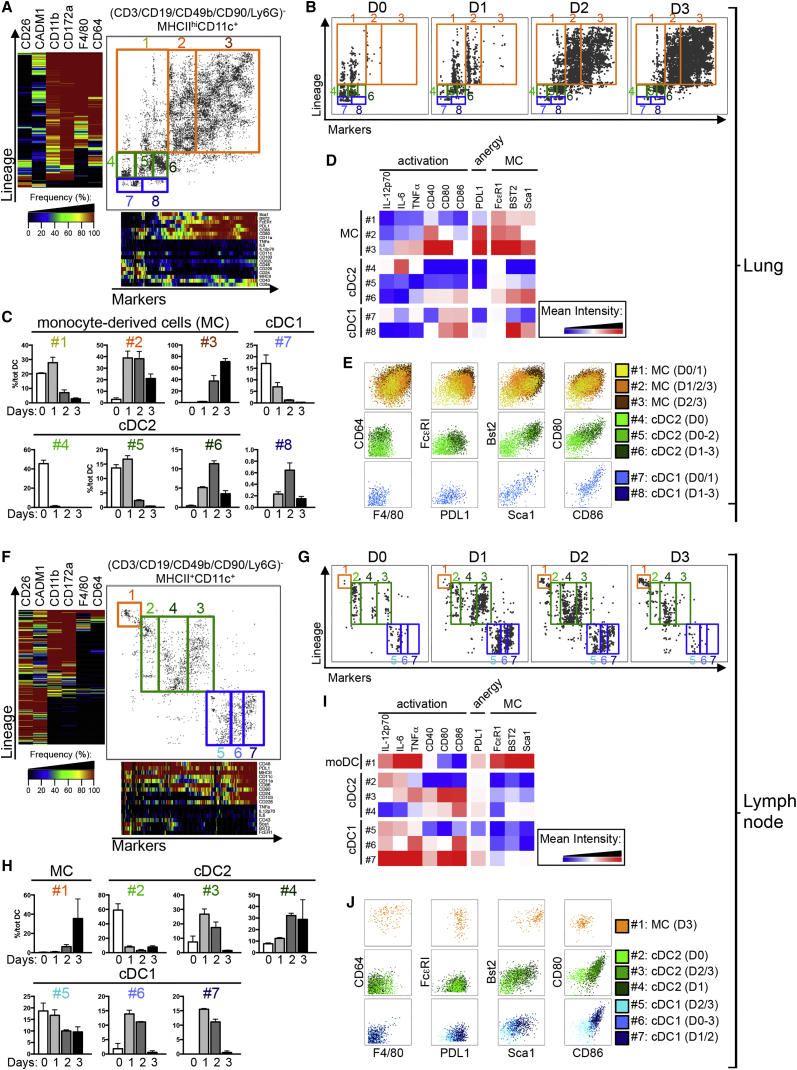
Dendritic cells (DCs) are professional antigen-presenting cells that hold great therapeutic potential. Multiple DC subsets have been described, and it remains challenging to align them across tissues and species to analyze their function in the absence of macrophage contamination. Here, we provide and validate a universal toolbox for the automated identification of DCs through unsupervised analysis of conventional flow cytometry and mass cytometry data obtained from multiple mouse, macaque, and human tissues. The use of a minimal set of lineage-imprinted markers was sufficient to subdivide DCs into conventional type 1 (cDC1s), conventional type 2 (cDC2s), and plasmacytoid DCs (pDCs) across tissues and species. This way, a large number of additional markers can still be used to further characterize the heterogeneity of DCs across tissues and during inflammation. This framework represents the way forward to a universal, high-throughput, and standardized analysis of DC populations from mutant mice and human patients.


Figures

Image 1
Graphical abstract
Figure 1
Figure 1
Identification of cDC1s and cDC2s across Mouse Tissues (A) Representative flow cytometry plots showing identification of CD64hiF4/80hi macrophages (orange gate), CD11chiCD26hi cDC (cyan gate), XCR1hiCD172alo cDC1 (blue gate), and XCR1loCD172ahi cDC2 (green gate) in the spleen, liver, lung, small intestine, and large intestine of wild-type (WT) mice (flow panel see Table S1). Cells were pre-gated as single live CD45+ cells. Lung CD64hiF4/80hi macrophages were subdivided in CD11chi alveolar macrophages, MHCIIhiCD11chi monocyte-derived cells (MC), and MHCIIhiCD11clo interstitial macrophages. (B) IRF8 and IRF4 expression of cDC1, cDC2, and macrophage (flow panel: see Table S2). (C) Relative numbers of cDCs and macrophages among CD45+ cells in the indicated tissues of WT and Flt3l−/− mice. See Figure 2 for the gating strategy utilized in the skin. (D) Competitive BM chimeric mice were generated by lethally irradiating CD45.1+CD45.2+ WT mice and reconstituting with a 50:50 mix of Batf3−/− or Irf4−/− CD45.2+ BM with WT CD45.1+ BM. The ratio between CD45.1+ and CD45.2+ is shown for cDC1s and cDC2s. (E) Piecharts of the proportion of cDC1s, cDC2s, macrophages, and LC across mouse tissues. Data are representative of three (A, B, C, E) or two (D) independent experiments, with at least three mice per group (C, D).  = p < 0.05. Please see Figure S1 for the profile of macrophages from the distinct tissues, and for the identification of pDCs.
Figure 2
Figure 2
Identification of cDC1 and cDC2 in the Murine Skin and Kidneys (A) Representative flow cytometry plots showing identification of CD64hiF4/80hi macrophages (orange gate), CD11chiCD26hi cDC (cyan gate), XCR1hiCD172alo cDC1 (blue gate), XCR1loCD172ahi cDC2 (green gate), and CD24hiCD26lo LC (purple gate) in the skin of WT mice (extracellular flow panel, see Table S1; intracellular IRF8-IRF4 panel, see Table S2). Cells were pre-gated as single live CD45+ cells. (B) BM chimeric mice were generated by lethally irradiating CD45.2+ WT mice and reconstituting with CD45.1+ BM. Radioresistant LC were identified as CD45.2+CD45.1 MHCIIhiCD11chi cells in the skin and the skin-draining auricular lymph nodes. The CD26-CD24, as well as the CD11b-F4/80 profile of skin (purple) and LN (pink) LCs, is shown. (C) Competitive BM chimeric mice were generated by lethally irradiating CD45.1+CD45.2+ WT mice and reconstituting with a 50:50 mix of Batf3−/− or Irf4−/− CD45.2+ BM with WT CD45.1+ BM. The ratio between CD45.1+ and CD45.2+ is shown for CD103hi and CD103lo cDC1s, as well as for CD11bhi and CD11blo cDC2s. Data are representative of three (A) and two independent experiments (B and C). (D) Representative flow cytometry plots showing identification of CD64+F4/80+ cells (orange gate), CD11c+CD26+ cDC (cyan gate), XCR1hiCD172alo cDC1 (blue gate), and XCR1loCD172ahi cDC2 (green gate) in the kidney of WT mice (extracellular flow panel see Table S1). Cells were pre-gated as single live CD45+. CD64+F4/80+ cells, cDC1s, and cDC2s were subsequently analyzed for expression of IRF4 and IRF8 (intracellular IRF8-IRF4 panel, see Table S2). Histograms show CD64, F4/80, CD26, and CD11c expression among CD64+F4/80+IRF4intIRF8int cells (red gate) and CD64hiF4/80hiIRF8loIRF4hi cells (purple gate). (E) Proportion (of Live CD45+) and absolute number of CD26+CD11c+CD64 cDCs (cyan gate), IRF4intIRF8intCD64+ cells (red gate), and IRF4hiIRF8loCD64+ cells (purple gate) in the kidneys of Flt3L+/+ and Flt3L−/− mice. ∗∗p < 0.01, ∗∗∗p < 0.001 Student’s t test. Data are representative of three (A) and two independent experiments (B–D) or are pooled from two independent experiments (E) with n = 7 per group. Please see Figure S2 for the use of FlowSOM to analyze mutant mouse strains automatically.
Figure 3
Figure 3
Unsupervised Identification of cDC1 and cDC2 across Mouse Tissues Using FlowSOM (A–C) Cells from the lungs, spleens, livers, small intestines, and colons from three WT mice were stained with the extracellular panel (Table S1). Single live CD45+ for each sample were exported and concatenated. This concatenated file was then analyzed using FlowSOM and cells were clustered into 49 nodes. To identify the node(s) corresponding to the cDC1s and cDC2s, we defined cDC1 as XCR1hiCD24hiCD26hiCD11chiMHCIIhiCD11bloCD172aloF4/80loCD64loLinloFSCloSSClo and cDC2 as CD11bhiCD172ahiCD26hiCD11chiMHCIIhiXCR1loF4/80loCD64loLinloFSCloSSClo. A score indicating the correspondence with the requested cell profile was then attributed to each node in the FlowSOM tree. (C) All nodes with a final score of at least 0.95 times the highest score were selected as fitting the requested profile, yielding one cDC1 node (blue) and two cDC2 nodes (green). (D) FlowSOM trees for each tissue separately. (E) The cells present in the cDC1 and cDC2 nodes of the distinct tissues were exported and manually analyzed for their XCR1, CD172a, CD11c, CD26, CD64, and F4/80 expression. The black gates correspond to the manual gates used in Figure 1. The data shown are representative of two independent experiments. The FlowSOM algorithm was run five times to ensure reproducibility of the results. Please see Figure S3 for the use of FlowSOM and tSNE to analyze mutant mouse strains automatically.
Figure 4
Figure 4
Defining cDC Subsets in Mouse, Human, and Macaque Using Similar Gating Strategies in Different Tissues (A) Representative flow cytometry plots showing identification of cDC1 (blue gate) and cDC2 (green gate) in mouse, human, and macaque spleens. (B) Representative flow cytometry plots showing identification of cDC1s (blue gate) and cDC2s (green gate) in the mouse liver and peripheral human and macaque blood. (C) Representative flow cytometry plots showing identification of cDC1 (blue gate) and cDC2 (green gate) in mouse, human, and macaque lungs. Macs were outgated using CD64-F4/80 for mouse tissues and CD14-CD16 for human and macaque tissues (see Figure S4). Among CADM1loCD172ahi cells, cDC2 were validated as XCR1lo cells in mouse tissues. Human and macaque cDC2s were gated as CD11chiCD1chi among CADM1loCD172ahi cells to avoid contamination of CD11chiCD1clo cells (see Figure S5). CADM1hiCD172alo cells were further analyzed for the expression of XCR1 (mouse), CD26 (human), and IRF8 (macaque) to validate the correct cDC1 identification. For each organ, the IRF8-IRF4 profiles of cDC1 (blue) and cDC2 (green) are shown. Data are representative of at least three independent experiments using cells from different individuals. Please see Figure S4 for the gating strategies.
Figure 5
Figure 5
tSNE Analysis of Flow Cytometry Data from LineageMHCII+ Cells across Mouse, Human, and Macaque Tissues Unsupervised analysis of single live CD45+LinMHCIIhi events from the flow cytometry data of (A–D) mouse liver, spleen, and lung and (E–H) human or (I–L) macaque blood, spleen, and lung using nonlinear dimensionality reduction in conjunction with the t-distributed stochastic linear embedding (tSNE) algorithm. (A, E, and I) tSNE plot of concatenated above-cited organs are shown. (B, F, and J) The heatmaps of the selected markers on the concatenated tSNE plots are used to define the clusters of cells (circled) that display the phenotype of cDC1, cDC2 or pDC (only for human and macaque). (C, G, and K) Backgating of the cDC1 (blue), cDC2 (green), and pDC (pink) clusters defined in the tSNE plots into classical flow cytometry dot plots. (D, H, and L) tSNE plots obtained for each individual (D) mouse, (H) human, or (L) macaque organs. Please see Figure S5 for analysis of the contaminating CD11chiCD1clo CADM1loCD172ahi cells and identification of cDCs in the human and macaque skin.
Figure 6
Figure 6
One-SENSE Unsupervised Analysis of CyTOF Data to Simultaneously Define DC Subsets and Their Heterogeneity across Mouse and Human Tissues LinMHCII+CD26+CD11c+ or SiglecH+ events from mouse (A–C) and LinHLADR+ events from human (D–G) from CyTOF data from mouse spleen, lung, and intestine (A–C) and human blood, spleen, lung, and intestine (D–G) were analyzed using nonlinear dimensionality reduction in conjunction with the One-SENSE algorithm. (A and B) The lineage dimension of the mouse One-SENSE plots includes CADM1 and CD26 as cDC1 markers, CD172a and CD11b as cDC2 markers, and Siglec-H and B220 as pDC markers. (D and F) The lineage dimension of the human One-SENSE plots includes CADM1 and CD26 as cDC1 markers, CD1c and CD172a as cDC2 markers, and CD123 and CD303 as pDC markers. The markers dimension includes all the other non-lineage markers of the CyTOF panels. Frequency heatmaps of markers expression are displayed for both dimensions. cDC1 clusters (delineated in blue), cDC2 clusters (delineated in green), pDC clusters (delineated in pink), and for human, CD172aloCD1clo contaminating myeloid cell clusters (orange), are shown on the concatenated files containing the cells from all organs (A and D) and on the individual plots for each organ (B and F). (E) Classical contour plots showing the expression of CD123, CD11c, CD26, CD172a, CADM1, and CD1c of cDC1 (blue), cDC2 (green), pDC (pink), and CD172ahiCD1clo cells (orange). (C and G) Heatmaps of the mean expression intensity of selected markers for the different clusters are shown. The numbers in (C and G) correspond to each of the clusters shown in the analysis of the file containing the concatenated cells from all organs (A and D). Please see Figure S6 for classical contour plots, histograms of the mouse surface markers, and histograms of the human surface markers.
Figure 7
Figure 7
One-SENSE Unsupervised Analysis of CyTOF Data Unravels the Cellular Dynamics in the Lung and Its Draining Lymph Nodes following Intranasal LPS Administration Analysis of (CD3-D19-CD49b-CD90-Ly6G) MHCIIhiCD11c+ cells from the lung (A–D) and corresponding draining lymph node (F–J) of mice (n = 2 per group) prior to (D0) or at D1, D2, or D3 post intranasal LPS treatment were analyzed using CyTOF and nonlinear dimensionality reduction in conjunction with the One-SENSE algorithm. (A, B, F, and G) The lineage dimension of the One-SENSE plots includes CADM1 and CD26 as cDC1 markers, CD172a and CD11b as cDC2 markers, and F4/80 and CD64 as monocyte-derived cell markers. The markers dimension includes other non-lineage markers of the CyTOF panel. Frequency heatmaps of markers expression are displayed for both dimensions. cDC1 (delineated in blue), cDC2 (delineated in green), and monocyte-derived cells (MC, delineated in orange) clusters are shown on the concatenated files containing the cells from both organs (A and F) and on the individual plots for each time point (B and G). (C and H) Histograms of the proportion of each cluster are shown among total DCs. (D and I) Heatmaps of the mean expression intensity of selected markers for the different clusters are shown. The numbers in (D and I) correspond to each of the clusters shown in the analysis of the file containing the concatenated cells from all organs (A and F). (E and J) Classical contour plots showing the expression of F4/80, CD64, PDL1, FcεRI, Sca1, Bst2, CD86, and CD80 of all clusters. Please see Figure S7 for the CD11c-MHCII gates and for classical dotsplots of the distinct populations.

Comment in

  • Dendritic cells: Sorting, sorted!
    Bordon Y. Bordon Y. Nat Rev Immunol. 2016 Nov;16(11):657. doi: 10.1038/nri.2016.115. Epub 2016 Oct 17. Nat Rev Immunol. 2016. PMID: 27748396 No abstract available.

References

    1. Bain C.C., Scott C.L., Uronen-Hansson H., Gudjonsson S., Jansson O., Grip O., Guilliams M., Malissen B., Agace W.W., Mowat A.M. Resident and pro-inflammatory macrophages in the colon represent alternative context-dependent fates of the same Ly6C(hi) monocyte precursors. Mucosal Immunol. 2012;6:498–510. - PMC - PubMed
    1. Bajaña S., Roach K., Turner S., Paul J., Kovats S. IRF4 promotes cutaneous dendritic cell migration to lymph nodes during homeostasis and inflammation. J. Immunol. 2012;189:3368–3377. - PMC - PubMed
    1. Becher B., Schlitzer A., Chen J., Mair F., Sumatoh H.R., Teng K.W., Low D., Ruedl C., Riccardi-Castagnoli P., Poidinger M. High-dimensional analysis of the murine myeloid cell system. Nat. Immunol. 2014;15:1181–1189. - PubMed
    1. Breton G., Lee J., Zhou Y.J., Schreiber J.J., Keler T., Puhr S., Anandasabapathy N., Schlesinger S., Caskey M., Liu K., Nussenzweig M.C. Circulating precursors of human CD1c+ and CD141+ dendritic cells. J. Exp. Med. 2015;212:401–413. - PMC - PubMed
    1. Caton M.L., Smith-Raska M.R., Reizis B. Notch-RBP-J signaling controls the homeostasis of CD8- dendritic cells in the spleen. J. Exp. Med. 2007;204:1653–1664. - PMC - PubMed

Publication types