Review
. 2016 Oct;27(4):409-39.
doi: 10.1016/j.nec.2016.05.011. Epub 2016 Aug 10.

Imaging Evaluation of Acute Traumatic Brain Injury

Affiliations
Review

Imaging Evaluation of Acute Traumatic Brain Injury

Christopher A Mutch et al. Neurosurg Clin N Am. 2016 Oct.

Abstract

Traumatic brain injury (TBI) is a major cause of morbidity and mortality worldwide. Imaging plays an important role in the evaluation, diagnosis, and triage of patients with TBI. Recent studies suggest that it also helps predict patient outcomes. TBI consists of multiple pathoanatomic entities. This article reviews the current state of TBI imaging including its indications, benefits and limitations of the modalities, imaging protocols, and imaging findings for each of these pathoanatomic entities. Also briefly surveyed are advanced imaging techniques, which include several promising areas of TBI research.

Keywords: CT; Imaging; MRI; TBI; Traumatic brain injury.


Figures

Figure 1
Figure 1. Evaluation of neonatal traumatic brain injury with ultrasound and radiographs
AP skull radiograph (A) and coronal ultrasound images (B,C) in a newborn reveal a traumatic injury suffered during a difficult forceps delivery. Skull radiograph (A) reveals a fracture of the parietal calvarium (arrowhead) as well as scalp soft tissue swelling compatible with a subgaleal hematoma (asterisk). High frequency (10 MHz) ultrasound of the scalp (B) with a linear transducer shows the extracranial subgaleal hematoma in better detail (asterisk) and again demonstrates the fracture (arrowhead). By positioning a lower frequency (6 MHz) vector transducer over a fontanel, images of the brain parenchyma and superior extra-axial spaces are obtained (C). These reveal a biconvex extra-axial collection (arrow) along the right parietal convexity, consistent with an epidural hematoma. While ultrasound and radiographs generally do not play a role in the evaluation of TBI, they can be useful for problem solving in limited pediatric imaging scenarios.
Figure 2
Figure 2. Occipital fracture complicated by transverse sinus injury
42-year-old man presents after fall with impact to the back of the head. Noncontrast head CT viewed at bone window technique (A,B) reveals a nondisplaced, linear right occipital fracture (arrows) adjacent to the expected location of the right transverse sinus. Therefore, a CT venogram was subsequently performed to evaluate for venous sinus injury. Note the thrombus, manifested as unopacified flow within the right transverse sinus (C, arrows) that extends into the right sigmoid sinus and the right jugular vein (D, white arrow.) The normal left jugular vein (D, black arrow) is shown for comparison.
Figure 3
Figure 3. CT and MR appearance of epidural hematoma
Noncontrast CT (A,B) performed on a 26-year-old man who was “found down” with altered mental status. Note the classic biconvex hyperdense epidural hematoma with an overlying nondisplaced calvarial fracture (arrows). Axial T2WI (C) from a “rapid” MR protocol in a different patient (3-month-old accidentally dropped on her head) reveals a right parietal biconvex low signal epidural collection. Note the position of the dura, seen as the thin black line deep to the collection (arrows); this allows confident determination that the collection is located in the epidural space. Sagittal (D) and axial (E) reformatted images from a noncontrast CT performed in a different patient (13-year-old male after a skateboard accident) show a heterogeneous epidural hematoma in the occipital region. Areas of lower density within the hematoma likely represent hyperacute unclotted blood concerning for active bleeding and predictive of continued expansion of the hematoma. This is confirmed on the CTA of the head performed minutes later (F) where dense contrast material extravasates (F, arrow) into the area of low density on the earlier noncontrast study (E, arrow). The sagittal reformatted images (D) best demonstrate how the hematoma crosses the plane of the tentorium cerebelli (arrow) into the posterior fossa, characteristic of epidural hematomas (unlike subdural hematomas) as they are not constrained by dural boundaries. In contrast to arterial epidural hematomas, venous epidural hematomas bleed under lower pressure and are therefore less likely to increase in size. Noncontrast CT (G), axial FLAIR (H) and sagittal T1WI (I) performed on a 52-year-old victim of assault reveal a right sphenoparietal venous epidural hematoma (arrows). CT on the day of the injury (G) shows the characteristic well-defined, crescentic, high-density extra-axial collection (white arrow) along the anterior margin of the middle cranial fossa. On MRI performed 2 days later (H,I), the same venous epidural hematoma (arrow) appears isointense to adjacent anterior temporal contusion on FLAIR (H) and hyperintenseT1WI (I), consistent with intracellular methemoglobin blood products and it has not increased in size. In cases of trauma, multiple pathologic entities often are seen in the same examination. Notably, foci of subarachnoid hemorrhage (white arrowhead) and temporal lobe contusions (black asterisk) are much more visible on MRI (H) than CT. In contrast to arterial epidural hematomas, venous epidural hematomas bleed under lower pressures and are less likely to expand. Noncontrast CT (G), axial FLAIR (H) and sagittal T1WI (I) performed on a 52-year-old victim of assault reveal a right sphenoparietal venous epidural hematoma (arrows). CT on the day of the injury (G) shows a characteristic lobular high-density extra-axial collection (white arrow) along the anterior margin of the middle cranial fossa. On MRI performed 2 days later (H,I), the same venous epidural hematoma is seen adjacent to an anterior temporal contusion (H (I). In cases of trauma, multiple pathologic entities often are seen in the same examination. Notably, linear foci of subarachnoid hemorrhage (white arrowhead) and temporal lobe contusion (asterisk) are much more visible on MRI (H) than CT (G).
Figure 4
Figure 4. CT and MR appearance of subdural hematomas
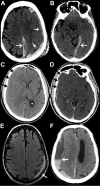
Noncontrast CT (A,B) performed on a 90-year-old female after fall with left parietal scalp laceration reveals hyperdense blood along the left convexity (A, closed arrows), left posterior falx cerebri (A, open arrow), and tentorium cerebelli (B, open arrow). Note how the subdural hematomas do not cross the dural sinuses to the other side of the falx or tentorium. Noncontrast CT performed on an 82-year-old man after falling shows a right convexity subacute subdural hematoma that is isodense to the adjacent cortex (C, arrows). Post-contrast imaging is generally not required for evaluation of a subdural hematoma; however, it was obtained in this case. The post-contrast CT (D, arrows) images demonstrate peripheral enhancement of the collection without evidence of active extravasation, thus reinforcing a subacute injury. Axial FLAIR MR image (E) from a 69-year-old man after head trauma exemplifies the high contrast difference on MR between the FLAIR hyperintense subdural hematoma (arrow) and the adjacent hypointense calvarium. Axial noncontrast CT (F) from a different patient, a 73-year-old man with left-sided weakness, shows the appearance of a mixed-density, “acute-on-chronic” subdural hematoma along the right convexity and falx cerebri. Note the dependent layering of the acute, denser blood products within the chronic, hypodense collection; this is often referred to as the “hematocrit sign” (arrow).
Figure 5
Figure 5. CT and MR appearance of subarachnoid hemorrhage
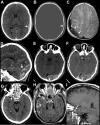
MRI (A-E) performed on a 58-year-old man who presented 3 days after a fall with altered mental status. Subacute subarachnoid hemorrhage appears hyperintense to brain on T1WI (A) and hypointense on T2WI (B). Subarachnoid hemorrhage does not suppress like normal CSF on FLAIR imaging (C) and it appears markedly hypointense on SWI (D). The linear area of reduced diffusion in the cortex adjacent to the subarachnoid hemorrhage likely represents adjacent cerebral contusion (E). This is a good example showing the appearance of early subacute subarachnoid blood products within the central sulcus on multiple pulse sequences (arrows). Noncontrast CT (F) from a 70-year-old male after syncope and fall with head injury shows the classic appearance of acute subarachnoid hemorrhage in the right sylvian fissure (arrow). Noncontrast CT (G) and FLAIR (H) images obtained the same day in a 33-year-old female after a motor vehicle crash. The trace interpeduncular subarachnoid hemorrhage (arrow) is invisible on CT (G), but is readily apparent on MR (H), highlighting the greater sensitivity of MR to blood products.
Figure 6
Figure 6. Imaging evaluation of patients with CSF leaks
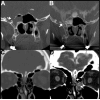
Coronal reformatted images from a noncontrast CT (A,C) and CT cisternograms (B,D) performed in 2 different patients with posttraumatic CSF leaks. The first patient (A,B) is a 55-year-old female with a history of remote trauma and meningitis. Note the opacified right sphenoid sinus with a large bony defect between the lateral wall of the right sphenoid sinus and the middle cranial fossa (A, arrow). CT cisternography was performed (B), confirming abnormal leakage of CSF contrast from the middle cranial fossa into the sphenoid sinus. The second patient (C,D) is a 33-year-old female with CSF rhinorrhea (confirmed with positive B2-Transferrin test) after facial trauma. Noncontrast CT (C) reveals subtle unilateral opacification of the left olfactory recess concerning for a possible cephalocele, but it did not show a definitive bony abnormality in that region. The patient returned two weeks later and a CT cisternogram was performed (D) revealing abnormal passage of CSF contrast (arrows) through the left cribiform plate through the left olfactory recess and into the nasal cavity.
Figure 7
Figure 7. CT and MR appearance of cerebral and cerebellar contusion
Noncontrast CT (A-C) and FLAIR and susceptibility-weighted MR (D-G) images obtained on a 59-year-old woman after a fall that occurred 5 days earlier. CT images show a nondisplaced left occipital fracture (C, arrow) with an underlying hemorrhagic contusion in the left cerebellar hemisphere (B, closed arrow) compatible with coup injury. There are also large, bifrontal, hemorrhagic contusions (A, closed arrows) and a small left anterior temporal hemorrhagic contusion (B, open arrow), compatible with contrecoup injuries. These lesions have a predictable appearance on MR with low signal on SWI (F, closed arrows; G, arrows) and a large area of surrounding edema on FLAIR images (D,E). Also note the increased prominence of the left tentorial subdural hematoma (open arrow) on MR SWI (F) compared to CT (A).
Figure 8
Figure 8. CT and MR appearance of intracerebral hematoma
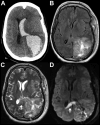
Noncontrast CT (A) of 61-year-old male after head trauma reveals a large, hyperdense, acute left parietal hematoma with surrounding edema that has decompressed into the adjacent left lateral ventricle (intraventricular hemorrhage). MRI performed 11 days later (B-D) shows decreased edema with residual T2 hyperintense blood products (likely corresponding to “late subacute” extracellular methemoglobin). Increased T2 signal intensity (C) and reduced diffusion (D) in the splenium of the corpus callosum (arrows) is likely a result of Wallerian degeneration of the axons leading away from the left parietal injury, and not traumatic axonal injury of the splenium.
Figure 9
Figure 9. CT and MR appearance of traumatic axonal injury
Initial noncontrast CT (A) of a 24-year-old female after a helmeted bicycle accident with brief loss of consciousness shows right periorbital soft tissue swelling, but is otherwise normal. MRI (including T2*-weighted MPGR (B), DWI (C) and ADC map (D) obtained the following day shows scattered foci of reduced diffusion and increased susceptibility, compatible with traumatic axonal injuries. Example lesions include a focus of reduced diffusion (C, arrow) with low ADC value (D, arrow) and foci of increased susceptibility (B, arrow) in the left temporal stem subcortical white matter. A different patient presented after an assault (E-H). This patient's noncontrast CT shows multiple areas of hemorrhagic axonal shearing injury involving the splenium of the corpus callosum (E, arrow). This area shows reduced diffusion (G, arrow), low ADC value (H, arrow) and increased susceptibility on MPGR (F, arrow) on MRI performed the same day. The coronal MPGR image (F) also reveals numerous additional white matter shear injuries (low signal) compatible with diffuse axonal injury.
Figure 10
Figure 10. MR appearance of Grade 3 diffuse axonal injury
MPGR (A,B), DWI (C), and ADC map MR images of a 23-year-old man with head trauma after a motorcycle accident. MPGR images reveal foci of susceptibility in the subcortical white matter of the parietal (open arrow, A) and temporal lobes (closed arrow, B) as well as infratentorial injury to the bilateral superior cerebellar peduncles (closed arrows, A) and midbrain and cerebral peduncle (open arrow, B) secondary to traumatic axonal injury. There are also extra-axial foci of susceptibility along the falx compatible with a subdural hematoma (A,B). DWI (C) and ADC map (D) from the same patient reveal marked reduced diffusion in the genu and splenium (closed arrows) of the corpus callosum also consistent with a combination of Wallerian and axonal injury. Note how the entire right frontal lobe white matter shows abnormal reduced diffusion (open arrow in C,D), with a more focal insult to the anterior subinsular region.
Figure 11
Figure 11. CT and MR appearance of brainstem injury with diffuse axonal injury
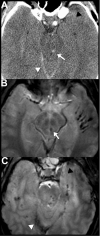
Axial noncontrast CT (A) and T2*-weighted MPGR MR (B,C) images of 27-year-old man reveal posttraumatic brainstem injury. Hemorrhagic axonal injury in the midbrain tegmentum appears as rounded hyperdensity on CT (A, arrow) and as a focal area of susceptibility on MPGR sequence (B, arrow). Caudally, an axial MPGR image through the pons (C) reveals multiple additional foci of susceptibility in the dorsal pons that were not apparent on CT. Numerous additional foci of abnormal susceptibility (B,C) are present in the bilateral temporal supratentorial and infratentorial white matter consistent with diffuse axonal injury. Also note traumatic injuries including a right tentorial subdural hematoma (white arrowheads) and a left anterior temporal contusion (black arrowheads), which are better appreciated on MR (C) than CT (A).
Figure 12
Figure 12. Secondary traumatic brain injuries in patients with TBI
Axial noncontrast CT images (A-C) from an 80-year-old female reveal left convexity holohemispheric and parafalcine subdural hematomas. Secondary complications resulting from mass effect from the hematomas include left to right midline shift (arrow shows position of the septum pelucidum) with subfalcine herniation (A), left uncal and downward transtentorial herniation (B,C), trapping of the temporal horn (asterisk) of the right lateral ventricle secondary to obstruction of the foramen of Monro (B,C), and a Duret hemorrhage in the midbrain (B) and pons (C). Images from a different patient show secondary complications in a 74-year-old female after TBI. The preoperative noncontrast CT (D) images demonstrate mass effect from a right holohemispheric subdural hematoma resulting in right uncal herniation and trapping of the temporal horn of the left lateral ventricle. The right temporal horn is nearly midline in location (asterisk. The post-operative noncontrast CT obtained later that evening (E) reveals a decompressive craniectomy, ventricular drain placement, and a new large hypodensity involving the territory of the right posterior cerebral artery (PCA) vascular territory, consistent with infarction. Diffusion weighted MRI (F) obtained 4 days after initial injury confirms the right PCA territory infarct, secondary to compression of the proximal PCA by the previously herniated right uncus.
Figure 13
Figure 13. Traumatic vascular dissection of the supraclinoid internal carotid artery
CTA (A) performed the day after injury shows asymmetric narrowing and luminal irregularity of the left internal carotid artery (ICA) (arrow) just beyond the anterior clinoid process concerning for traumatic dissection. Note the air-hemorrhage level within the left sphenoid sinus (A) which should raise suspicion anterior skull base fracture (not shown) and potential injury to the adjacent carotid artery. Dissection of the left supraclinoid ICA was confirmed the same day on digital subtraction angiography (B), which again revealed an irregular, narrowed lumen (arrow). Time of flight MR angiogram (C) performed 3 days after injury shows a narrowed irregular lumen of the left supraclinoid ICA (arrow). T1WI (D) from the same examination reveals subtle T1-shortening (arrow) in the left ICA wall, consistent with early subacute methemoglobin blood products within a dissecting intramural hematoma. Noncontrast CT (E) and diffusion weighted MRI (F) obtained 2 and 3 days after injury, respectively, show that the patient's dissection was complicated by an acute left middle cerebral artery territory embolic infarction.
Figure 14
Figure 14. Postraumatic pseudoaneurysm
This 43-year-old man presented with headache and visual symptoms 3 months after suffering facial fractures in a motor vehicle accident. Noncontrast CT reveals a large hyperdense mass (arrows) within the anterior skull base (A) eroding the sphenoid bone, sella and the orbits (arrow) (B). Sagittal reformatted CT angiography images performed the same day show the central area of the mass enhancing (asterisk) to the same extent as the adjacent intracranial arteries (C). In addition, there is an apparent narrow-necked connection (arrow) between the enhancing portion and the left cavernous internal carotid artery (D), consistent with a pseudoaneurysm. Note that the central low density (A, asterisk) within the higher density, thrombosed portion of the pseudoaneurysm correlates with the central nonthrombosed, enhancing area (E, arrow) on the postcontrast images. 3D reformatted images of the circle of Willis (F) highlight the relationship of the pseudoaneurysm (asterisk); note that only the nonthrombosed portion is visualized) to the left internal carotid artery (arrow). Catheter angiography images following injection of the left internal carotid artery show the appearance of the pseudoaneurysm (asterisk) before (G) and after (H) treatment with endovascular coil embolization.
Figure 15
Figure 15. Cerebral Fat Embolism Syndrome (CFES) as a mimic of DAI:
65 year old woman with progressive lethargy and coma in setting of multiple bone infarcts and cerebral fat embolism syndrome confirmed on autopsy. Axial FLAIR (A, B) and diffusion (C, D) weighted images demonstrate confluent FLAIR hyperintense white matter signal abnormality with relatively little diffusion signal abnormality, which is isolated to the splenium of the corpus callosum. Axial susceptibility-weighted imaging (E-H) reveal innumerable foci of susceptibility artifact throughout the infratentorial and supratentorial brain consistent with a pattern of cardio-embolic showering with resultant micro-hemorrhages. In comparison, axial DWI (I, J) from a brain MRI performed on a 42 year old man 7 days after a motor vehicle collision shows clustered, confluent foci of reduced diffusion most prominent in the right juxta-cortical frontal lobe and splenium of the corpus callosum related to DAI. T2* weighted gradient echo sequences (K, L) reveal asymmetric clustered foci of susceptibility artifact in the right greater than left juxtacortical frontal lobe white matter (arrow in K) and dorsal pontomedullary junction near the left superior cerebellar peduncle (arrow in L). Compared with CFES, susceptibility artifact secondary to DAI tends to be more sparse, clustered, and irregular in distribution. In addition, CFES more commonly affects the cerebellum.

References

    1. Faul MD, Xu L, Wald MM, et al. Traumatic Brain Injury in the United States: Emergency Department Visits, Hospitalizations and Deaths 2002–2006. Centers for Disease Control and Prevention, National Center for Injury Prevention and Control; Atlanta (GA): 2010.
    1. Menon DK, Schwab K, Wright DW, et al. Position Statement: Definition of Traumatic Brain Injury. Archives of physical medicine and rehabilitation. 91(11):1637–1640. - PubMed
    1. Cornelius C, Crupi R, Calabrese V, et al. Traumatic brain injury: oxidative stress and neuroprotection. Antioxidants & redox signaling. 2013;19(8):836–853. - PubMed
    1. Readnower RD, Chavko M, Adeeb S, et al. Increase in blood–brain barrier permeability, oxidative stress, and activated microglia in a rat model of blast-induced traumatic brain injury. Journal of Neuroscience Research. 2010;88(16):3530–3539. - PMC - PubMed
    1. Hawryluk GWJ, Manley GT. Chapter 2 - Classification of traumatic brain injury: past, present, and future. In: Jordan G, Andres MS, editors. Handbook of Clinical Neurology. Vol. 127. Elsevier; 2015. pp. 15–21. - PubMed

MeSH terms