. 2017 Mar 15;23(6):1607-1620.
doi: 10.1158/1078-0432.CCR-15-1615. Epub 2016 Sep 16.

Mutant p53 Together with TGFβ Signaling Influence Organ-Specific Hematogenous Colonization Patterns of Pancreatic Cancer

Affiliations

Mutant p53 Together with TGFβ Signaling Influence Organ-Specific Hematogenous Colonization Patterns of Pancreatic Cancer

Yi Zhong et al. Clin Cancer Res. .

Abstract

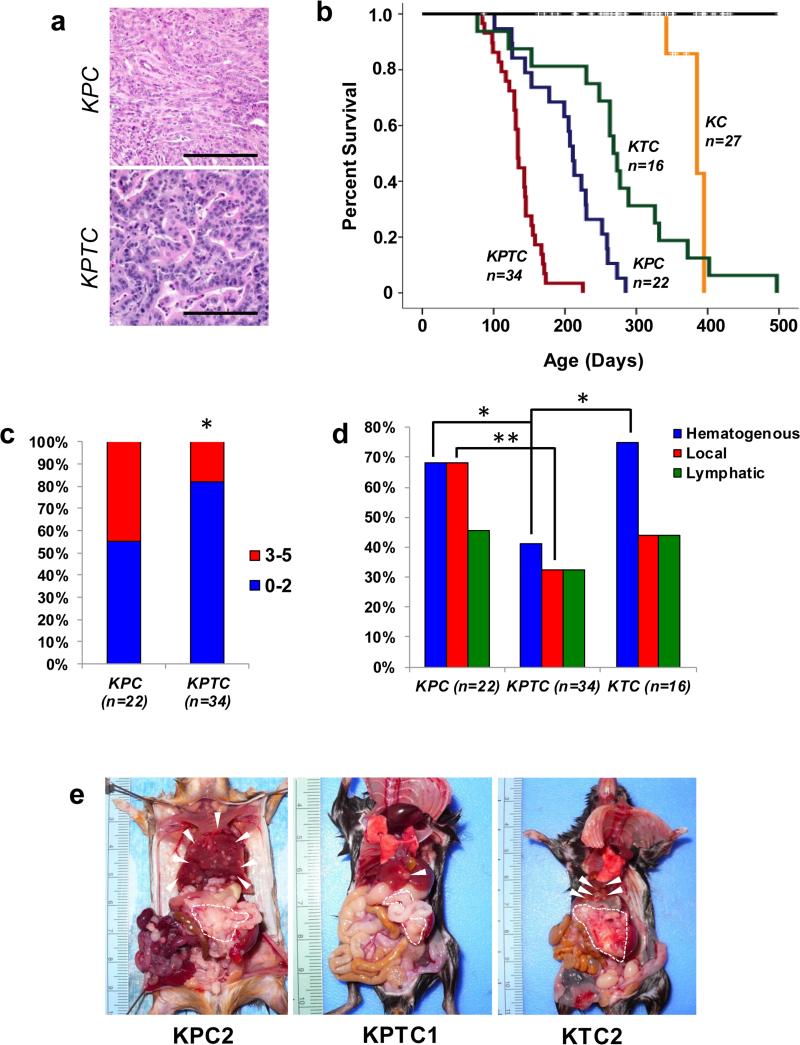
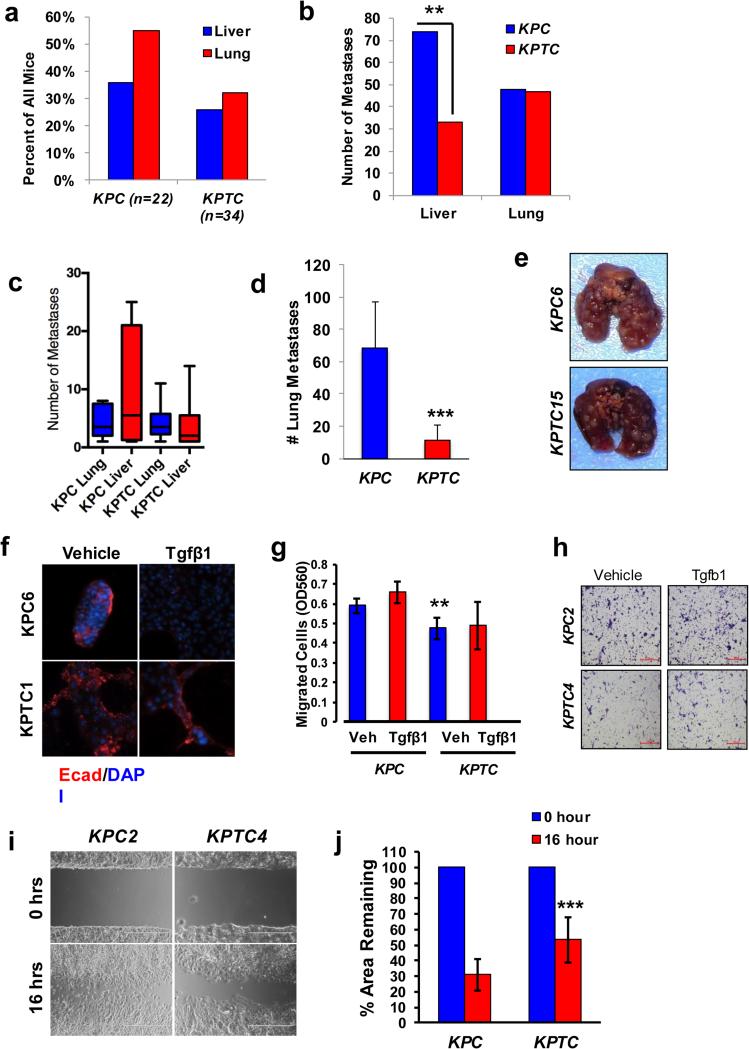
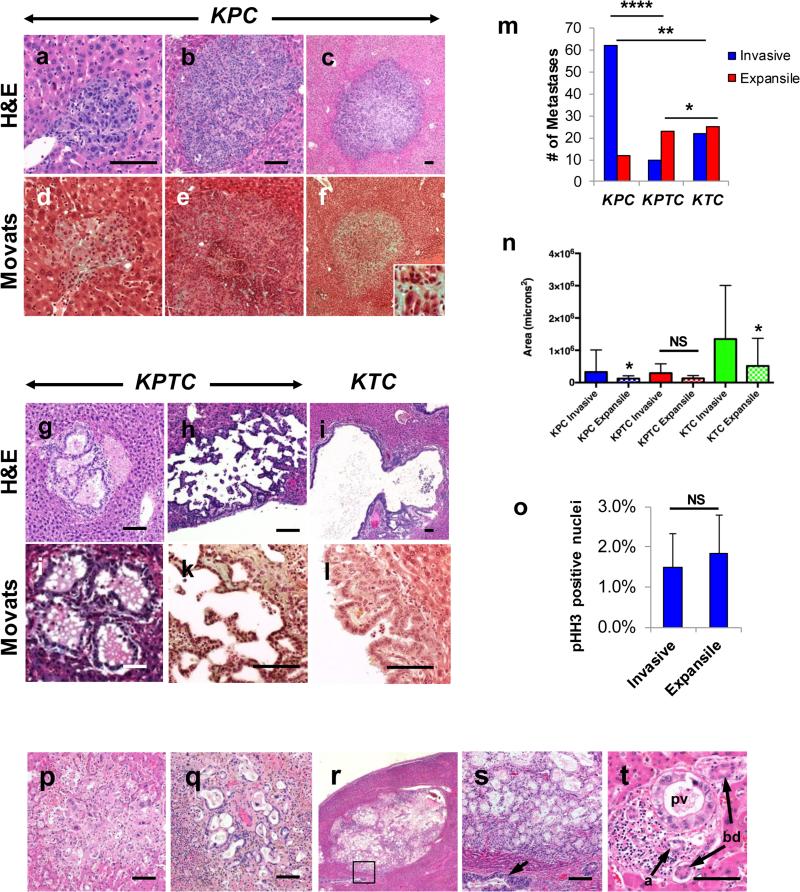
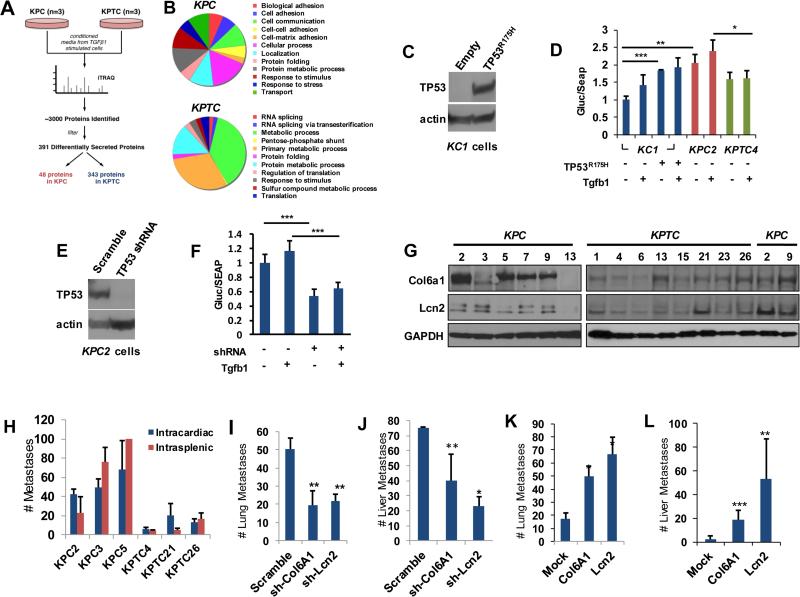
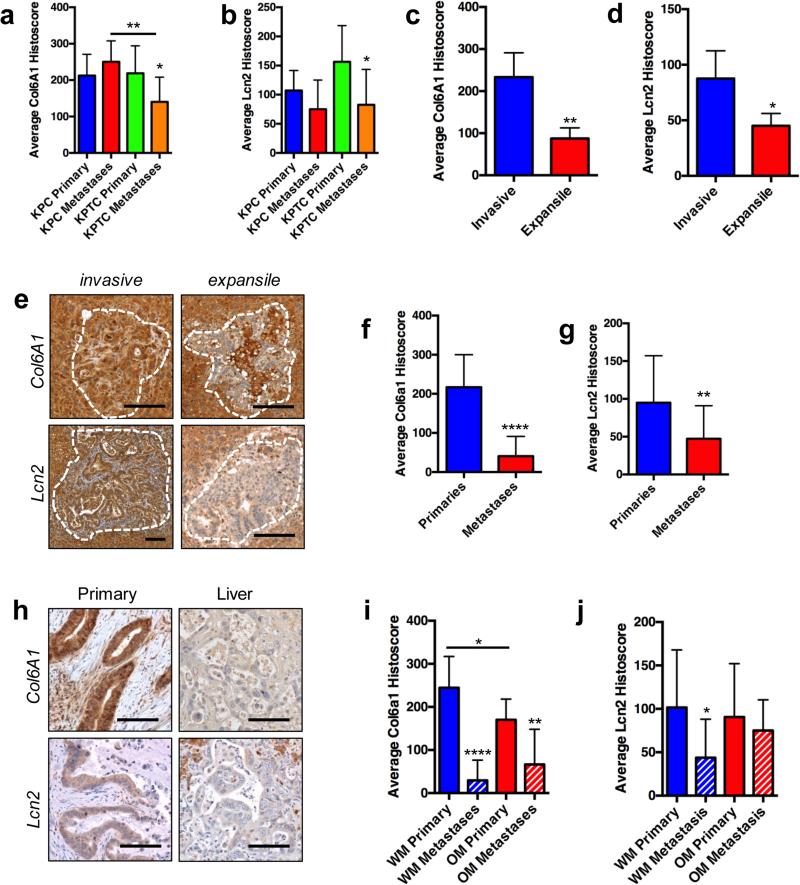
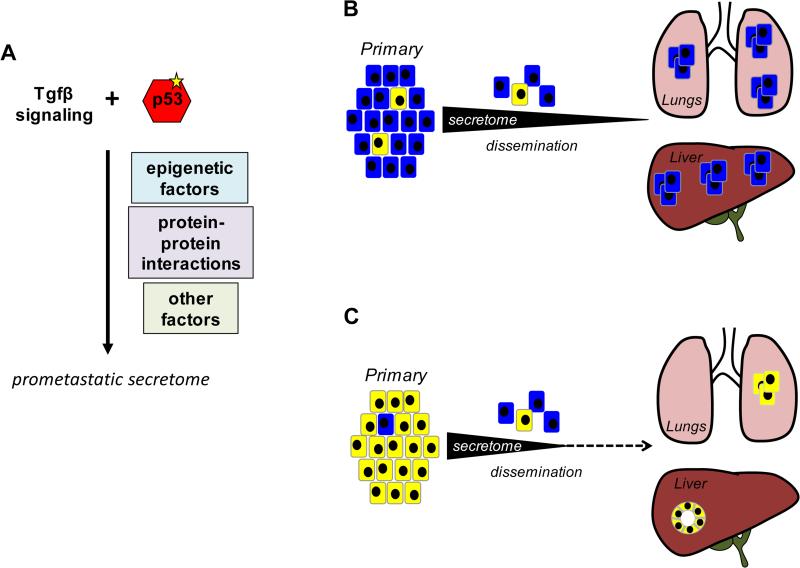
Purpose: TP53 and the TGFβ pathway are major mediators of pancreatic cancer metastasis. The mechanisms by which they cause hematogenous metastasis have not been fully explored.Experimental Design:KPC (LSL-KRASG12D/+;LSL-Trp53R172H/+; Ptf1aCre/+) mice were generated, and the frequency and morphology of organ-specific hematogenous metastases compared with that seen in KPTC and KTC littermates (Tgfbr2+/-). Key findings were validated in primary cells from each genotype and samples of human pancreatic cancer liver metastases.Results: The frequency of hematogenous metastasis in KPTC mice was significantly lower than for KPC mice (41% vs. 68%, P < 0.05), largely due to a reduction in liver metastases. No differences were found between KPC and KPTC lung metastases, whereas liver metastases in KPTC mice showed a profound extravasation deficiency characterized by sinusoidal growth and lack of desmoplastic stroma. Analogous findings were confirmed in liver samples from patients indicating their clinical relevance. Portal vein colonization as a direct mode of access to the liver was observed in both mice and humans. Secretome analyses of KPC cells revealed an abundance of secreted prometastatic mediators including Col6A1 and Lcn2 that promoted early steps of metastatic colonization. These mediators were overexpressed in primary tumors but not metastases, suggesting that the ability to colonize is, in part, developed within the primary site, a phenomenon we refer to as the "Cinderella effect."Conclusions: These findings establish a novel paradigm for understanding pancreatic cancer metastasis and the observed clinical latencies of liver versus lung metastases specifically. Clin Cancer Res; 23(6); 1607-20. ©2016 AACR.


Figures

Figure 1
Figure 1. Characterization of general patterns of metastases in murine models of PDA
A, Representative poorly-differentiated PDA in KPC and well-differentiated PDA in KPTC mouse. Scale bars, 100 microns. B, Kaplan-Meier survival curves of KPTC, KPC, KTC, KC and control mouse cohorts. KPTC mice have a significantly shortened median survival compared to both KPC (p<0.0001) and KTC mice (p=<0.0001). Medians survivals were compared by pair-wise log-rank tests. C, Overall frequency of the gross or histologic metastases in KPC and KPTC mice. D, Frequency of hematogenous, peritoneal or abdominal lymph node metastases in KPC, KPTC and KTC mice. E, Gross findings in representative moribund KPC, KPTC or KTC mice with hematogenous and abdominal metastases. Dashed lines outline primary tumor, arrowheads indicate metastases. *, p<0.05; **, p<0.01.
Figure 2
Figure 2. Cell-autonomous Tgfβ signaling mediates the efficiency of hematogenous metastasis
A, Frequency of liver and lung metastases in KPC (n=22) and KPTC (n=34) mice. B, Quantification of the number of metastases in the liver and lung based on histologic review in the cohort of KPC (n=8) and KPTC (n=9) mice with hematogenous metastases. C, The median and interquartile range of lung and liver metastases of mice with hematogenous metastases by genotype. D, Quantification of gross metastatic lung colonization at three weeks following tail vein injection of 1 × 10⁵ primary KPC versus KPTC cells. E, Representative lungs in mice injected with KPC6 or KPTC15 primary cells. F, Immunoflourescence labeling for E-cadherin in representative KPC and KPTC primary cells treated with vehicle or TGFβ1. DAPI was used as a counterstain to visualize nuclei. G, Quantification of cell migration of KPC and KPTC cells. Data shown represent the mean ± standard deviation of three independent experiments per primary cell line. At least three cell lines per genotype were analyzed. H, Migration images in representative KPC and KPTC primary cells treated with vehicle or TGFβ1. I, Representative images of wound-healing in KPC2 and KPTC4 primary cells. J, Quantification of percentage of wound remaining in primary KPC versus KPTC cells. Data shown represent the mean ± standard deviation of at least three primary cell lines per genotype, with each line analyzed in triplicate per experiment. **, p<0.01; ***, p<0.001.
Figure 3
Figure 3. Cell-autonomous Tgfβ signaling mediates the pattern of metastatic colonization of the liver
Examples of invasive micrometastasis (A), invasive macrometastasis without a significant stromal response (B) and invasive macrometastasis with stromal reponse in KPC mice livers (C). D and F, Movats pentachrome stain of invasive liver metastasis in the same KPC mice. The inset in panel f highlights the collagen rich stroma. Representative expansile metastases in liver of KPTC (G and H) and KTC mice (I). Movats pentachrome stain of same metastases in liver in KPTC (J and K) and KTC mice (L). M, Frequency of invasive versus expansile metastases in KPC, KPTC and KTC mice. N, Quantification of the cross-sectional area of metastases in the liver of KPC, KPTC and KTC mice. O, Percent of pHH3 positive cells per 200x HPF in invasive versus expansile metastases in each genotype. P, Representative invasive liver metastasis in PDA patient. Q, Representative expansile liver metastasis in PDA patient. R, Large expansile liver metastasis forming cystic mass. S, Higher power view of metastasis shown in (R). Arrow indicates adjacent portal vein colonization. T, Representative portal vein colonization in area of otherwise normal liver in PDA patient. a, artery; bd, bile duct; pv, portal vein. Scale bars, 100 microns. *, p<0.05; **, p<0.01; ****, p<0.0001.
Figure 4
Figure 4. Soluble mediators of metastasis are enriched in the secretome of KPC mice
A, Schematic of mass-spectrophotometry experiment. B, PANTHER-based classification KPC or KPTC secretomes. C. Western blot illustrating endogenous expression of TP53-R175H in KC1 cells. D. Relative activity levels of the dual luminescence reporter vector driven by a Col6a1 promoter when transfected into KC1, KPC2 or KPTC4 cells with or without Tgfb1 ligand stimulation. Activity levels of KC1 cells after transfection with TP53-R175H are also shown. E. Western blot illustrating efficiency of knockdown of Trp53 in KPC2 cells. F. Relative reporter activity levels of KPC2 cells after knockdown of Trp53 with or without TGFb1 ligand stimulation. In both D and F Col6a1 promoter activities are presented as a ratio of Gluc activity to SEAP activity with each transfection experiment performed in triplicate. G, Western blots for Col6A1 and Lcn2 protein in KPC and KPTC primary cell lines. GAPDH is used as a loading control. H, Gross quantification of lung or liver metastases following intracardiac or intrasplenic injection of primary KPC versus KPTC cells. Data shown represent the mean ± standard deviation of at least three primary cell lines per genotype, with each line injected into at least four mice per experiment. I, Quantification of lung colonization by KPC2 cells stably transfected with scrambled, Col6A1 or Lcn2 shRNAs. J, Quantification of liver colonization following intrasplenic injection using KPC2 cells stably transfected with scrambled, Col6A1 or Lcn2 shRNAs. K, Quantification of lung colonization by KPTC4 cells stably transfected with mock, Col6A1 or Lcn2 expressing vector. L, Quantification of liver colonization following intrasplenic injection using KPTC4 cells stably transfected with mock, Col6A1 or Lcn2 vectors. For all experimental metastasis assays the data shown are the mean ± S.D of at least four animals per condition. Comparisons were made using a two-sided Student's T-Test. *, p<0.05; **, p<0.01; ***, p<0.001.
Figure 5
Figure 5. Prometastatic protein expression is enabled within the primary site of mouse and human PDA
A and B, Mean ± S.D. histoscores for Col6A1 and Lcn2 in primary and metastatic PDA tissues from KPC and KPTC mice. C and D, Mean ± S.D. histoscores for Col6A1 and Lcn2 in invasive versus expansile liver micrometastases. E, Representative Col6A1 or Lcn2 labeling of invasive and expansile liver metastases. Dashed lines outline the metastases. F and G, Mean ± S.D. histoscores for Col6A1 and Lcn2 in primary and metastatic PDA tissues from patients with PDA. H, Representative Col6A1 or Lcn2 labeling of matched human primary and liver metastases. I and J, Mean ± S.D. histoscores for Col6A1 and Lcn2 in primary and metastatic PDA tissues from patients categorized by having widely metastatic (WM) or oligometastatic (OM) PDA at autopsy. All distributions were compared by a two-sided Student's T-test. Scale bars, 100 microns. *, p<0.05; **, p<0.01; ****, p<0.0001.
Figure 6
Figure 6. A Model for Organ-Specific Hematogenous Colonization by PDA
A. A missense mutation in p53, denoted by the yellow star, confers a gain of function that cooperates with TGFβ signaling to produce a prometastatic secretome. The mechanism by which this cooperation occurs may be due to altered epigenetic regulation of specific genes, altered protein-protein interactions of the mutant p53 protein, or secondary effects on gene expression, among other possibilities. B. Mutant p53 together with TGFβ signaling leads to a high level of cellular fitness of the pancreatic cancer cells (blue cells) within the primary tumor. The high cellular fitness coupled with protein expression of prometastastic mediators supports efficient colonization of the liver and lung by disseminated cancer cells. C. Attenuation of TGFβ signaling decreases the prometastatic effects of mutant p53 and lowers the overall fitness of cancer cells (yellow cells). Upon dissemination they are unable to maintain expression of the secretome resulting in vastly reduced metastatic efficiency to hematogenous organs, an altered pattern of hepatic colonization, and a prolonged latency to development of clinically evident metastatic disease in general.

References

    1. Stathis A, Moore MJ. Advanced pancreatic carcinoma: current treatment and future challenges. Nat Rev Clin Oncol. 2010;7:163–72. - PubMed
    1. Rahib L, Smith BD, Aizenberg R, Rosenzweig AB, Fleshman JM, Matrisian LM. Projecting cancer incidence and deaths to 2030: the unexpected burden of thyroid, liver, and pancreas cancers in the United States. Cancer Res. American Association for Cancer Research. 2014;74:2913–21. - PubMed
    1. Yachida S, Iacobuzio-Donahue CA. The pathology and genetics of metastatic pancreatic cancer. Arch Pathol Lab Med. 2009;133:413–22. - PubMed
    1. Hingorani SR, Wang L, Multani AS, Combs C, Deramaudt TB, Hruban RH, et al. Trp53R172H and KrasG12D cooperate to promote chromosomal instability and widely metastatic pancreatic ductal adenocarcinoma in mice. Cancer Cell. 2005;7:469–83. - PubMed
    1. Bardeesy N, Aguirre AJ, Chu GC, Cheng K-H, Lopez LV, Hezel AF, et al. Both p16(Ink4a) and the p19(Arf)-p53 pathway constrain progression of pancreatic adenocarcinoma in the mouse. Proc Natl Acad Sci USA. 2006;103:5947–52. - PMC - PubMed

MeSH terms

Substances