. 2016 Nov;204(3):1307-1319.
doi: 10.1534/genetics.116.192492. Epub 2016 Sep 16.

A Variable Genetic Architecture of Melanic Evolution in Drosophila melanogaster

Affiliations

A Variable Genetic Architecture of Melanic Evolution in Drosophila melanogaster

Héloïse Bastide et al. Genetics. 2016 Nov.

Abstract

Unraveling the genetic architecture of adaptive phenotypic divergence is a fundamental quest in evolutionary biology. In Drosophila melanogaster, high-altitude melanism has evolved in separate mountain ranges in sub-Saharan Africa, potentially as an adaptation to UV intensity. We investigated the genetic basis of this melanism in three populations using a new bulk segregant analysis mapping method. We identified 19 distinct QTL regions from nine mapping crosses, with several QTL peaks overlapping between two or all populations, and yet different crosses involving the same melanic population commonly yielded distinct QTL. The strongest QTL often overlapped well-known pigmentation genes, but we typically did not find wide signals of genetic differentiation (FST) between lightly and darkly pigmented populations at these genes. Instead, we found small numbers of highly differentiated SNPs at the probable causative genes. A simulation analysis showed that these patterns of polymorphism were consistent with selection on standing genetic variation. Overall, our results suggest that, even for potentially simpler traits like pigmentation, the complexity of adaptive trait evolution poses important challenges for QTL mapping and population genetic analysis.

Keywords: Drosophila melanogaster; adaptation; bulk segregant analysis; parallel evolution; pigmentation; standing genetic variation.


Figures

Figure 1
Figure 1
Populations sampled and studied phenotypes. (A) Several lines of each melanic population (brown and red circle; CO = Cameroon, EF = Ethiopia, and UG = Uganda) were separately crossed with homokaryotypic lines from a lightly pigmented population (yellow and red circle; ZI = Zambia). (B and C) Pigmentation phenotypes in Ethiopia (B) and Zambia (C) showing the fourth abdominal segment that was analyzed for mapping.
Figure 2
Figure 2
Locations of the detected QTL are shown with respect to the five major euchromatic chromosome arms of D. melanogaster. Colors indicate distinct crosses involving Cameroon (C), Ethiopia (E), and Uganda (U), mapping either background color (B) or stripe width (S) for the fourth abdominal segment of females. Boxes indicate 90% C.I. of each QTL, except that QTL intervals extending < 200-kb are marked with triangles. Dotted gray lines indicate Mb increments (for the release five genome) and black lines illustrate the positions of pigmentation candidate genes discussed in the text.
Figure 3
Figure 3
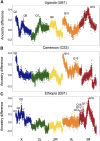
Ancestry difference plots showing relative proportions of the melanic parental population allele across five colored chromosomal arms (X, 2L, 2R, 3L, and 3R) in crosses involving three melanic populations crossed to the lightly-pigmented Zambia population: (A) Uganda (UB1), (B) Cameroon (CS3), and (C) Ethiopia (EB1). This raw mapping surface is an input for SIBSAM (Simulation-based Inference for Bulk Segregation Analysis Mapping). QTL names are according to Table 1. Discontinuities in the Cameroon plot’s chromosome arm 3R reflect the presence of In(3R)K in both parental strains, an inversion that is nearly fixed in the CO sample.
Figure 4
Figure 4
Window-based genetic differentiation (FST) in quantiles (Q) between a lightly pigmented population (Zambia) and three melanic populations: (A) Uganda, (B) Cameroon, and (C) Ethiopia at three pigmentation-associated QTL. Dashed lines refer to boundaries of pigmentation candidate genes: tan (t), bric-a-brac (bab1 and bab2), and ebony (e). Dotted lines represent the locations of other genes that may influence pigmentation (Table 1). Coordinates are given in kb with respect to release five of the D. melanogaster genome. In many cases, strong window genetic differentiation was not observed at pigmentation genes within large-effect QTL.
Figure 5
Figure 5
SNP-based genetic differentiation (FST) estimates between lightly pigmented Zambia and darkly pigmented Ethiopia populations at four melanin synthesis enzyme genes: (A) yellow (y), (B) tan (t), (C) black (b), and (D) ebony (e). Each plot represents a 5-kb window centered on the most differentiated SNP for each gene. Lightly colored boxes refer to genes’ 5′ and 3′ UTRs, darkly colored boxes refer to exons, and lines refer to introns.
Figure 6
Figure 6
A simulation analysis was conducted to identify evolutionary models compatible with genetic differentiation at ebony between Ethiopia and Zambia populations. The top panels show that compared with neutral simulations, the empirically observed 5-kb window FST is only moderately elevated (A), but the maximum SNP FST observed at ebony is unusually high (B). (C) The heat map (C) illustrates outcomes of simulations in which the most differentiated SNP was favored in Ethiopia. The acceptance rates depicted here depend on: (1) population allele frequencies at the focal SNP that are compatible with subsampling to match empirical counts, and (2) a window FST at least as low as that observed at ebony. Acceptance rates are colored based on a log10 scale, with black cells indicating < 10 successfully subsampled simulations out of 2.5 million. A range of selection strengths are depicted for models producing hard sweeps (initial frequency 1/2Ne) and those conditioned on soft sweep outcomes (all others). Results suggest that soft sweep scenarios with higher initial frequencies are the most likely to raise the beneficial allele to high frequency (without fixing it), while also recapitulating the disparity between window FST and SNP FST observed at ebony.

References

    1. Bastide H., Betancourt A., Nolte V., Tobler R., Stöbe P., et al. , 2013. A genome-wide, fine-scale map of natural pigmentation variation in Drosophila melanogaster. PLoS Genet. 9: e1003534. - PMC - PubMed
    1. Bastide H., Yassin A., Johanning E. J., Pool J. E., 2014. Pigmentation in Drosophila melanogaster reaches its maximum in Ethiopia and correlates most strongly with ultra-violet radiation in sub-Saharan Africa. BMC Evol. Biol. 14: 179. - PMC - PubMed
    1. Bell G., 2009. The oligogenic view of adaptation. Cold Spring Harb. Symp. Quant. Biol. 74: 139–144. - PubMed
    1. Bergland A. O., Tobler R., Gonzalez J., Schmidt P., Petrov D., 2016. Secondary contact and local adaptation contribute to genome‐wide patterns of clinal variation in Drosophila melanogaster. Mol. Ecol. 25: 1157–1174. - PMC - PubMed
    1. Bettencourt R., Asha H., Dearolf C., Ip Y. T., 2004. Hemolymph-dependent and -independent responses in Drosophila immune tissue. J. Cell. Biochem. 92: 849–863. - PubMed

Publication types

LinkOut - more resources