. 2016 Dec;15(12):3000-3014.
doi: 10.1158/1535-7163.MCT-16-0271. Epub 2016 Sep 16.

Alkylating Agent-Induced NRF2 Blocks Endoplasmic Reticulum Stress-Mediated Apoptosis via Control of Glutathione Pools and Protein Thiol Homeostasis

Affiliations

Alkylating Agent-Induced NRF2 Blocks Endoplasmic Reticulum Stress-Mediated Apoptosis via Control of Glutathione Pools and Protein Thiol Homeostasis

Alfeu Zanotto-Filho et al. Mol Cancer Ther. 2016 Dec.

Abstract

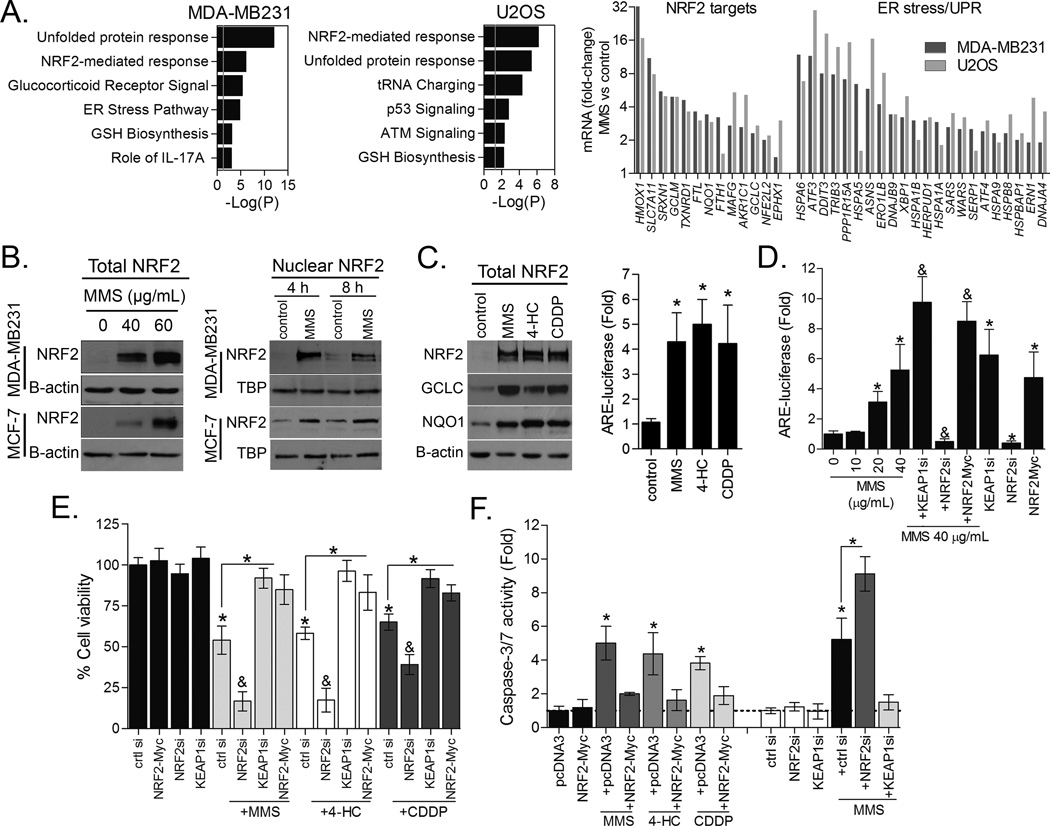
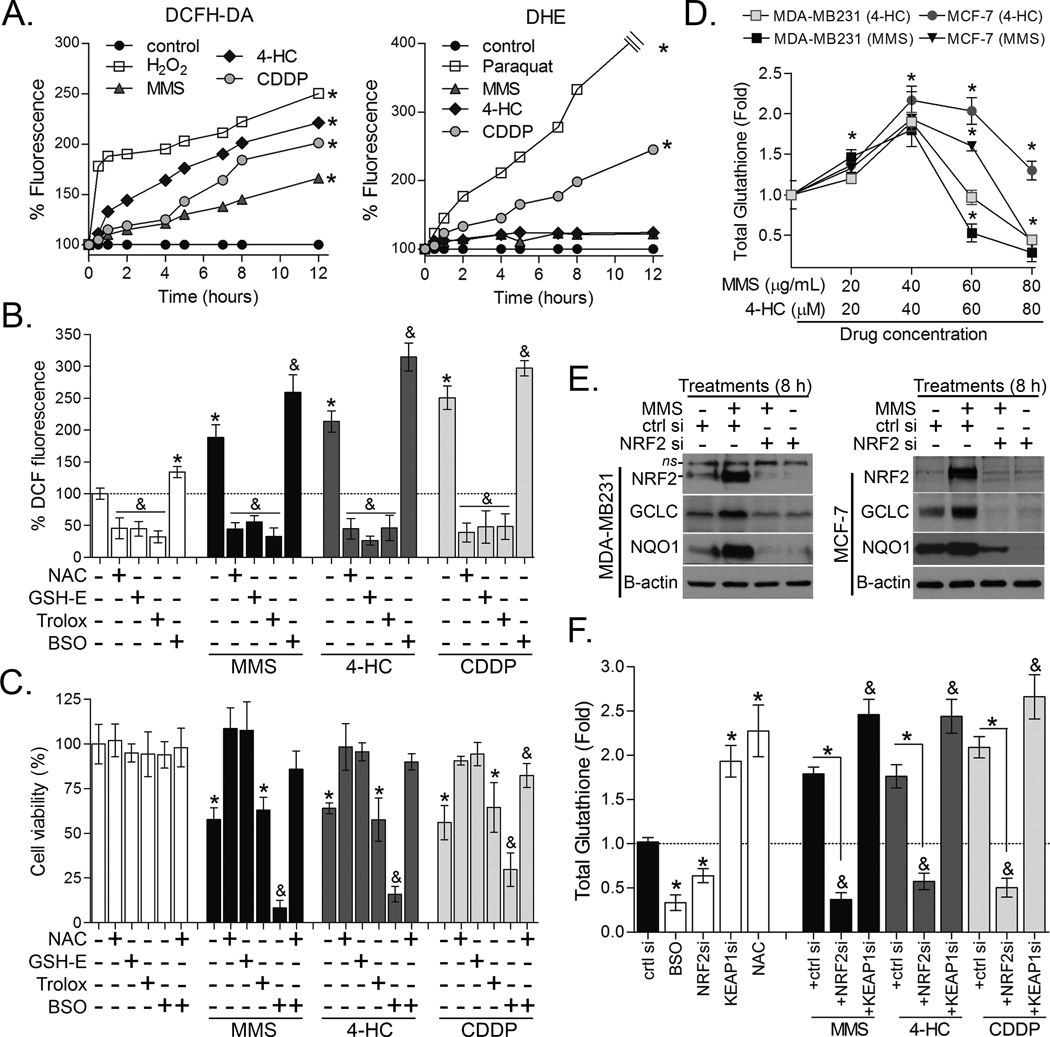
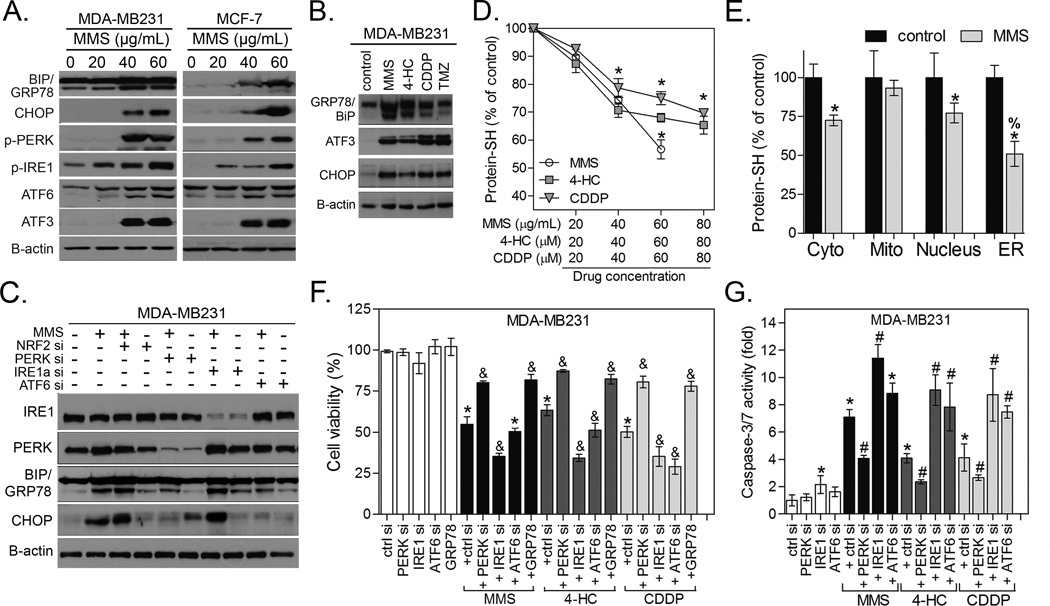
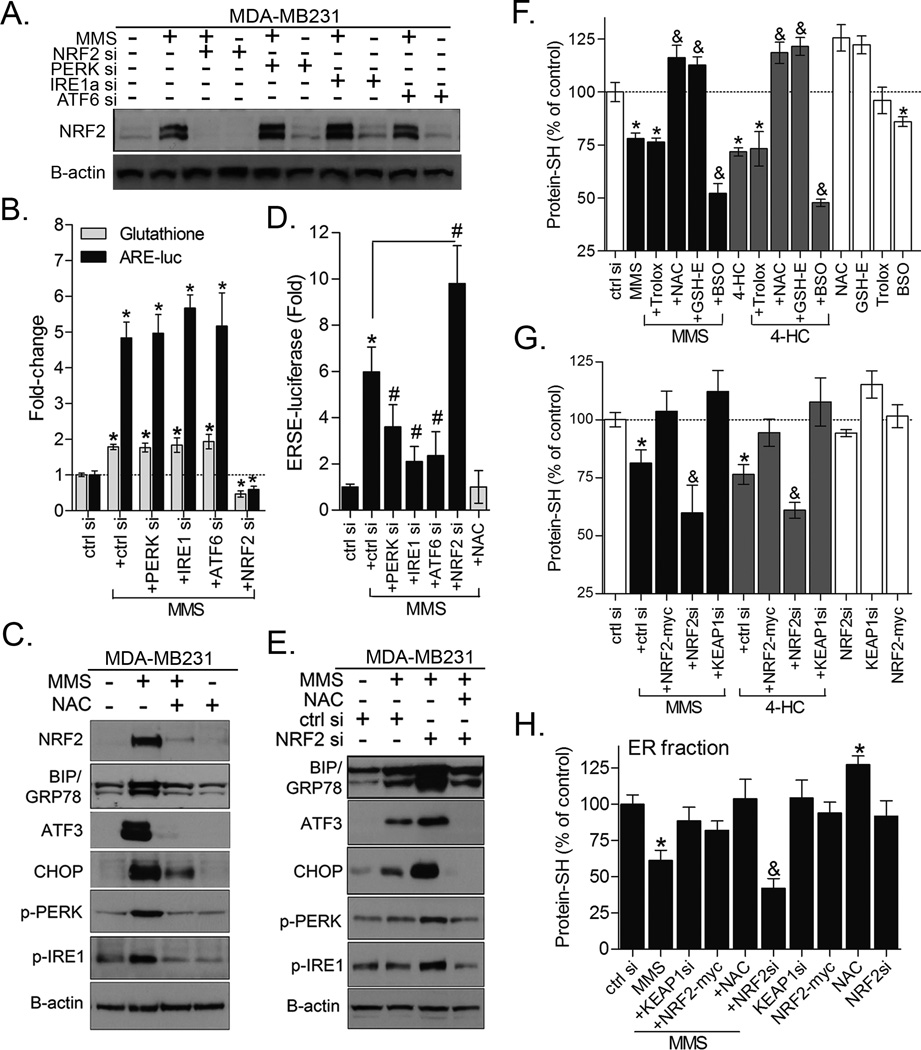
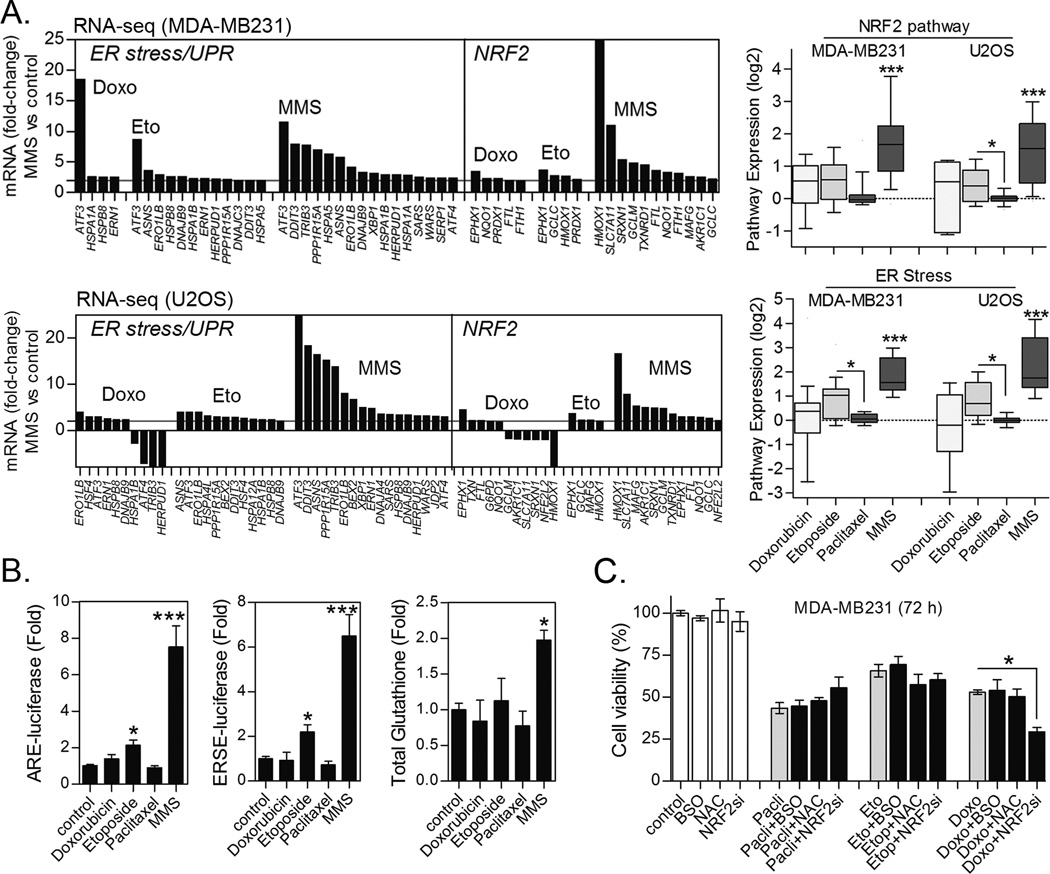
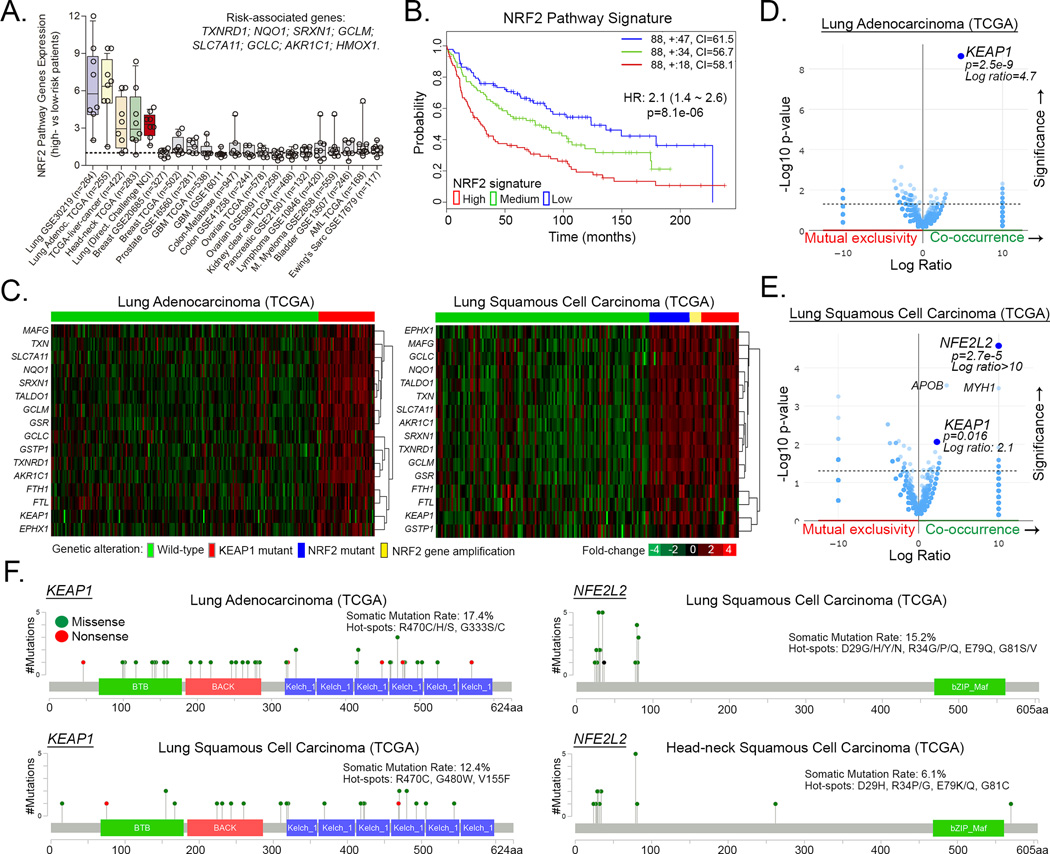
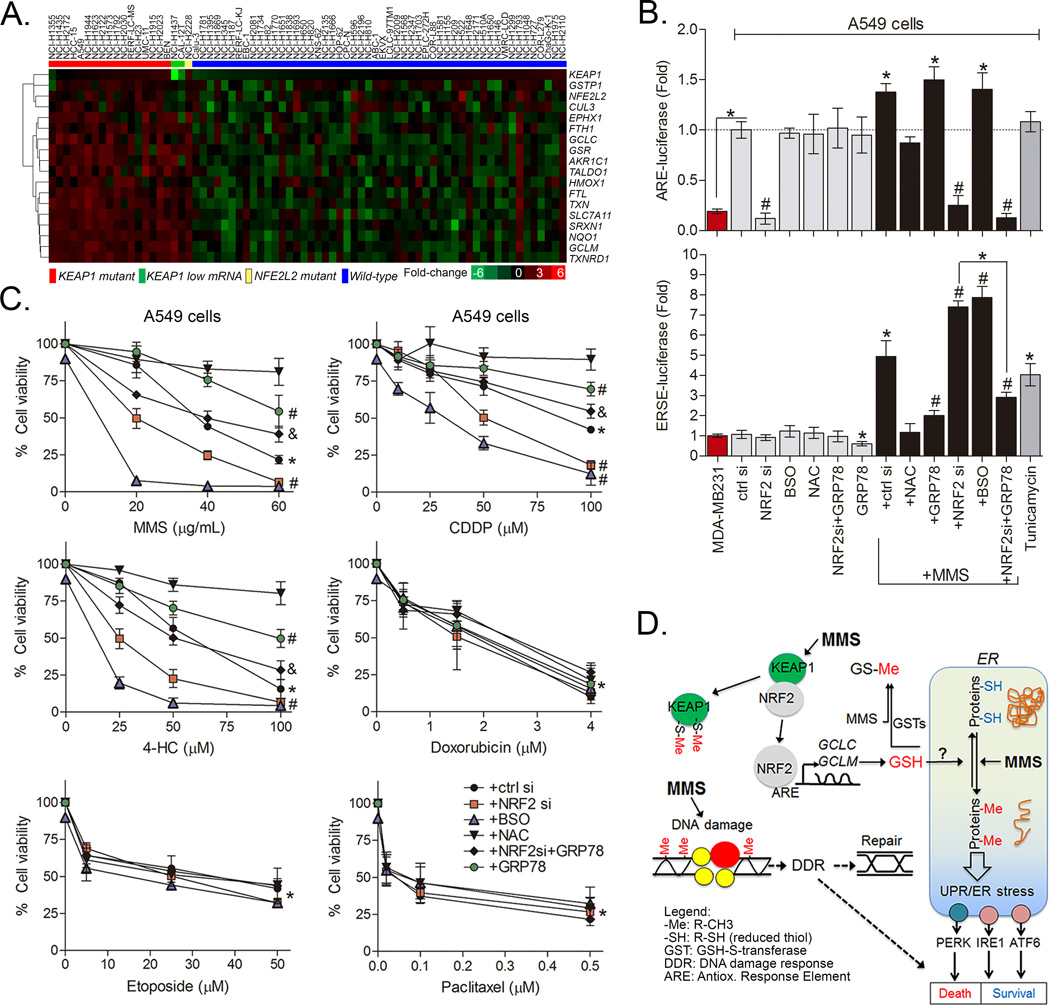
Alkylating agents are a commonly used cytotoxic class of anticancer drugs. Understanding the mechanisms whereby cells respond to these drugs is key to identify means to improve therapy while reducing toxicity. By integrating genome-wide gene expression profiling, protein analysis, and functional cell validation, we herein demonstrated a direct relationship between NRF2 and Endoplasmic Reticulum (ER) stress pathways in response to alkylating agents, which is coordinated by the availability of glutathione (GSH) pools. GSH is essential for both drug detoxification and protein thiol homeostasis within the ER, thus inhibiting ER stress induction and promoting survival, an effect independent of its antioxidant role. NRF2 accumulation induced by alkylating agents resulted in increased GSH synthesis via GCLC/GCLM enzyme, and interfering with this NRF2 response by either NRF2 knockdown or GCLC/GCLM inhibition with buthionine sulfoximine caused accumulation of damaged proteins within the ER, leading to PERK-dependent apoptosis. Conversely, upregulation of NRF2, through KEAP1 depletion or NRF2-myc overexpression, or increasing GSH levels with N-acetylcysteine or glutathione-ethyl-ester, decreased ER stress and abrogated alkylating agents-induced cell death. Based on these results, we identified a subset of lung and head-and-neck carcinomas with mutations in either KEAP1 or NRF2/NFE2L2 genes that correlate with NRF2 target overexpression and poor survival. In KEAP1-mutant cancer cells, NRF2 knockdown and GSH depletion increased cell sensitivity via ER stress induction in a mechanism specific to alkylating drugs. Overall, we show that the NRF2-GSH influence on ER homeostasis implicates defects in NRF2-GSH or ER stress machineries as affecting alkylating therapy toxicity. Mol Cancer Ther; 15(12); 3000-14. ©2016 AACR.


Conflict of interest statement

The authors declare that no conflict of interest exists.

Figures

Figure 1
Figure 1. Transcriptional responses and NRF2 activation by alkylating agents
(A) Pathway Enrichment Analysis (PEA) significance (−log (P-value)) of MMS-induced gene expressions in MDA-MB231 and U2OS cells as evaluated by RNA sequencing. Selected MMS-induced gene expression changes in NRF2 and ER stress markers are also shown. (B) Representative immunoblots showing the effect of MMS on total and nuclear NRF2 in MDA-MB231 and MCF-7 cells. (C) Effect of different alkylating agents on NRF2, GCLC and NQO1 proteins immunocontent and ARE-luciferase reporter activity in MDA-MB231 cells. (D) ARE-luciferase reporter assays showing the dose-dependent effect of MMS, the effect of NRF2 and KEAP1 depletion by siRNA, and NRF2-Myc overexpression upon NRF2 activity in MDA-MB231 cells. (E–F) Impact of NRF2 and KEAP1 knockdown by siRNA and NRF2-myc overexpression on (E) CellTiter-Glo cell growth assay and (F) caspase-3/7 activation in MDA-MB231 cells exposed to MMS, CDDP and 4-HC for 48 h. Unless otherwise specified, cells were treated for 8 h with alkylating agents at ~IC40–50 as described in Materials and Methods. Legends: si (siRNA). Data are represented as the average ± SD of a representative experiment performed in triplicate and repeated thrice. *different from untreated/controls or at indicated comparisons; &different from untreated and from alkylating agent-treated (p<0.05, ANOVA-Tukey).
Figure 2
Figure 2. NRF2-GSH pathway is key for alkylating agent survival
(A) Representative kinetics of DCF and DHE assays showing the effect of alkylating agents on cellular ROS production in MDA-MB231 cells. (B) DCF and (C) Cell-Titer Glo assays showing the effect of antioxidants (NAC, GSH-E and Trolox) and BSO on alkylating agents-induced ROS (12h treatment; DCF assay) and cell survival (48 h exposure), respectively. (D) Dose effect of alkylating agents on total glutathione levels in MDA-MB231 and MCF-7 cell lines after 12 h treatment. X-axis denotes 4-HC and MMS at µM and µg/mL units of concentration, respectively. (E) Effect of NRF2 knockdown on MMS-induced GCLC and NQO1 immunocontents in MDA-MB231 and MCF-7 cells (8 h treatment). (F) Effect of NRF2 and KEAP1 depletion by siRNA on glutathione content in MMS, CDDP or 4-HC treated MDA-MB231 cells (12 h treatment). Unless otherwise specified, the cells were treated with alkylating agents at ~IC40–50 as described in Materials and methods. Legend: si (siRNA); ctrl si (scrambled control siRNA). Data are represented as the average ± SD of a representative experiment performed in quadruplicate and repeated thrice. *different from untreated/controls or at indicated comparisons; &different from untreated and from alkylating agent-treated (p<0.05, ANOVA-Tukey).
Figure 3
Figure 3. Alkylating agents induce protein-SH depletion and ER stress-dependent cell death
(A) Immunoblots showing the dose-effect of MMS and (B) other alkylating agents on ER stress markers in MDA-MB231 and MCF-7 cells. (C) Representative immunoblots showing the impact of PERK, IRE1α and ATF6 depletion by siRNA upon CHOP and GRP78/BiP immunocontents in MDA-MB231 cells. (D) Dose-effect of alkylating agents on protein thiol (protein-SH) levels in MDA-MB231 cells. (E) Protein-SH levels in subcellular fractions from MMS-treated cells. Unless otherwise specified, the cells were treated for 12 h with alkylating agents at ~IC40–50 as described in Materials and Methods. (F–G) Representative experiment showing the impact of PERK, IRE1α and ATF6 depletion by siRNA or GRP78-pcDNA3 overexpression on (F) CellTiter-Glo cell growth assay and (G) caspase-3/7 activity in MDA-MB231 cells exposure to alkylating agents for 48 h. Legends: si (siRNA); ctrl si (scrambled siRNA), control (untreated cells), GRP78 (GRP78-pcDNA3 overexpression). Unaltered results with pcDNA3 empty vector and scrambled siRNA are omitted. Data are represented as the average ± SD of a representative experiment performed in triplicate and repeated thrice (for D,F,G) or twice (for E panel). *different from untreated; #&different from untreated and from alkylating agent-treated cells; %different from all other groups (p<0.05, ANOVA-Tukey).
Figure 4
Figure 4. NRF2 and GSH control the magnitude of protein damage and ER stress response
(A) NRF2 immunoblots and (B) assays for ARE-luciferase activity and total glutathione showing the impact of depleting different ER stress sensors by siRNA on MMS-induced NRF2 activation and GSH synthesis in MDA-MB231 cells. (C) Western blot analysis showing that NAC pre-treatment inhibits ER stress proteins expression in MMS-treated MDA-MB231 cells. (D) ERSE-luciferase reporter gene assay to demonstrate that NRF2 depletion exacerbates, while NAC blocks, MMS-induced ER stress activation in MDA-MB231 cells (8 h treatment). (E) Representative immunoblots showing the impact of NRF2 siRNA and the rescuing effect of NAC on ER stress markers in MDA-MB231 cells treated with MMS for 24 h. (F–G) Dibromobimane assays showing the effect of: (F) Antioxidants and BSO; (G) NRF2 and KEAP1 knockdown or NRF2-myc overexpression in the basal and alkylating agents-induced protein-SH depletion in MDA-MB231 cells. (H) Effect of NAC, KEAP1 or NRF2 knockdown, and NRF2-myc overexpression in the protein-SH levels of ER fractions of MMS-treated MDA-MB231 cells. Unless otherwise specified, the cells were treated for 12 h with alkylating agents at ~IC40–50 as described in Materials and Methods. Data are represented as the average ± SD of a representative experiment performed in triplicate and repeated thrice (for B,D,F,G) or twice (for H panel). *different from untreated; #&different from untreated and from alkylating agent-treated at equivalent conditions (p<0.05, ANOVA-Tukey).
Figure 5
Figure 5. Activation of NRF2 and ER stress pathways in response to alkylating agents as compared to other chemotherapeutics
(A) The most significant mRNA fold-changes in ER stress and NRF2 pathway markers as determined by RNA sequencing of MDA-MB231 and U2OS cells treated for 8 h with chemotherapeutics and MMS (see Methods). NRF2 and ER stress pathway expression index for each tested drug is also shown. (B) Comparative effect of chemotherapies on ERSE- and ARE-luciferase reporter gene activities and total glutathione content in MDA-MB231 cells treated for 8 h. (C) Impact of NAC and BSO pre-treatments and NRF2 knockdown on the cytotoxicity of non-alkylating drugs in MDA-MB231 (72 h treatment). Figs. “B and C” data are represented as the average ± SD of a representative experiment performed in triplicate and repeated at least thrice. *different from untreated or at indicated comparisons; ***different from all other groups (p<0.05, ANOVA/Tukey for “B–C”; Kruskal-Wallis/Dunn’s for “A”).
Figure 6
Figure 6. NRF2 pathway activating mutations and prognosis in different cancers
(A) NRF2 Pathway Gene Expressions Signature in high- vs low-risk/longer survival patients of different cancer datasets available with the SurvExpress database. (B) Kaplan-Meier curves showing the impact of NRF2 pathway expression signature upregulation (red), medium (green) or downregulation (blue) in lung cancer patients’ survival as determined by the SurvExpress tool. See Figure S3 for individual gene expressions across risk groups. (C) Heatmap representation of NRF2 target genes expressions in KEAP1 and NRF2/NFE2L2 altered versus wild-type tumor subsets of lung cancer. (D–E) Mutation Enrichment Analysis (MEA) showing that KEAP1 and NFE2L2 mutations are the genetic alterations most significantly associated with increased expression of the NRF2 targets in (D) lung adenocarcinomas and (E) lung squamous cell carcinomas, respectively. (F) Graphical representation of the localization, frequency and mutation hotspots with KEAP1 and NFE2L2 genes in lung and head-neck carcinomas; data from TCGA cBioportal.
Figure 7
Figure 7. NRF2-GSH pathway activation inhibits ER stress and promotes survival to alkylating agents in the KEAP1 mutant lung cancer cell line A549
(A) Heatmap representation of NRF2 target genes expressions in a panel of lung cancer cells (E-MTAB-2706 RNA-sequencing dataset) grouped based on their reported KEAP1 mutational status (Red, known KEAP1 mutation; Green, low KEAP1 expression; Yellow, NFE2L2 mutation; Blue, no known KEAP1/NFE2L2 mutation). See Figure S4 for individual gene expressions and NRF2 pathway signature. (B) Reporter gene assays showing the impact of NRF2 siRNA, GRP78 overexpression, BSO and NAC on ARE- and ERSE-luciferase activities in A549 cells; Tunicamycin (0.5 µM) was used as a positive control for ER stress induction. (C) Results of Cell-Titer Glo assays show the effect of NRF2 knockdown by siRNA, GRP78 overexpression, BSO and NAC pre-incubations (see methods) upon the dose-effect of chemotherapeutics in A549 cells (48 h treatment). Data are represented as the average ± SD of a representative experiment performed in triplicate and repeated twice. *different from untreated controls; #different from chemotherapy alone and from untreated cells. &different from chemotherapy+NRF2 siRNA (ANOVA/Tukey; p<0.05). (D) Schematic chart showing the proposed mechanism of NRF2-dependent control of protein-SH homeostasis and ER stress in cells exposed to alkylating agents.

Similar articles

Cited by

References

    1. Hernandez-Aya LF, Gonzalez-Angulo AM. Adjuvant systemic therapies in breast cancer. Surg Clin North Am. 2013;93:473–491. - PubMed
    1. Jones RB, Matthes S, Dufton C, Bearman SI, Stemmer SM, Meyers S, et al. Pharmacokinetic/pharmacodynamic interactions of intensive cyclophosphamide, cisplatin, and BCNU in patients with breast cancer. Breast Cancer Res Treat. 1993;26(Suppl):S11–S17. - PubMed
    1. Omuro A, DeAngelis LM. Glioblastoma and other malignant gliomas: a clinical review. JAMA. 2013;310:1842–1850. - PubMed
    1. Friedman HS, Kerby T, Calvert H. Temozolomide and treatment of malignant glioma. Clin Cancer Res. 2000;6:2585–2597. - PubMed
    1. Chan BA, Coward JI. Chemotherapy advances in small-cell lung cancer. J Thorac Dis. 2013;5:S565–S578. - PMC - PubMed

Publication types

MeSH terms