

Thresholds for Arterial Wall Inflammation Quantified by 18F-FDG PET Imaging: Implications for Vascular Interventional Studies
- PMID: 27639759
- PMCID: PMC5056585
- DOI: 10.1016/j.jcmg.2016.04.007
Thresholds for Arterial Wall Inflammation Quantified by 18F-FDG PET Imaging: Implications for Vascular Interventional Studies
Abstract
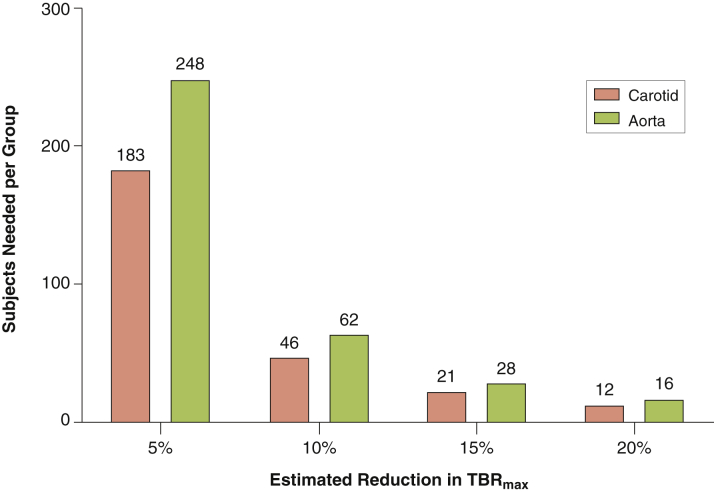
Objectives: This study assessed 5 frequently applied arterial 18fluorodeoxyglucose (18F-FDG) uptake metrics in healthy control subjects, those with risk factors and patients with cardiovascular disease (CVD), to derive uptake thresholds in each subject group. Additionally, we tested the reproducibility of these measures and produced recommended sample sizes for interventional drug studies.
Background: 18F-FDG positron emission tomography (PET) can identify plaque inflammation as a surrogate endpoint for vascular interventional drug trials. However, an overview of 18F-FDG uptake metrics, threshold values, and reproducibility in healthy compared with diseased subjects is not available.
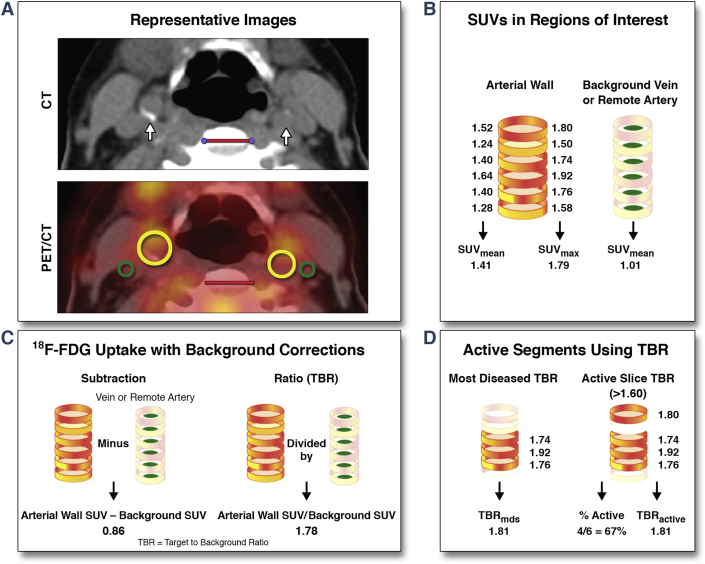
Methods: 18F-FDG PET/CT of the carotid arteries and ascending aorta was performed in 83 subjects (61 ± 8 years) comprising 3 groups: 25 healthy controls, 23 patients at increased CVD risk, and 35 patients with known CVD. We quantified 18F-FDG uptake across the whole artery, the most-diseased segment, and within all active segments over several pre-defined cutoffs. We report these data with and without background corrections. Finally, we determined measurement reproducibility and recommended sample sizes for future drug studies based on these results.
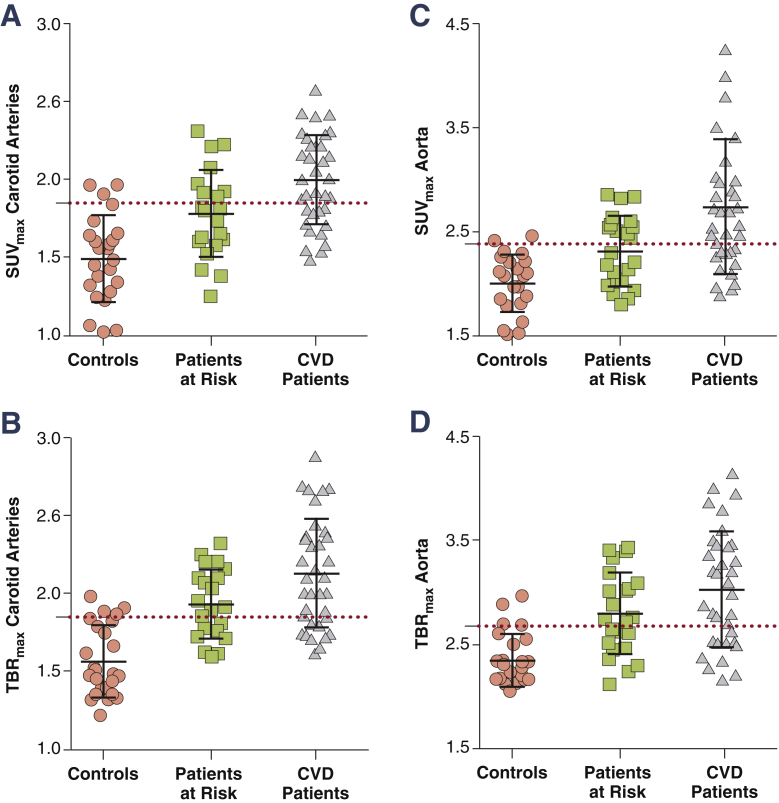
Results: All 18F-FDG uptake metrics were significantly different between healthy and diseased subjects for both the carotids and aorta. Thresholds of physiological 18F-FDG uptake were derived from healthy controls using the 90th percentile of their target to background ratio (TBR) value (TBRmax); whole artery TBRmax is 1.84 for the carotids and 2.68 in the aorta. These were exceeded by >52% of risk factor patients and >67% of CVD patients. Reproducibility was excellent in all study groups (intraclass correlation coefficient >0.95). Using carotid TBRmax as a primary endpoint resulted in sample size estimates approximately 20% lower than aorta.
Conclusions: We report thresholds for physiological 18F-FDG uptake in the arterial wall in healthy subjects, which are exceeded by the majority of CVD patients. This remains true, independent of readout vessel, signal quantification method, or the use of background correction. We also confirm the high reproducibility of 18F-FDG PET measures of inflammation. Nevertheless, because of overlap between subject categories and the relatively small population studied, these data have limited generalizability until substantiated in larger, prospective event-driven studies. (Vascular Inflammation in Patients at Risk for Atherosclerotic Disease; NTR5006).
Keywords: (18)F-FDG PET/CT; atherosclerosis; imaging; inflammation; thresholds.
Copyright © 2016 American College of Cardiology Foundation. Published by Elsevier Inc. All rights reserved.
Figures

Comment in
-
Defining Inflammatory Levels of Carotid Artery and Aortic 18FDG Uptake: Implications for Clinical Trial Design and Individual Patient Management.JACC Cardiovasc Imaging. 2016 Oct;9(10):1208-1210. doi: 10.1016/j.jcmg.2016.05.014. Epub 2016 Sep 14. JACC Cardiovasc Imaging. 2016. PMID: 27639758 No abstract available.
References
-
- Libby P., Ridker P.M., Hansson G.K. Progress and challenges in translating the biology of atherosclerosis. Nature. 2011;473:317–325. - PubMed
-
- Bloom D., Cafiero E.T., Jané-Llopis . World Economic Forum; Geneva: 2011. The Global Economic Burden of Noncommunicable Diseases.
-
- Tarkin J.M., Joshi F.R., Rudd J.H.F. PET imaging of inflammation in atherosclerosis. Nat Rev Cardiol. 2014;11:443–457. - PubMed
-
- Rudd J., Warburton E., Fryer T. Imaging atherosclerotic plaque inflammation with [18F]-fluorodeoxyglucose positron emission tomography. Circulation. 2002;105:2708–2711. - PubMed
Publication types
MeSH terms
Substances
Grants and funding
LinkOut - more resources
Full Text Sources
Other Literature Sources
Medical
