. 2016 Oct 6;99(4):831-845.
doi: 10.1016/j.ajhg.2016.08.007. Epub 2016 Sep 15.

Recurrent De Novo and Biallelic Variation of ATAD3A, Encoding a Mitochondrial Membrane Protein, Results in Distinct Neurological Syndromes

Affiliations

Recurrent De Novo and Biallelic Variation of ATAD3A, Encoding a Mitochondrial Membrane Protein, Results in Distinct Neurological Syndromes

Tamar Harel et al. Am J Hum Genet. .

Abstract

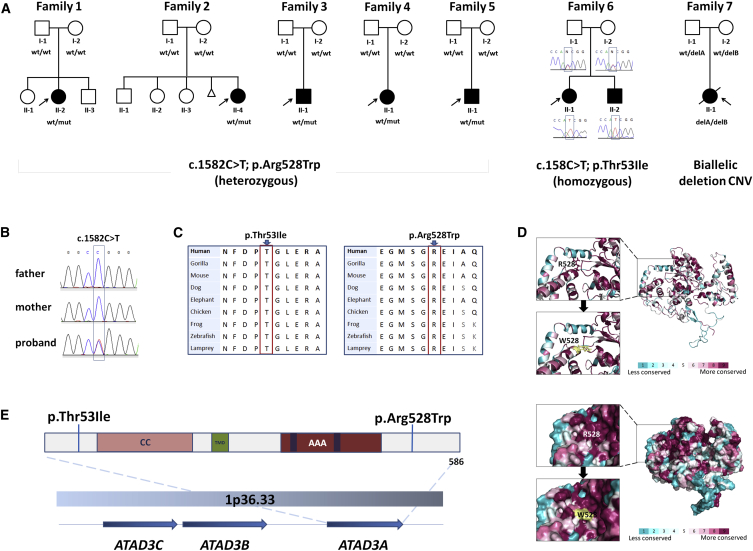
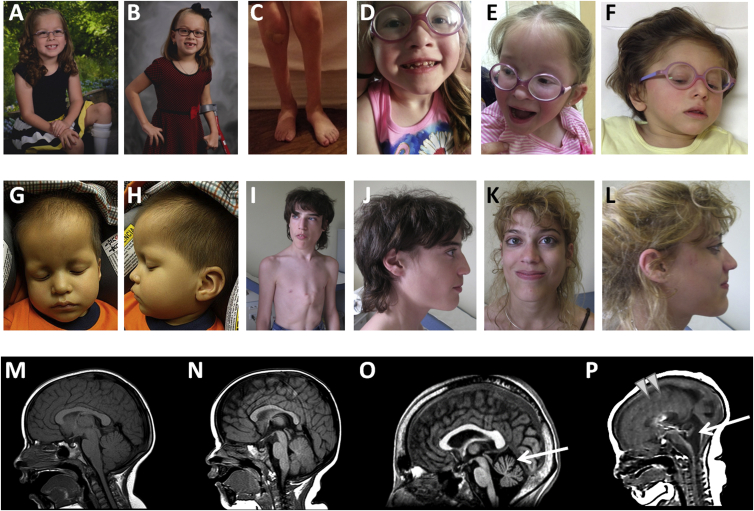
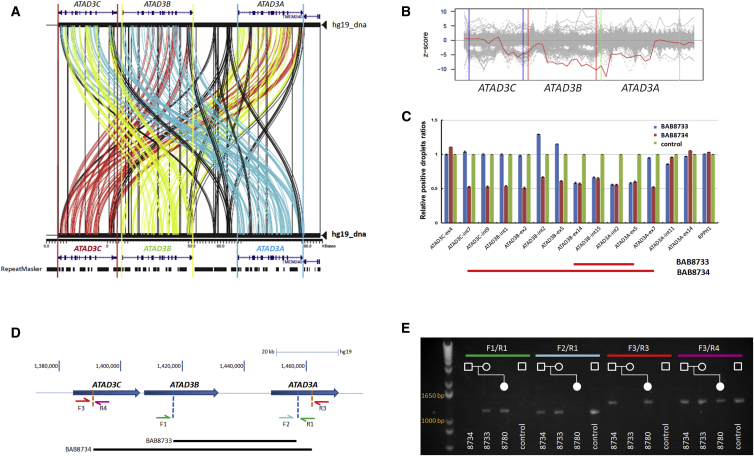
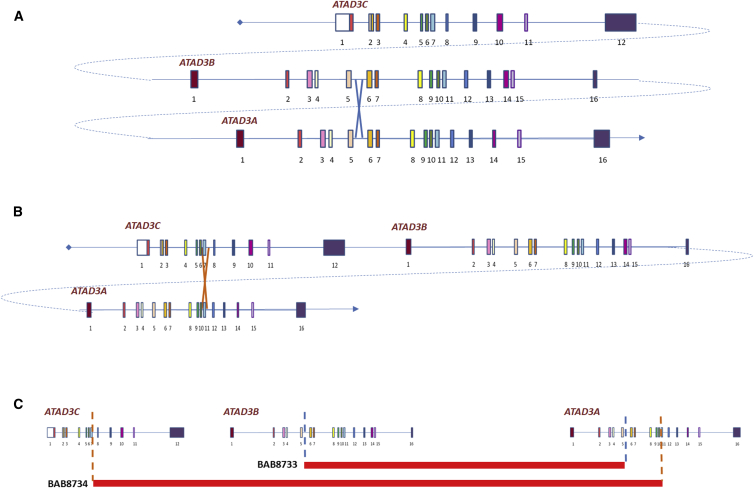
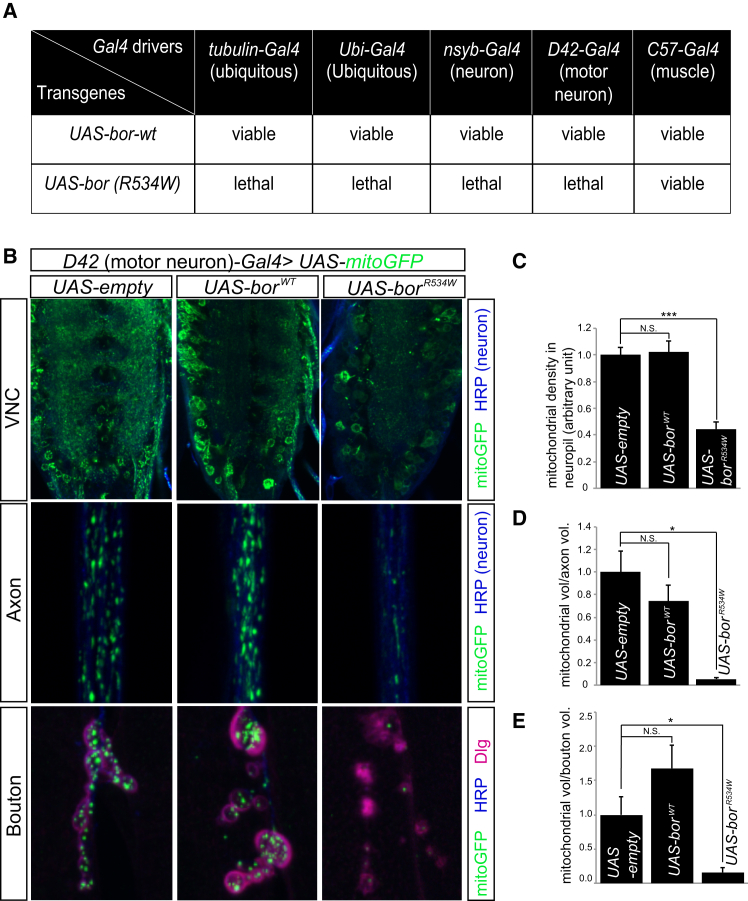
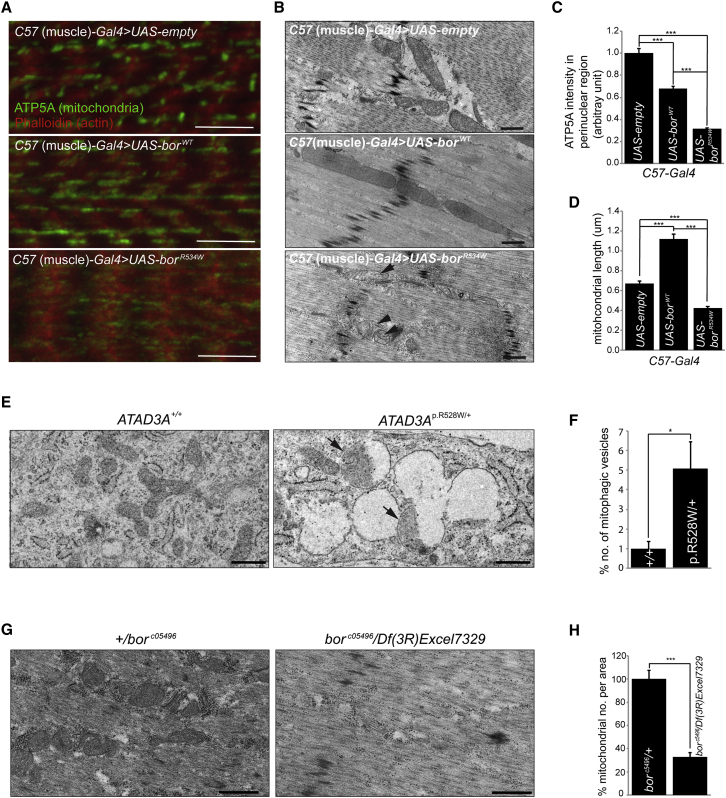
ATPase family AAA-domain containing protein 3A (ATAD3A) is a nuclear-encoded mitochondrial membrane protein implicated in mitochondrial dynamics, nucleoid organization, protein translation, cell growth, and cholesterol metabolism. We identified a recurrent de novo ATAD3A c.1582C>T (p.Arg528Trp) variant by whole-exome sequencing (WES) in five unrelated individuals with a core phenotype of global developmental delay, hypotonia, optic atrophy, axonal neuropathy, and hypertrophic cardiomyopathy. We also describe two families with biallelic variants in ATAD3A, including a homozygous variant in two siblings, and biallelic ATAD3A deletions mediated by nonallelic homologous recombination (NAHR) between ATAD3A and gene family members ATAD3B and ATAD3C. Tissue-specific overexpression of borR534W, the Drosophila mutation homologous to the human c.1582C>T (p.Arg528Trp) variant, resulted in a dramatic decrease in mitochondrial content, aberrant mitochondrial morphology, and increased autophagy. Homozygous null bor larvae showed a significant decrease of mitochondria, while overexpression of borWT resulted in larger, elongated mitochondria. Finally, fibroblasts of an affected individual exhibited increased mitophagy. We conclude that the p.Arg528Trp variant functions through a dominant-negative mechanism that results in small mitochondria that trigger mitophagy, resulting in a reduction in mitochondrial content. ATAD3A variation represents an additional link between mitochondrial dynamics and recognizable neurological syndromes, as seen with MFN2, OPA1, DNM1L, and STAT2 mutations.

Keywords: ATAD3A; CNV; cardiomyopathy; de novo variant; dominant negative; mitochondrial dynamics; neuropathy; optic atrophy; whole-exome sequencing.


Figures

Figure 1
Figure 1
Pedigrees and ATAD3A Variant Details (A) Pedigrees of studied families, indicating the recurrent de novo single-nucleotide variant (SNV) in ATAD3A in families 1–5, a homozygous SNV in family 6, and compound heterozygous deletion copy-number variants (CNVs) in family 7. (B) Sanger validation of the ATAD3A variant in family 1. (C) The p.Thr53Ile and p.Arg528Trp substitutions alter conserved residues. (D) Protein structure prediction shows replacement of the arginine long side chain by a flat aromatic ring of tryptophan. Color spectrum indicates high conservation of the Arg528 residue. Surface structure modeling indicates that the arginine at position 528 resides in a conserved pocket, possibly a functional site. The mutation alters the configuration of the pocket. (E) Schematic representation of ATAD3A (isoform 2) with indication of the coiled-coil domain (CC), transmembrane domain (TMD), and AAA domain including Walker A and Walker B ATP-binding and ATPase domains, respectively. Localization of the altered residues in families 1–6 is indicated. The three human ATAD3 genes are located in tandem on chromosome 1p36.33.
Figure 2
Figure 2
Clinical Findings of Affected Individuals (A–C) Family 1, II-2 at 6 years (A) and 8 years (B), showing high forehead (B) and marked atrophy of the lower legs (C). (D and E) Family 2, II-4 at 5 years with high forehead, small nose, and thin hair. (F) Family 4, II-1 at 5 years with triangular facies, micrognathia, and low-set ears. (G and H) Family 5, II-1 at 23 months, with frontal bossing, deep set eyes, and micrognathia. (I–L) Individuals II-2 (I, J) and II-1 (K, L) from family 6, demonstrating elongated face, triangular nose and prognathism, and pectus carinatum (I). (M–P) Mid-sagittal T1-weighted brain magnetic resonance imaging (MRI) images from affected individuals. (M and N) Individuals with heterozygous recurrent de novo variant show either no significant abnormalities (M, family 1, II-2 at 6 years) or prominent extra-axial spaces and incomplete myelination (N, family 5, II-1 at 8 months). (O) Family 6, II-1, harboring a homozygous ATAD3A missense variant, had moderate atrophy of the cerebellum (arrow) at age 26 years. (P) MRI of family 7, II-1, with biallelic deletion of ATAD3A, showed very poor gyration and sulcation (arrowheads) and hypoplastic cerebellum, vermis, and brainstem (arrow).
Figure 3
Figure 3
Compound Heterozygous Copy-Number Variation in Family 7 (A) Miropeats alignment of the ATAD3 region indicates homology of the three ATAD3 paralogs. ATAD3C reference sequence is indicated in red, ATAD3B reference sequence is indicated in green, and ATAD3A reference sequence is indicated in blue. (B) Target Z score of PCA-normalized read depths for 44 exon targets of the three ATAD3 genes. Comparative read depth data obtained from 2,634 WES samples are shown in gray (clinical collection). Family 7, II-1 is shown in red. Target Z score of PCA-normalized read depths for 16 exons (x axis) spanning portions of ATAD3B and ATAD3A have large negative Z scores (y axis), indicating a copy loss of both alleles. (C) Droplet Digital PCR (ddPCR) detected a larger heterozygous deletion in BAB8734 (father) than the heterozygous deletion in BAB8733 (mother). Primer pairs targeting various exonic or intronic regions of ATAD3C, ATAD3B, and ATAD3A and a control primer pair targeting RPPH1 were used to perform ddPCR in BAB8733 (mother), BAB8734 (father), and a control individual N/A10851. RPPH1 is a gene known to have exactly two copies in the human genome. Ratios of concentrations of positive droplets were plotted for each amplicon tested against the control individual. For a region without deletion, the expected ratio is ∼1, whereas for heterozygous deletion, the expected ratio is ∼0.5 (one deleted copy-number versus two copies). Corresponding raw data of ddPCR and primer sequences are shown in Table S1. (D) Schematic of primer design targeting maternal and paternal deletions and wild-type alleles. PCR amplicons indicating segregation of maternal deletion allele (F1/R1) and paternal deletion allele (F3/R3). Note that proband (BAB8780) lacks wild-type allele amplified by F2/R1 but does have wild-type allele amplified by F3/R4 since the latter is positioned outside the maternal deletion and can be amplified from this allele. (E) Results of PCR breakpoint analysis. Proband inherited both the maternal and paternal deletions.
Figure 4
Figure 4
CNVs in Family 7 Are Mediated by NAHR (A) Homologous exons of the three ATAD3 genes are represented by similar colors. The deletion in BAB8733 (mother) is mediated by nonallelic homologous recombination (NAHR) between the fifth introns of ATAD3B and ATAD3A. (B) The deletion in BAB8734 (father) is mediated by NAHR between the region of exon 7 of ATAD3C and exon 11 of ATAD3A. (C) The boundaries of both deletions are represented by dotted lines.
Figure 5
Figure 5
Expression of Drosophila ATAD3A Ortholog bor with p.Arg534Trp Leads to a Decrease in Mitochondria in Motor Neurons (A) Effects of expression of wild-type bor and borR534W, driven by different Gal4 drivers, on viability. (B) Confocal micrographs of ventral nerve cord (VNC), axons, and boutons from third instar larvae carrying D42-Gal4 and UAS-mito-GFP (green) together with UAS-empty (control), UAS-borWT, or UAS-borR534W. Neurons are labeled by HRP (blue) and boutons by Dlg (red). (C) Quantification of mitochondrial density in VNC neuropil in control, UAS-borWT, or UAS-borR534W larvae carrying D42-Gal4, UAS-mito-GFP together with the respective vectors. (D and E) Quantification of mitochondrial volume in axons (D) and in boutons (E) of larvae carrying D42-Gal4, UAS-mito-GFP together with UAS-empty, UAS-borWT, or UAS-borR534W. (C–E) Error bars indicate standard error of the mean (SEM). p values were calculated by Student’s t test. p < 0.05, ∗∗∗p < 0.001. N.S. indicates not statistically significant.
Figure 6
Figure 6
Expression of Drosophila ATAD3 Ortholog bor with p.Arg534Trp Variant in Muscle Causes a Decrease of Mitochondria (A) Confocal micrographs of muscle from third instar larvae carrying C57-Gal4 together with UAS-empty (control), UAS-borWT, or UAS-borR534W. ATP5A (green) labels mitochondria. Phalloidin (red) labels actin. Scale bars represent 10 μm. (B) TEM of muscle from third instar larvae carrying C57-Gal4 together with UAS-empty (control), UAS-borWT, or UAS-borR534W. Scale bars represent 500 nm. (C) Quantification of ATP5A signal intensity in muscle of larvae carrying C57-Gal4, together with UAS-empty, UAS-borWT, or UAS-borR534W from confocal images (A). (D) Quantification of mitochondrial length in muscle of larvae carrying C57-Gal4, together with UAS-empty, UAS-borWT, or UAS-borR534W from TEM images (B). (E) TEM of fibroblasts from an affected individual (BAB8644, ATAD3Ap.R528W/+) and control (ATAD3A+/+) fibroblasts. Scale bars represent 500 nm. (F) Quantification of mitophagic vesicles (E, arrows) among all vesicles in affected (BAB8644, ATAD3AR528W/+) and control (ATAD3A+/+) fibroblasts. (G) TEM of muscle from first instar larvae for bor mutants (borc05496/Df (3R)Excel7329) and control (borc05496/+). Scale bars represent 500 nm. (H) Quantification of mitochondria per area in bor mutants (borc05496/Df (3R)Excel7329) and control (borc05496/+). (C, D, F, H) Error bars indicate SEM. p values were calculated by Student’s t test. p < 0.05. ∗∗∗p < 0.001. N.S. indicates not statistically significant.

References

    1. Mishra P., Chan D.C. Mitochondrial dynamics and inheritance during cell division, development and disease. Nat. Rev. Mol. Cell Biol. 2014;15:634–646. - PMC - PubMed
    1. Niemann A., Ruegg M., La Padula V., Schenone A., Suter U. Ganglioside-induced differentiation associated protein 1 is a regulator of the mitochondrial network: new implications for Charcot-Marie-Tooth disease. J. Cell Biol. 2005;170:1067–1078. - PMC - PubMed
    1. Pareyson D., Saveri P., Sagnelli A., Piscosquito G. Mitochondrial dynamics and inherited peripheral nerve diseases. Neurosci. Lett. 2015;596:66–77. - PubMed
    1. Züchner S., Mersiyanova I.V., Muglia M., Bissar-Tadmouri N., Rochelle J., Dadali E.L., Zappia M., Nelis E., Patitucci A., Senderek J. Mutations in the mitochondrial GTPase mitofusin 2 cause Charcot-Marie-Tooth neuropathy type 2A. Nat. Genet. 2004;36:449–451. - PubMed
    1. Züchner S., De Jonghe P., Jordanova A., Claeys K.G., Guergueltcheva V., Cherninkova S., Hamilton S.R., Van Stavern G., Krajewski K.M., Stajich J. Axonal neuropathy with optic atrophy is caused by mutations in mitofusin 2. Ann. Neurol. 2006;59:276–281. - PubMed

MeSH terms

Substances