. 2016 Sep 19:7:12810.
doi: 10.1038/ncomms12810.

Cortical dynamics during cell motility are regulated by CRL3(KLHL21) E3 ubiquitin ligase

Affiliations

Cortical dynamics during cell motility are regulated by CRL3(KLHL21) E3 ubiquitin ligase

Thibault Courtheoux et al. Nat Commun. .

Erratum in

Abstract

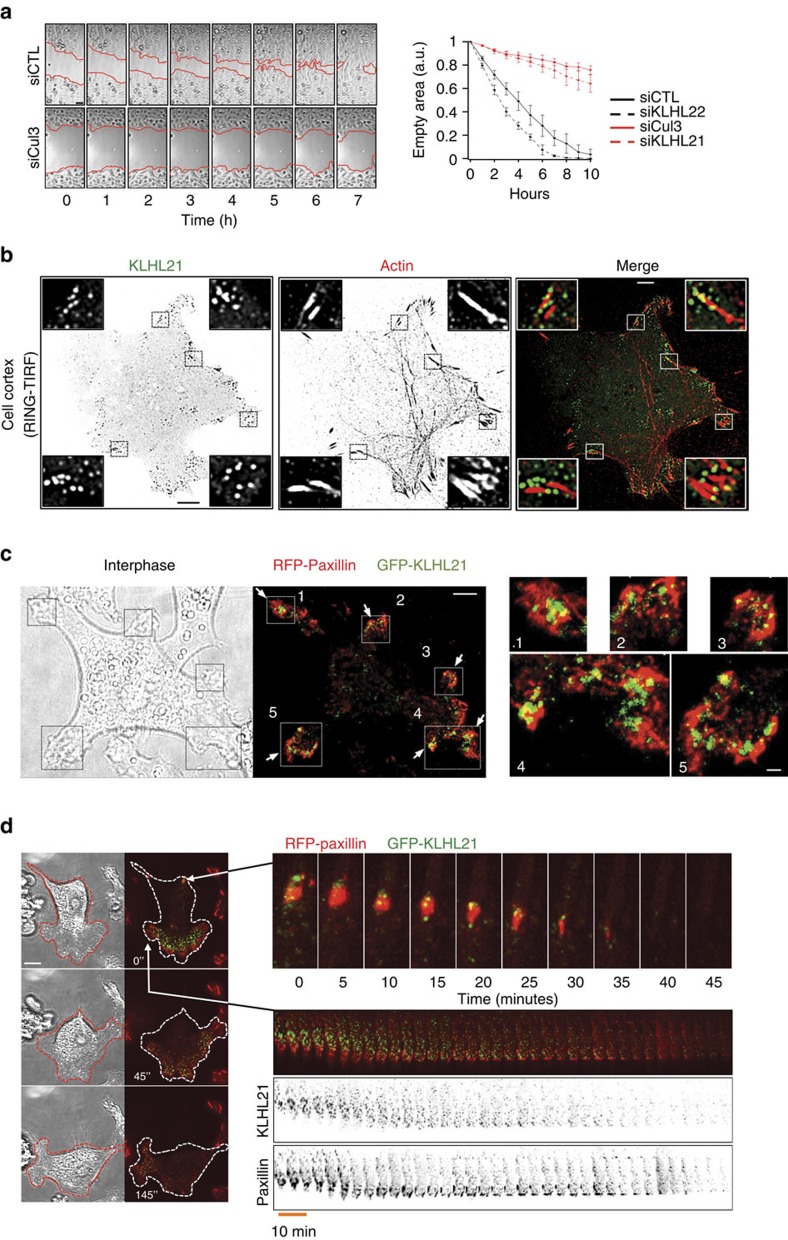
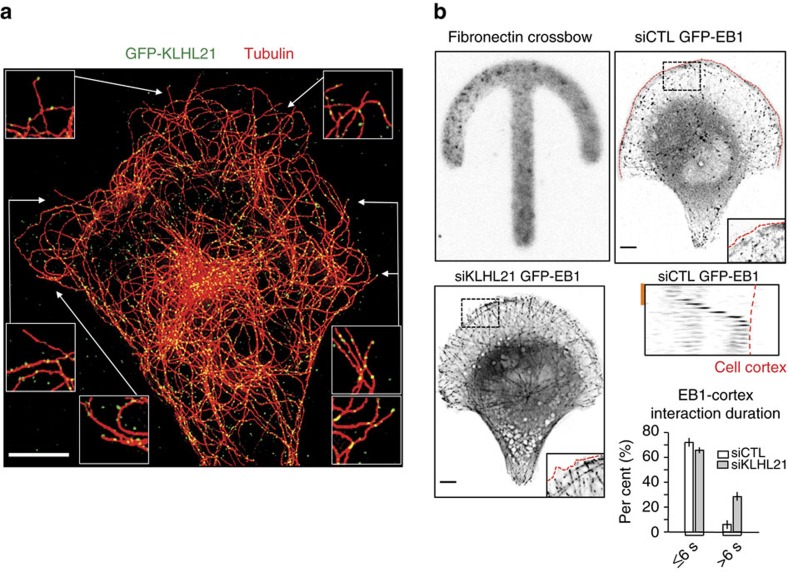
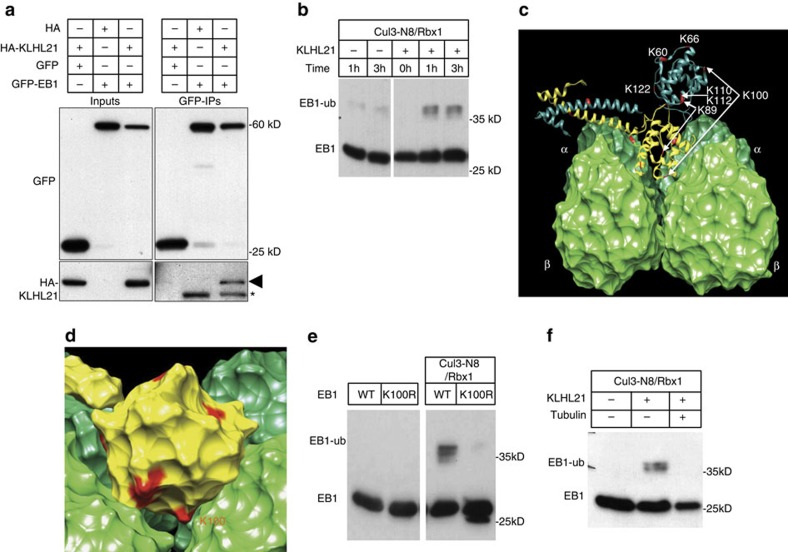
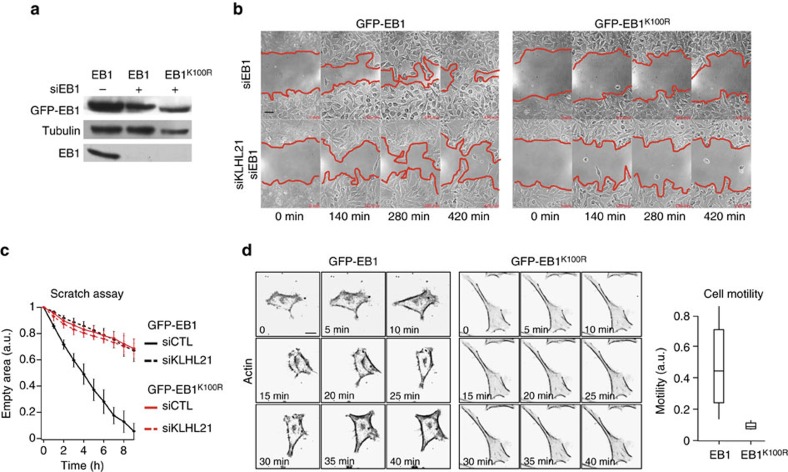
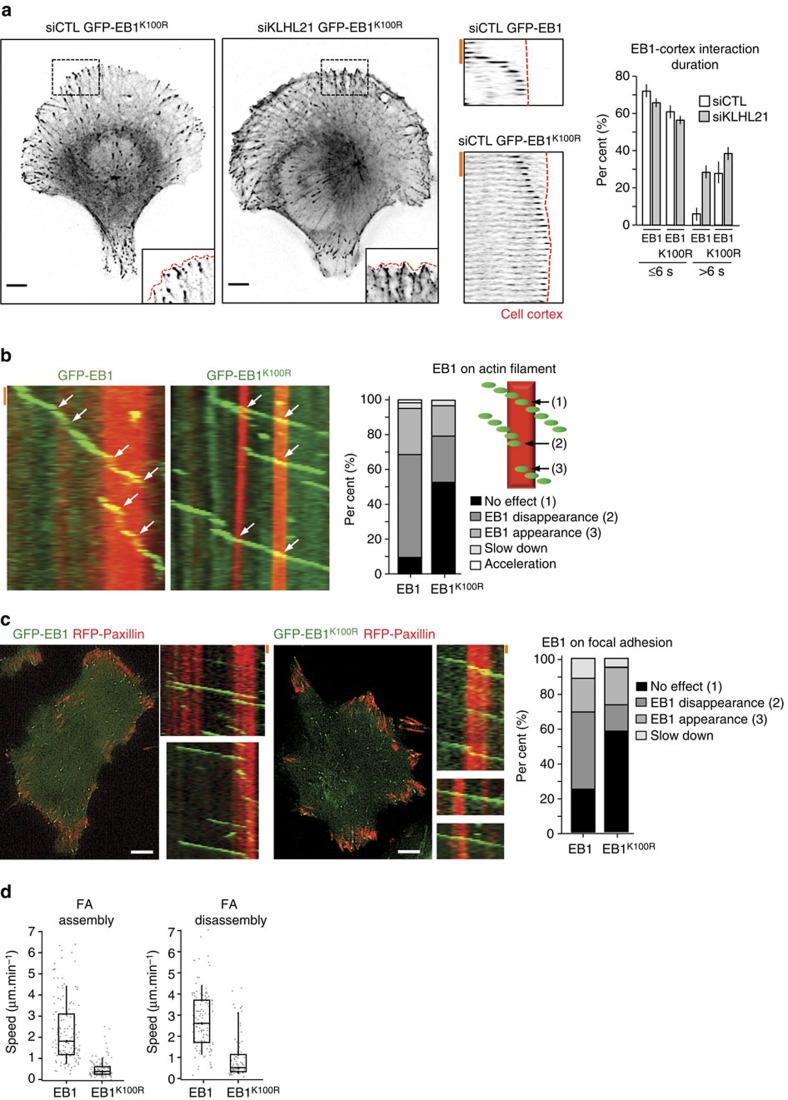
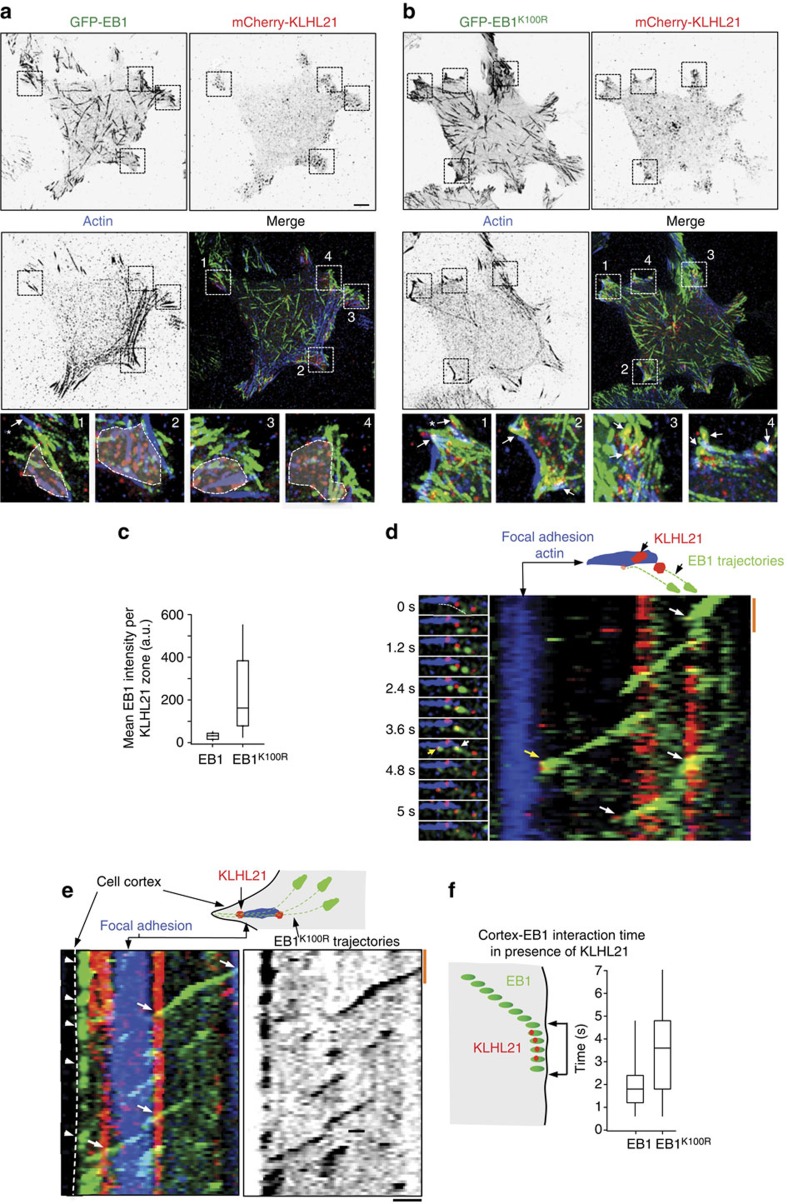
Directed cell movement involves spatial and temporal regulation of the cortical microtubule (Mt) and actin networks to allow focal adhesions (FAs) to assemble at the cell front and disassemble at the rear. Mts are known to associate with FAs, but the mechanisms coordinating their dynamic interactions remain unknown. Here we show that the CRL3(KLHL21) E3 ubiquitin ligase promotes cell migration by controlling Mt and FA dynamics at the cell cortex. Indeed, KLHL21 localizes to FA structures preferentially at the leading edge, and in complex with Cul3, ubiquitylates EB1 within its microtubule-interacting CH-domain. Cells lacking CRL3(KLHL21) activity or expressing a non-ubiquitylatable EB1 mutant protein are unable to migrate and exhibit strong defects in FA dynamics, lamellipodia formation and cortical plasticity. Our study thus reveals an important mechanism to regulate cortical dynamics during cell migration that involves ubiquitylation of EB1 at focal adhesions.


Figures

Figure 1
Figure 1. Cells lacking CRL3KLHL21 exhibit defects in cell migration.
(a) Confluent HeLa cultures treated with the indicated siRNA oligos were scratched (time 0) and the resulting cell-free zone (area within red line) was imaged every hour during closure (Supplementary Movie 1). Scale bar, 60 μm. The empty area was quantified for each siRNA condition, and plotted as arbitrary units (a.u.) against the time after scratching (hours). Error bars indicate variability of three independent experiments. (b) The cortex of living HeLa-FRT/TO cells stably expressing GFP-KLHL21 (left) and stained with low doses of SIR-actin dye (middle) to mark FA was imaged using RING-TIRF microscopy (Supplementary Movie 2, single plane acquisition). Insets show boxed regions at higher magnification. Scale bar, 5 μm. (c) and (d) HeLa-FRT/TO cells stably expressing GFP-KLHL21 (green) and transfected with RFP-Paxillin (red) plasmid were observed using RING-TIRF for several hours. Scale bar, 5 μm. (c) Immobile cell. White arrows show GFP-KLHL21 localization at FA proximity (RFP-Paxillin). Insets show numbered squares at higher magnification. Scale bar 1 μm, Supplementary Movie 3. (d) Mobile cell over time (left panel). Time series of magnified region showing disappearance of FA marker RFP-Paxillin and dynamics of GFP-KLHL21 (upper right panel). Kymograph shows dynamics of a large lamellipodia (lower right panel, Supplementary Movie 4).
Figure 2
Figure 2. KLHL21 affects EB1–cortex interactions.
(a) U20S-FRT/TO cells stably expressing GFP-KLHL21 (green) were stained for tubulin (red) and pre-permeabilised to reduce cytoplasmic staining (maximum intensity projection of a 3 image stack in z with 235 nm step size). Scale bar, 5 μm. (b) U20S cells expressing GFP-EB1 were plated on fibronectin-coated crossbow micro patterns (Cytoo, upper left panel) and depleted for endogenous EB1. Cells were further treated with either control (siCTRL, upper right) or KLHL21 (siKLHL21, lower left) RNAi-oligos and imaged by wide-field microscopy to visualize EB1 comets (Supplementary Movies 5 and 6). Cell cortex is marked by a red line. Scale bar, 5 μm. The boxed area is magnified in the insets. The lower right panel shows a kymograph (top) and quantitation (bottom). Kymograph is of a single Mt marked with GFP-EB1 reaching the cell cortex (red line, Supplementary Movie 6). Red scale bar, 10 s. The duration (in seconds) of the Mt–cortex interaction and sliding of Mts at the cortex was quantified in HeLa cells expressing GFP-EB1, depleted (siKLHL21) or not (siCTL) for KLHL21 with endogenous EB1 depletion in all conditions. Error bars indicate s.d. between three independent experiments.
Figure 3
Figure 3. EB1 is preferentially ubiquitylated on lysine 100.
(a) HeLa cells were co-transfected as indicated with plasmids expressing HA-KLHL21 and GFP-EB1, or the corresponding empty HA- or GFP controls. Cell extracts were incubated with anti-GFP antibodies (GFP-IP) and bound proteins analysed by immunoblotting with anti-GFP (upper panels) or HA antibodies (lower panels). An aliquot of the cell extract was used to control protein expression (input). The black arrow marks HA-KLHL21 co-immunoprecipitating with GFP-EB1, while the asterisk points to GFP-EB1 cross reacting with the secondary antibody used for immunoblotting. (b) Purified EB1 was incubated with reconstituted and neddylated (N8) Cul3/Rbx1/UbH5 and ubiquitin (Ub) in the absence (−) or presence (+) of KLHL21 purified from E. coli. At the indicated times (hours), the reaction was stopped and analysed by immunoblotting with EB1-antibodies. The position of unmodified (EB1) and ubiquitylated EB1 (EB1-ub) is indicated. (c) Schematic representation of a EB1-dimer (yellow and cyan) binding to α-β tubulin (dark and light green, respectively, adapted from Maurer et al. and Slep et al.31). The positions of the ubiquitylated lysine residues identified by mass spectrometry from the in vitro reaction shown in d are indicated. (d) The position of lysine 100 (K100) was mapped on EB1 surfaces known to be involved in Mt binding. (e) Recombinant EB1 or EB1K100R alone (left panel) or with recombinant E2 and E3 enzymes (right panel) were subjected to in vitro ubiquitylation reactions as described in d. (f) Recombinant EB1 was subjected to in vitro ubiquitylation reactions with recombinant E2 and E3 enzymes and ubiquitin as described in d in the presence (+) or absence (−) of KLHL21 and stabilized Mts. The position of unmodified (EB1) and ubiquitylated EB1 (EB1-ub) is indicated.
Figure 4
Figure 4. Ubiquitylation of EB1 may regulate cell migration.
(a) Total cell extracts of HeLa cells stably expressing GFP-EB1 or GFP-EB1K100R from the doxycycline (Dox)-inducible promoter were analysed by immunoblotting. Where indicated (+), cells were treated with siRNA oligos specifically targeting the endogenous copy of EB1. (b) Confluent HeLa cultures depleted of endogenous EB1 but stably expressing GFP-EB1 or GFP-EB1K100R were treated with control siRNA (siCTL) or siRNA specifically depleting KLHL21 (siKLHL21) and scratched at time 0. (c) The resulting cell-free zone (area within red line) was imaged every hour during closure, and the empty area quantified for each siRNA condition by plotting arbitrary units (a.u.) against the time after scratching (hours). Error bars indicate variability of three independent experiments. (d) Images from time lapse movies of individual HeLa cells depleted of endogenous EB1 but expressing either GFP-EB1 or GFP-EB1K100R (Supplementary Movie 3) and stained with SIR-Actin dye. Cell motility was quantified using the Manual Tracking plugin of Image J (scale bar, 20 μm), and expressed as velocity mean (a.u.).
Figure 5
Figure 5. EB1 ubiquitylation on K100 regulates Mt–cortex interactions.
(a) U2OS cells expressing GFP-EB1 or GFP-EB1K100R were plated on fibronectin-coated crossbow micro patterns (Cytoo) and depleted for endogenous EB1. Cells were treated with either control (siCTRL) or KLHL21 RNAi-oligos (siKLHL21) and imaged by wide field microscopy (Supplementary Movies 5 and 6). Cell images (left panel) show EB1 comets. Cell image insets show the boxed area at higher magnification with cell cortex marked by a red line. Scale bar, 5 μm. Kymographs (middle panels) of a single Mt marked with GFP-EB1 (upper) or GFP-EB1K100R (lower) reaching the cell cortex (red line, Supplementary Movie 4). Red scale bar, 10 s. Graph (right panel) shows duration (seconds) of the Mt–cortex interaction and sliding of Mts at the cortex quantified from HeLa cells expressing GFP-EB1 or GFP-EB1K100R, depleted (siKLHL21) or not (siCTL) for KLHL21 with endogenous EB1 depletion in all conditions. Error bars indicate s.d. between three independent experiments. (b) U2OS cells depleted for endogenous EB1 and stably expressing GFP-EB1 or GFP-EB1K100R were plated on fibronectin-coated crossbow micro patterns (Cytoo, Supplementary Fig. 6), and stained with the actin dye SIR-actin. Kymographs of individual Mts (indicated by the dotted lines in Supplementary Fig. 6). Individual Mt tips (left image panels) marked by GFP-EB1 or GFP-EB1K100R (green) were analysed as they encounter actin filaments visualized by staining with SIR-dye (red) (Supplementary Movie 8). Kymographs (right panel) were quantified and classified as schematically summarized (drawing) into number of events shown as a per cent (%) where GFP-EB1 is removed from Mt tips (2), is removed but then reappears (3, rescue) or is unaffected and crosses the actin filament (1). Moreover, the per cent (%) of actin filament encounters that slow down or accelerates Mt growth rates were also counted (red scale bar, 4 s). (c) Images of HeLa cells expressing GFP-EB1 or GFP-EB1K100R (green) and transfected with RFP-Paxillin plasmid (red) were obtained using RING-TIRF, scale bar, 5 μm. Kymographs (right of image panel) were quantified (right graph panel) and show single cortical MT behaviours when crossing FAs (red scale bar, 10 s). Error bars indicate variability of three independent experiments. (d) Focal adhesion speeds were quantified using RING-TIRF microscopy on cells expressing Paxillin-RFP and either wild-type EB1 or the non-ubiquitinylatable EB1K100R mutant. The data are shown as box plots on top of the single measurements (n>150 FAs per condition, P<1e−30 for assembly and P<4e−20 for disassembly).
Figure 6
Figure 6. KLHL21 regulates EB1 turnover at FA and actin at cell cortex.
HeLa-FRT/TO cells stably expressing GFP-EB1 (a) or GFP-EB1K100R (b) (green) were transfected with a plasmid expressing RFP-KLHL21 (red) and stained with low doses of SIR-actin dye (blue). The cortex of living cells was imaged using RING-TIRF microscopy, and a time projection is shown (Supplementary Movie 9–11). Individual images depicting GFP-EB1, RFP-KLHL21 and actin as well as merged images are included. Insets (bottom row numbered 1 to 4) show square regions at higher magnification. RFP-KLHL21 patch at FA is circled with a white spotted line. Scale bar, 5 μm. (c) Mean EB1 intensity per KLHL21 zone described in a and b (35 different zones per condition, see Methods). (d) Image series (left panel, seconds) and kymograph of GFP-EB1 as in a show GFP-EB1 as it reaches the KLHL21-positive FA structure (Supplementary Movie 10). The discontinued line in the corresponding illustration represents the GFP-EB1 trace reaching the FA and recruited RFP-KLHL21 (kymograph, red scale bar: 6 s, horizontal scale bar, 800 nm). The arrows mark EB1-KLHL21 co-localization, preceding disappearance of GFP-EB1 or in some cases pausing of Mt growth. (e) Same as d with GFP-EB1K100R as in b with white arrows to mark GFP-EB1K100R co-localizing with RFP-KLHL21. Red scale bar, 6 s, horizontal scale bar, 1 μm. Red white discontinued line represents cell cortex. (f) The duration (in seconds) of individual Mts marked with GFP-EB1 or GFP-EB1K100R co-localizing with RFP-KLHL21 at the cell cortex (bracket) was quantified and shown as a box blot.

Similar articles

Cited by

References

    1. Akhshi T. K., Wernike D. & Piekny A. Microtubules and actin crosstalk in cell migration and division. Cytoskeleton (Hoboken) 71, 1–23 (2014). - PubMed
    1. Vasiliev J. M. et al.. Effect of colcemid on the locomotory behaviour of fibroblasts. J. Embryol. Exp. Morphol. 24, 625–640 (1970). - PubMed
    1. Mitchison T. & Kirschner M. Dynamic instability of microtubule growth. Nature 312, 237–242 (1984). - PubMed
    1. Wloga D. & Gaertig J. Post-translational modifications of microtubules. J. Cell Sci. 123, 3447–3455 (2010). - PMC - PubMed
    1. Jiang K. & Akhmanova A. S. Microtubule tip-interacting proteins: a view from both ends. Curr. Opin. Cell Biol. 23, 94–101 (2011). - PubMed

Publication types