. 2016 Sep 22;167(1):203-218.e17.
doi: 10.1016/j.cell.2016.08.030. Epub 2016 Sep 15.

Epithelia Use Butyrophilin-like Molecules to Shape Organ-Specific γδ T Cell Compartments

Affiliations

Epithelia Use Butyrophilin-like Molecules to Shape Organ-Specific γδ T Cell Compartments

Rafael Di Marco Barros et al. Cell. .

Abstract

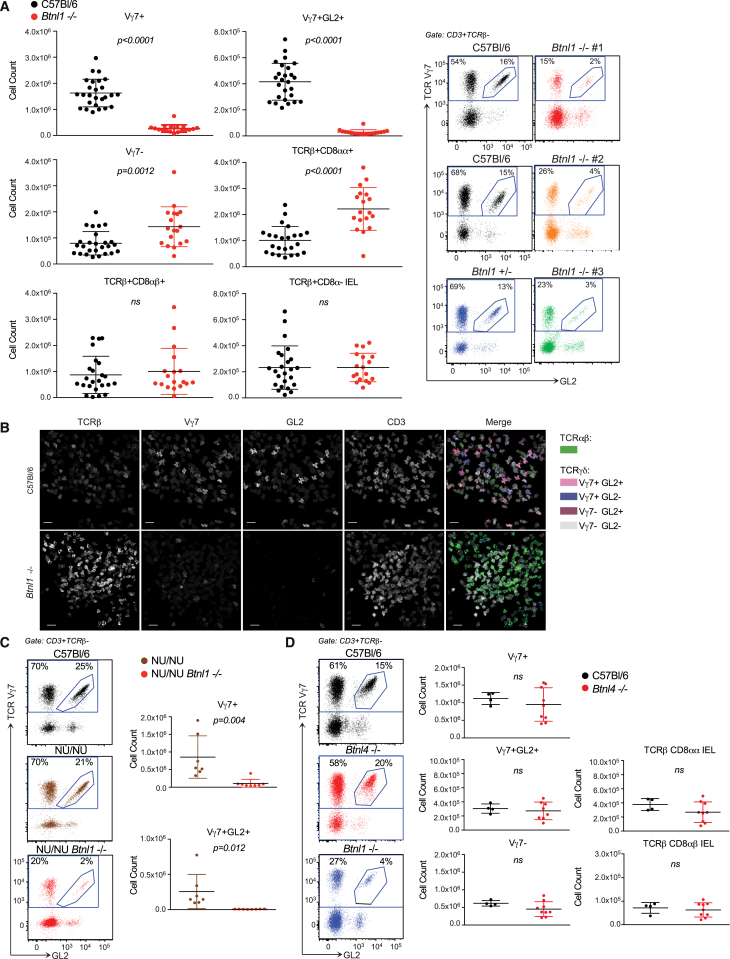
Many body surfaces harbor organ-specific γδ T cell compartments that contribute to tissue integrity. Thus, murine dendritic epidermal T cells (DETCs) uniquely expressing T cell receptor (TCR)-Vγ5 chains protect from cutaneous carcinogens. The DETC repertoire is shaped by Skint1, a butyrophilin-like (Btnl) gene expressed specifically by thymic epithelial cells and suprabasal keratinocytes. However, the generality of this mechanism has remained opaque, since neither Skint1 nor DETCs are evolutionarily conserved. Here, Btnl1 expressed by murine enterocytes is shown to shape the local TCR-Vγ7(+) γδ compartment. Uninfluenced by microbial or food antigens, this activity evokes the developmental selection of TCRαβ(+) repertoires. Indeed, Btnl1 and Btnl6 jointly induce TCR-dependent responses specifically in intestinal Vγ7(+) cells. Likewise, human gut epithelial cells express BTNL3 and BTNL8 that jointly induce selective TCR-dependent responses of human colonic Vγ4(+) cells. Hence, a conserved mechanism emerges whereby epithelia use organ-specific BTNL/Btnl genes to shape local T cell compartments.


Figures

Image 1
Graphical abstract
Figure 1
Figure 1
Selective Maturation and Expansion of Intestinal IELs in Mice (A) Gating strategy for small intestinal (SI) Vγ7+ IELs in 12-week-old C57Bl/6 mice (n ≥ 12). Bottom right: Vγ7+ IEL representation over time (n = 5, week 20–36; n ≥ 12, other time points). (B) IEL composition assessed by confocal microscopy of proximal SI whole mounts (n = 3) and corresponding quantification (right). (C) Top: surface phenotypes of Vγ7+, Vγ7 (CD3+TCRβVγ7) and αβ IELs from 21- to 40-day-old mice (n ≥ 8). Bottom: gene expression in Vγ7+ versus Vγ7 IELs (n = 3). (D) Surface phenotypes of Vγ7+ IELs at days 14–17 versus days 21–40 (n ≥ 7). (E) Top: surface phenotype of Vγ7+ IELs at day 14 and day 28 (CD122 median fluorescence intensity [MFI]-colored text). Bottom: surface phenotype of CD122HIThy1Vγ7+ versus CD122LOThy1+Vγ7+ IELs at days 14–17 (n ≥ 7). (F) Heatmap of genes differentially expressed between Vγ7+CD122HI and Vγ7+CD122LO IELs from day 14–17 mice and between Skint1-selected and non-selected Vγ5+ DETC progenitors (n = 4). (G) Ki67 expression in Vγ7+ versus Vγ7 IELs directly ex vivo (n = 4, day 19; n = 8–27, other time points). Data are representative of one (C, qPCR, B and F) or three or more (C, cytometry, D and E, top) independent experiments. Some panels present data pooled from three or more (E), more than ten (G), and >20 (A) independent experiments. D, day; W, week. All error bars represent mean ± SD. See also Figure S1.
Figure 2
Figure 2
A Gut IEL Selecting Element (A) Left: IEL composition in WT versus NU/NU mice; antibody GL2 detects TRDV2-2-encoded Vδ4 chain. Right: surface CD122 expression on NU/NU Vγ7+ IELs (n ≥ 12). (B) IEL composition (top), enumeration (bottom left), and CD122 expression (bottom right) in germ-free (GF), food antigen-free (FAF), or GF-FAF C57Bl/6 mice at weeks 9–13 (n ≥ 4). (C) qRT-PCR of denoted genes. (D) Histological analysis of Btnl1 RNA (middle: RNAScope) and 3-hr BrdU incorporation in vivo (bottom) in paraffin-embedded SI gut rolls (n ≥ 3). (E) RNAScope of Btnl1, Btnl4, and Btnl6 in WT versus Btnl1−/− and Btnl4−/− mice. Data are representative of two (B), two or more (D and E), or three or more (A) independent experiments. In (C), data are pooled from two independent experiments. All error bars represent mean ± SD. See also Figure S2.
Figure 3
Figure 3
Gut IEL Composition Depends on Btnl1 (A) Left: enumeration of IEL subsets from week 6–15 WT and Btnl1−/− mice by flow cytometry. Right: representative data from three independently derived Btnl1−/− lines and controls (n ≥ 6). (B) Confocal microscopy of proximal SI whole mounts from week 10 WT and Btnl1−/− mice (n = 3). (C) Vγ7+ IEL representation (left) and enumeration (right) of WT (2.6 m ± 630,000), NU/NU (0.9 m ± 600,000) and Btnl1−/− NU/NU mice (0.1 m ± 120,000). (D) Representation (left) and enumeration (right) of IEL subsets from WT, Btnl1−/−, and Btnl4−/− mice. Some panels include data pooled from two (C and D) or six independent (A) experiments. All error bars represent mean ± SD. See also Figure S3.
Figure 4
Figure 4
Btnl1 Drives Selective Expansion and Maturation of Gut IEL (A) 3 hr EdU incorporation in vivo in γδ IEL subsets and thymocytes from week 4 WT versus Btnl1−/− mice (n ≥ 9). (B) Surface phenotypes of Vγ7+ and Vγ7GL2+ IELs from week 3–5 WT and Btnl1−/− mice (n ≥ 8). (C) Top: Thy1 and CD122 expression by Vγ7+ IEL from day 35 Btnl1−/− mice (n = 8). Bottom: surface phenotypes of CD122HIThy1 and CD122LOThy1+ Vγ7+ IELs from week 4–6 Btnl1−/− mice (n ≥ 4). W, week. (D and E) IEL reconstitution and CD122 profiles in (D) irradiated TCRδ−/− mice 9–10 weeks post-BM transfers from indicated donors (n ≥ 7) and (E) irradiated CD45.2+ WT or Btnl1−/− mice 4–5 weeks post-BM transfers from CD45.1+ C57Bl/6 mice (n = 7). Data are representative of two (D and E) or three or more (C, top) independent experiments. Panels (A) and (C) (bottom) present data pooled from three or more experiments. All error bars represent mean ± SD. See also Figure S4.
Figure 5
Figure 5
Villin-Specific Btnl1 Induction Rescues Vγ7+ IEL In Vivo (A–D) Week 7–13 (adult) or day 7–21 (pups) mice of indicated genotypes on a Btnl1−/− background were administered Dox (1 mg/ml, 2% sucrose) or control water (2% sucrose) for times indicated, and IELs were analyzed by flow cytometry. n ≥ 5 (A and B); n ≥ 6 (C and D). (E) Comparative cell-surface phenotypes of Vγ7+ IELs from week 4–5 WT mice and animals indicated (n = 4–8). (A) is representative of two or more independent experiments; (B)–(E) present data pooled from three or more experiments. Statistical significance in (C) was determined using the Holm-Sidak method. All error bars represent mean ± SD. See also Figure S5.
Figure 6
Figure 6
Gut Vγ7+ IELs Respond to Btnl Proteins (A) Left: surface CD25 expression of designated IEL subsets after 12-hr co-culture of total IELs with MODE-K cells transduced with empty vector (EV), Btnl1 (L1), Btnl6 (L6), or Btnl1 plus Btnl6 (L1+6). Right: fold increase in CD25+ cells as percentage of the IEL subset relative to co-culture with MODE-K.EV (n = 21). (B) GFP and CD25 expression by designated IELs from Nur77.gfp mice ex vivo or after 12-hr co-culture of total IELs with designated cells (n = 8). (C) Percentage of Vγ7+ IELs from Nur77.gfp mice that were CD25+GFP+CD122 directly ex vivo or after 12-hr co-culture of total IELs with designated cells. (D) CD3 expression in Vγ7+CD25+ or Vγ7+CD25 IELs after 12-hr co-culture of total IELs with MODE-K.L1+6 (n = 21). (E) Surface CD25 expression as percentage of Vγ7+ IELs after indicated transwell co-culture conditions (n = 3). (F) Surface CD25 expression on Vγ7+ IELs from WT and Btnl1−/− mice after indicated culture conditions (n = 7). (G) Surface CD25 expression by designated IEL subsets after incubation with anti-CD3 or control immunoglobulin (Ig) (n ≥ 12). (H) Cytokine concentrations assessed by luminex in supernatants after 48 hr of co-cultures indicated (n = 3). Data are representative of one (H), two (B) or more than three (A, D, and E) independent experiments. Some panels present data pooled from two (C) or more than three (A, F, and G) independent experiments. All error bars represent mean ± SD. See also Figure S6.
Figure 7
Figure 7
Regulation of Human Gut Vγ4+ Cells by BTNL3 and BTNL8 (A and B) Vδ (A, n = 17) and Vγ (B, n = 6–10) expression by human gut γδ cells. (C) Surface TCRγδ/Vδ1 expression on human gut lymphocytes after 12-hr co-culture with BTNL3 (L3) or BTNL3 plus BTNL8 (L3+8)-transduced HEK293T cells. Red arrows denote shifts in TCR staining. (D) Top: TCRγδ/CD3 expression on designated human gut T cells after 12-hr co-culture with denoted HEK293T transductants. Bottom: mean fluorescence intensities (MFIs) calculated relative to co-culture with HEK293T.EV (n ≥ 22). For two donors, MFIs for Vδ2 cells remained unchanged (dots within the ellipse). (E) Percentage of CD25HI cells among TCRγδ+TCRVδ2 T cells after co-culture with denoted cells (n = 5). Statistical analysis was performed by paired t test. (F) Surface Vγ2/3/4 and Vδ1 expression on Vδ2 γδ T cells after co-culture with cells denoted. (G) TCRγδ expression on indicated subsets after co-culture with denoted cells. (H) TCRγδ expression on γδ cells from peripheral blood mononuclear cells (PBMCs) or skin after co-culture with denoted cells. All error bars represent mean ± SD. See also Figure S7 and Table S1.
Figure S1
Figure S1
Phenotypic Differences between CD122HI Vγ7+ IELs and Other IEL Subsets, Related to Figure 1 (A) Cell surface phenotype of Vγ7+, Vγ7- (CD3+TCRβ-Vγ7-) and αβ (TCRβ+) IEL from 3-5 week old (W3-5) C57Bl/6 (WT) mice (n ≥ 7). (B) Cell surface phenotype of WT Vγ7+CD122HI versus Vγ7+CD122LO IEL (n ≥ 7). (C) Heat map of genes differentially expressed (log-2-FoldChange) between Vγ7+CD122hi and Vγ7+CD122lo IEL sorted from D14-D17 WT mice. Data generated by RNA sequencing (‘cell cycle’ & ‘cell surface’ GO terms annotated). Values scaled to their median value across the samples. (D) 3hr EdU incorporation in vivo in Vγ7+ versus Vγ7- IEL from D28 WT mice assessed by flow cytometry in indicated IEL subsets (Vγ7- are CD3+TCRβ-Vγ7-). Data are representative of 1 (C) or ≥ 3 (A,B) independent experiments. Panel (D) presents data pooled from 3 independent experiments. All error bars represent mean ± SD. Related to Figure 1.
Figure S2
Figure S2
Local Intestinal Development of CD122HI Vγ7+ IELs, Related to Figure 2 (A) Deep sequencing of TCR Vδ chain usage in WT Vγ7+ IEL sorted from W7-10 C57Bl/6 (WT) mice (n = 3). (B) Absolute numbers of WT Vγ7+ and Vγ7+GL2+ thymocytes from WT mice assessed by flow cytometry. C-D) Cell surface phenotype of WT Vγ7+ IEL and thymocytes at indicated time points. (E) Cell surface phenotype of Vγ7+ thymocytes and IEL isolated from W3-5 WT mice (n = 5). (F) γδ IEL composition (left), cell count (middle) and cell surface CD122 expression (right) in WT versus alymphoplasia (aly/aly) mice. (G) Longitudinal RNAscope analysis of Btnl1 expression during gut development. (H) Gene expression by qRT.PCR along the length of the gut in WT mice (n ≥ 3). (I) Gene expression by qRT.PCR in the thymus of WT and Btnl1−/− animals compared to the proximal small intestine. (J) Organization of WT and targeted loci for Btnl1−/−, Btnl1indel/indel and Btnl4−/− mice. Grey: untranslated region; green: translated region; orange: inserted targeting cassette. Knockout ES cell clones were obtained from the international mouse consortium IKMC-ID 67994 (Btnl1) and 81524 (Btnl4). (K) Southern blot for targeting of alleles in Btnl1−/− and Btnl4−/− mice. Genomic DNA was digested using the indicated enzymes (arrowheads). Probes targeting the indicated regions were generated to detect the WT and targeted alleles. Data are representative of ≥ 1 (A,K) or ≥ 2 (C,E,G,H,I) independent experiments. Some panels include data pooled from 2 (F), > 3 (D) or > 6 (B) independent experiments. All error bars represent mean ± SD. Related to Figure 2
Figure S3
Figure S3
Btnl1 Has No Detectable Effect on the Systemic T, B, and Myeloid Cell Compartments, Related to Figure 3 (A) γδ IEL composition in adult WT versus Btnl1indel/indel mice (n = 3) (B) Mesenteric Lymph Node (MLN) and (C) Splenic immune compartments of WT, Btnl1+/− and Btnl1−/− analyzed by flow cytometry (n = 7–9). (D) TCRVγ chain usage in MLN and splenic lymphocytes harvested from WT, Btnl1+/− and Btnl1−/− mice assessed by flow cytometry (n = 8). (E) Vγ7+ and Vγ7+GL2+ thymocytes from WT or Btnl1+/− and Btnl1−/− mice assayed by flow cytometry to enumerate total cell counts (left) and cell surface phenotype (right) at three time points. Panels (A-D) are representative of 1 experiment. Panel E-left presents data pooled from ≥ 2 independent experiments. All error bars represent mean ± SD. See Table S3.
Figure S4
Figure S4
Impact of Btnl1 on Intestinal Engraftment, Expansion, and Retention of CD122HI Vγ7+ IELs, Related to Figure 4 (A) Ki67+ expression in Vγ7+ IEL isolated from WT versus Btnl1−/− mice (n = 4-27). (B) Cell surface phenotype of Btnl1−/− Vγ7+CD122HI versus Vγ7+CD122LO and Vγ7+GL2+CD122HI versus Vγ7+GL2+CD122LO IEL displayed in Figure 4B (n ≥ 8). (C) Irradiated TCRδ KO mice reconstituted with WT bone marrow (BM) were analyzed for γδ IEL composition at the indicated time-points after BM transfer (n ≥ 3). (D) IEL isolated from WT W4-5 mice were column-purified using CD45 microbeads and adoptively transferred intravenously into W6 TCRδ−/− or TCRδ−/−Btnl1−/− hosts. γδ T cell composition was assayed 2-3 weeks later by flow cytometry (n ≥ 5). Data are representative of 1 (C), 2 (D) or ≥ 3 (B) independent experiments. Bar graph displays mean ± SD. All error bars represent mean ± SD.
Figure S5
Figure S5
Inducible Btnl1 Transgene Expression and Its Impact in Adult Mice, Related to Figure 5 (A) Schematic representation of the WT Btnl1 locus (top) and TRE-Btnl1 transgene construct (bottom). Grey: unstranslated region; green: translated region; orange: upstream-tetracycline response element/CMV promoter and downstream-β-globulin/polyA. (B) Southern blot to detect transgene insertion. Genomic DNA was digested with EcoR1 as indicated (arrowheads) and a probe (blue bar) targeting the indicated region (Exon3/4 boundary in ORF) was generated to detect the WT and targeted allele (n = 2). C-F) W7-13 (ADULT) mice of indicated genotypes on a Btnl1−/− background were administered doxycycline water (1mg/ml Dox, 2% suchrose) or ctrl water (2% suchrose) for 1-2 weeks. (C) Gene expression by qRT.PCR in proximal small intestine of adult mice following the indicated treatment. (D) γδIEL composition (left) and absolute cell counts (right) assessed by flow cytometry in adult mice following the indicated treatment (sugar, n = 3-5; rest, n = 4-10). (E) Ki67 and cell surface CD122 expression in Vγ7+ IEL from adult mice following the indicated treatment. (F) Ki67 expression in Vγ7+ versus Vγ7- and TCRβ+ IEL from adult mice following the indicated treatment (n = 5-9). Data are representative of 2 (B), or 3 independent experiments. Some panels include results pooled from 2 (C) or ≥ 3 (D,F) independent experiments. All error bars represent mean ± SD.
Figure S6
Figure S6
Co-expression of Btnl1 and Btnl6 and Their Impact on Vγ7+ IELs, Related to Figure 6 (A) Cell surface expression of FLAG-Btnl1, HIS-Btnl4 or HA-Btnl6 co-transfected in MODE-K cells. Histogram overlays show the expression of each BTNL after gating on GFP+ cells (numbers in brackets indicate geometric mean fluorescence intensity, gMFI). (B) Primary small intestinal IEL cultured for the indicated times with MODE-K cells transduced with constructs expressing an empty vector (EV) versus Btnl1+Btnl6 (L1+6) (n = 7). (C) Representative plots of cell surface CD122 and CD25 expression on Vγ7+ cells after the indicated overnight culture conditions (n = 21). (D) Cell surface CD25 expression in positively FACS-sorted Vγ7+ IEL after overnight co-culture with MODE-K cells expressing EV versus L1+6 (n = 4). (E) Cell surface CD25 expression in primary Vγ7+ IEL after overnight co-culture with the indicated MODE-K transductants in the presence PP2, PP3 or vehicle. Data are representative of representative of 2 (A,D), or > 5 (C) independent experiments. Some panels (B,E) present data pooled from 2 independent experiments. All error bars represent mean ± SD.
Figure S7
Figure S7
Human Intestinal γδ Cells and the Selective Impact on Them of BTNL3 and BTNL8 Co-expression, Related to Figure 7 (A) FACS-sorted γδ T cells harvested from human intestinal tissue were analyzed by deep sequencing for TCR Vγ chain usage. (B) Schematic illustrating the murine and human Btnl2/BTNL2 and Btnl9/BTNL9 loci, adapted from the NCBI gene viewer. (C) Conventional RT-PCR analysis of BTN3A2, BTNL3 and BTNL8 expression in the indicated tissues. (D) Conventional RT-PCR analysis of BTN3A1, BTNL3, BTNL8, EPCAM and TCR Vγ2/3/4 expression in the indicated samples. (E) Cell surface expression of FLAG-BTNL3, FLAG-BTNL8S or FLAG-BTNL8 co-transfected in HEK293 cells with the indicated constructs. Histogram overlays show the expression of each BTNL after gating on GFP+ cells (numbers in brackets indicate geometric mean fluorescence intensity, gMFI). (F) Schematic illustrating the method of human intestinal tissue-resident lymphocytes isolation and co-culture with HEK293 transductants. (1) Endoscopic biopsies recovered from ascending colon of healthy donors. (2) Washed in complete media supplemented with antibiotic. (3) 1 biopsy applied to each matrix. (4) Culture for 5-7 days in complete medium supplemented with antibiotics, IL-2 and IL-15. (5) Co-culture with HEK293 cell lines transduced with EV, L3, L8 or L3+8. (G) Cell surface CD25 expression on indicated subsets of human gut-derived lymphocytes after co-culture with EV versus L3+8-transduced HEK293 cells. (H) Gating parameters for sorting of Btnl3+8-responsive human gut-derived lymphocytes. (I) TCRVγ chain usage (left) and cell surface TCRγδ expression (right) in gut-derived γδ T cells (isolated from a donor unresponsive to BTNL3+8) after co-culture with EV versus L3+8-transduced HEK293 cells.

Comment in

References

    1. Abeler-Dörner L., Swamy M., Williams G., Hayday A.C., Bas A. Butyrophilins: an emerging family of immune regulators. Trends Immunol. 2012;33:34–41. - PubMed
    1. Adams E.J., Gu S., Luoma A.M. Human gamma delta T cells: Evolution and ligand recognition. Cell. Immunol. 2015;296:31–40. - PMC - PubMed
    1. Afrache H., Gouret P., Ainouche S., Pontarotti P., Olive D. The butyrophilin (BTN) gene family: from milk fat to the regulation of the immune response. Immunogenetics. 2012;64:781–794. - PubMed
    1. Allison J.P., Havran W.L. The immunobiology of T cells with invariant gamma delta antigen receptors. Annu. Rev. Immunol. 1991;9:679–705. - PubMed
    1. Arden B., Clark S.P., Kabelitz D., Mak T.W. Human T-cell receptor variable gene segment families. Immunogenetics. 1995;42:455–500. - PubMed