Review
. 2017 Jan 1:112:91-104.
doi: 10.1016/j.ymeth.2016.09.007. Epub 2016 Sep 15.

Imaging flow cytometry analysis of intracellular pathogens

Affiliations
Review

Imaging flow cytometry analysis of intracellular pathogens

Viraga Haridas et al. Methods. .

Abstract

Imaging flow cytometry has been applied to address questions in infection biology, in particular, infections induced by intracellular pathogens. This methodology, which utilizes specialized analytic software makes it possible to analyze hundreds of quantified features for hundreds of thousands of individual cellular or subcellular events in a single experiment. Imaging flow cytometry analysis of host cell-pathogen interaction can thus quantitatively addresses a variety of biological questions related to intracellular infection, including cell counting, internalization score, and subcellular patterns of co-localization. Here, we provide an overview of recent achievements in the use of fluorescently labeled prokaryotic or eukaryotic pathogens in human cellular infections in analysis of host-pathogen interactions. Specifically, we give examples of Imagestream-based analysis of cell lines infected with Toxoplasma gondii or Mycobacterium tuberculosis. Furthermore, we illustrate the capabilities of imaging flow cytometry using a combination of standard IDEAS™ software and the more recently developed Feature Finder algorithm, which is capable of identifying statistically significant differences between researcher-defined image galleries. We argue that the combination of imaging flow cytometry with these software platforms provides a powerful new approach to understanding host control of intracellular pathogens.

Keywords: Cellular heterogeneity; Colocalization; Feature Finder; Fluorescent protein; Imaging flow cytometry; Intracellular pathogen; Mycobacteria tuberculosis; Phagosome maturation; Rab5; Rab7; Toxoplasma gondii.


Figures

Figure 1
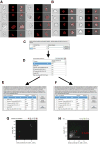
Figure 1. Feature Finder algorithm implementation for T.gondii-infected THP-1 cells (defining of statistically significant feature for identification of cellular “bubbles”, containing mCherry-labeled Toxoplasma)
1A, B: Two image panels from experiment with T.gondii-infected THP-1 cells (hand-picked by investigator). Ch1 – bright field; Ch4 – mCherry fluorescence (mCherry-labeled T.gondii); Ch1/Ch4 –merged cellular and T.gondii images. Right – images show the intracellular T.gondii clustered in vacuoles inside the normal size cells. Left – images show the intracellular T.gondii in vacuoles inside swelling cells (cellular “bubbles”). 1C: Major step in Feature Finder algorithm – to define Ch1 (brightfield) and Ch4 (mCherry fluorescence) as channels of interest, and ALL software features as categories of interest. Alternatively, categories of interest can be narrowed to “Fluorescent Intensity”category etc. 1D: Feature Finder wizard results – “Delta Centroid XY” feature provides the best statistical significance for two analyzed galleries of images chosen to represent T.gondii inside “bubble-cells” and in appearing morphologically “normal” cells. 1E, G: “Delta Centroid XY” feature applied to two initially hand-picked galleries of images. Dotblot axises: height of image vs Delta Centroid XY. 1F, H: “Delta Centroid XY” feature applied to single, focused cellular population of acquired file. The populations corresponding to initial hand-picked galleries of images are automatically gated on dotplot.
Figure 2
Figure 2. Quantification of internalized GFP-labeled T.gondii using Spot feature of Imagestream (reprinted from [2] with permission from Bentham Science Publishers)
2A: Single-cell population defined by Area/Aspect ratio dotplot; 2B: Histogram of fluorescent intensity (GFP), gated on GFP+ cells; 2C: Histogram of Spot feature (IDEAS™, Amnis-Merck, USA) applied to GFP+, single, focused cells. Represents a quantitative distribution of cells with T.gondii-inclusions (distribution of GFP+-spots inside T.gondii-infected cells). 2D: Representative image galleries of cells, infected with T.gondii (cells with only one, two and three or more inclusions (spots)). 2E: Histogram of Spot Feature distribution (IDEAS™, Amnis-Merck, USA) representing GFP+ T.gondii inclusions in the infected cells after different multiplicity of infection (MOI).
Figure 3
Figure 3. Quantification of internalized T.gondii
3A, B: Representative image galleries of cells, which did not internalized T.gondii (mCherry-labeled T.gondii attached or not attached, but located close to cells). 3C, D: Representative image galleries of cells with multiple (C) or single (D) T.gondii inclusions. 3E: Bar graph showing % of THP-1 cells infected with mCherry+ T.gondii cells (defined with a help of Eroded (3 pixel) mask). Blue: % of T.gondii-positive cells without treatment with inhibitor; Red: % of T.gondii-positive cells 24 hours after treatment with CytB (10 µM).
Figure 4
Figure 4. Quantification of internalized mCherry labeled MTb bacteria
4A: Left panel - Representative images of internalized MTb-mCherry acquired on IS-X Mark II. 4A: Right panel - external bacteria. Images shown from left to right : BF with erode mask (4 pixels), BF indicating cellular outline, H37Rv-mCherry+-MTb bacilli (Red), merged image of MTb-mCherry fluorescence and BF showing intracellular or external localisation of MTb-mCherry. 4B: Left - Chart showing wild type THP-1 cells, control shRNA cells, and IFITM shRNA cells lines number of cells being infected with mCherry-MTb, cells, internalized and external bacteria. 4B: Right -Bar graphs show the number of infected cells in all three cell lines, IFITM shRNA cells had significantly higher number of infected cells compared to control shRNA (p=0.0001) and wild type THP-1 (p=0.002). Histograms show the results of three separate experiments.
Figure 5
Figure 5. Detection of H37Rv-mCherry MTb in early and/or late phagosomal compartments of infected human THP-1 cells
Wild type THP-1 cell were infected with H37Rv-mCherry MTb for 24 hours, fixed in 4% PFA, and stained with AB to Rab5 or Rab7 or Rab5 and CD107a and acquired on IS-X Mark II, as described in Ranjbar et al [90]. 5A: Representative images of internalized MTb-mCherry in wild type THP-1 cells 24 hr after infection. Cells were labeled with Rab5 antibody and stained with DAPI as above. Images shown from left to right: BF image (Grey), DAPI (Purple), MTb-mCherry fluorescence (Red), Rab5 (Green), and a merged image showing colocalisation of MTb-mCherry fluorescence and Rab5. BF similarity coefficient values are shown in yellow font. 5B: Representative images of internalized MTb-mChery in wild type THP-1 cells that were labeled with Rab7 and stained with DAPI as above. From left to right: BF image (Grey), DAPI (Purple), MTb-mCherry fluorescence (Red), Rab 7 (Blue), and a merged image of MTb-mCherry fluorescence and Rab7 with BF similarity coefficient shown in yellow font. 5C: Representative images of internalized MTb-mCherry in wild type THP-1 cells infected with MTb-mCherry and labeled with Rab5 and CD107a (LAMP1) as above. From left to right: BF image (Grey), MTb-mCherry fluorescence (Red), CD107a (Dark blue), Rab5 (Green), and a merged image of MTb-mCherry fluorescence and CD107a with BF similarity coefficient in yellow font, a merged image of MTb-mCherry fluorescence and Rab5, and a merged image of MTb-mCherry fluorescence, CD107a and Rab5.
Figure 6
Figure 6. IFC in intracellular pathogen studies
IFC allows to quantitate morphology and fluorescence, provides robust statistics, colocalization quantitation and Feature Finder capabilities.

Similar articles

Cited by

References

    1. Fuchs TM, Eisenreich W, Heesemann J, Goebel W. Metabolic adaptation of human pathogenic and related nonpathogenic bacteria to extra- and intracellular habitats. FEMS Microbiol. Rev. 2012;36:435–462. - PubMed
    1. Muskavitch MA, Barteneva N, Gubbels MJ. Chemogenomics and parasitology: small molecules and cell-based assays to study infectious processes. Comb. Chem. High Throughput Screen. 2008;11:624–646. - PubMed
    1. Helaine S, Thompson JA, Watson KG, Liu M, Boyle C, Holden DW. Dynamics of intracellular bacterial replication at the single cell level. Proc. Natl. Acad. Sci. USA. 2010;107:3746–3751. - PMC - PubMed
    1. Toma C, Okura N, Takayama C, Suzuki T. Characteristic features of intracellular pathogenic Leptospira in infected murine macrophages. Cell. Microbiol. 2011;13:1783–1792. - PubMed
    1. Bailo N, Cosson P, Charette SJ, Paquet VE, Doublet P, Letourneur F. Defective lysosome maturation and Legionella pneumophila replication in Dictostelium cells mutant for the Arf GAP ACAP-A. J. Cell Sci. 2014;127:4702–4713. - PubMed

Publication types

MeSH terms