. 2016 Oct 6;64(1):65-78.
doi: 10.1016/j.molcel.2016.08.019. Epub 2016 Sep 15.

Real-Time Tracking of Parental Histones Reveals Their Contribution to Chromatin Integrity Following DNA Damage

Affiliations

Real-Time Tracking of Parental Histones Reveals Their Contribution to Chromatin Integrity Following DNA Damage

Salomé Adam et al. Mol Cell. .

Abstract

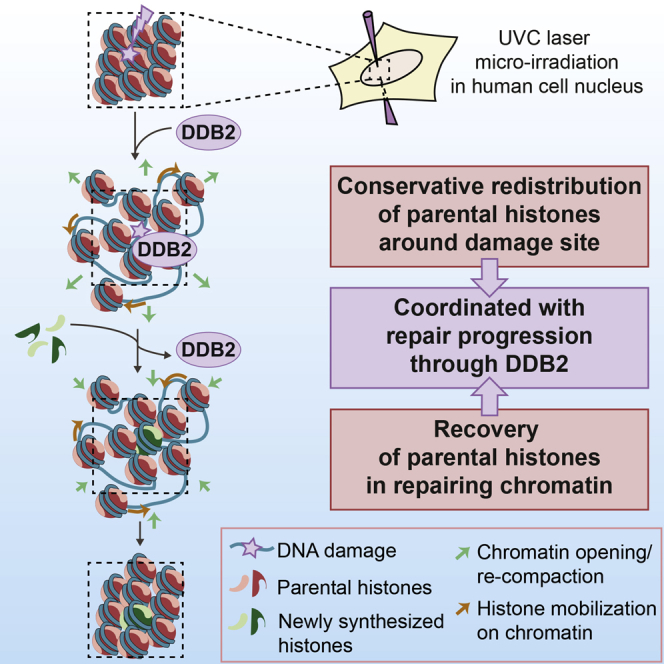
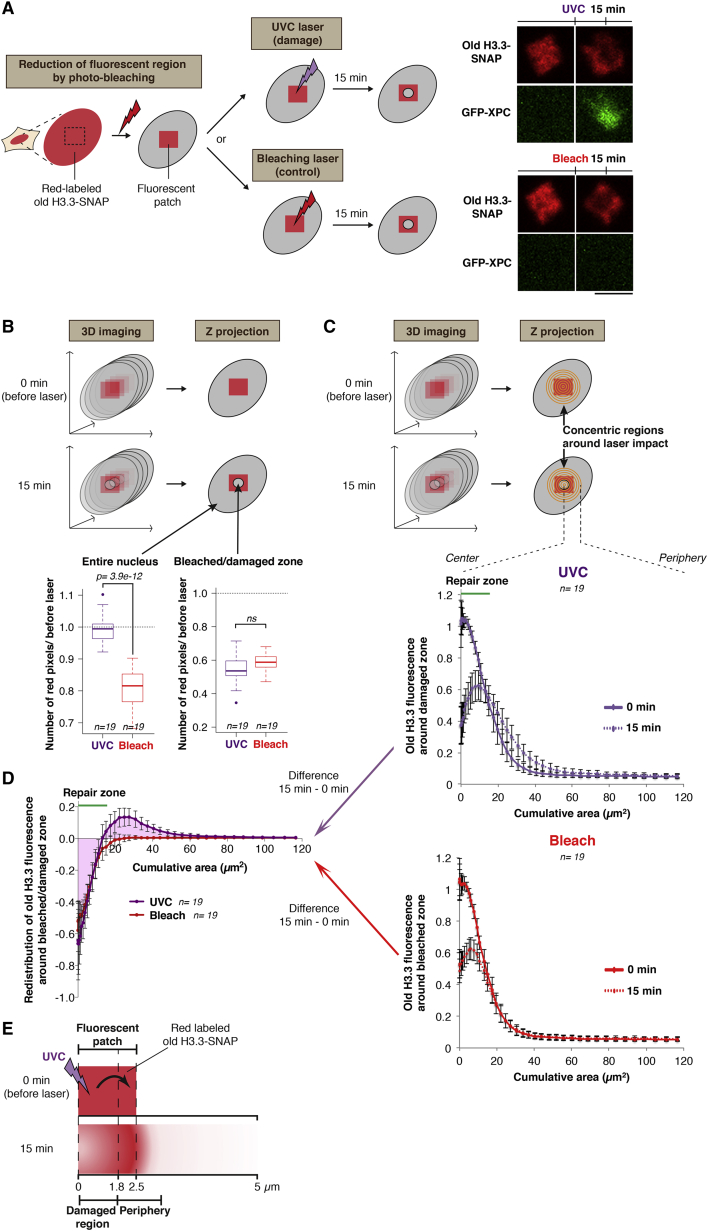
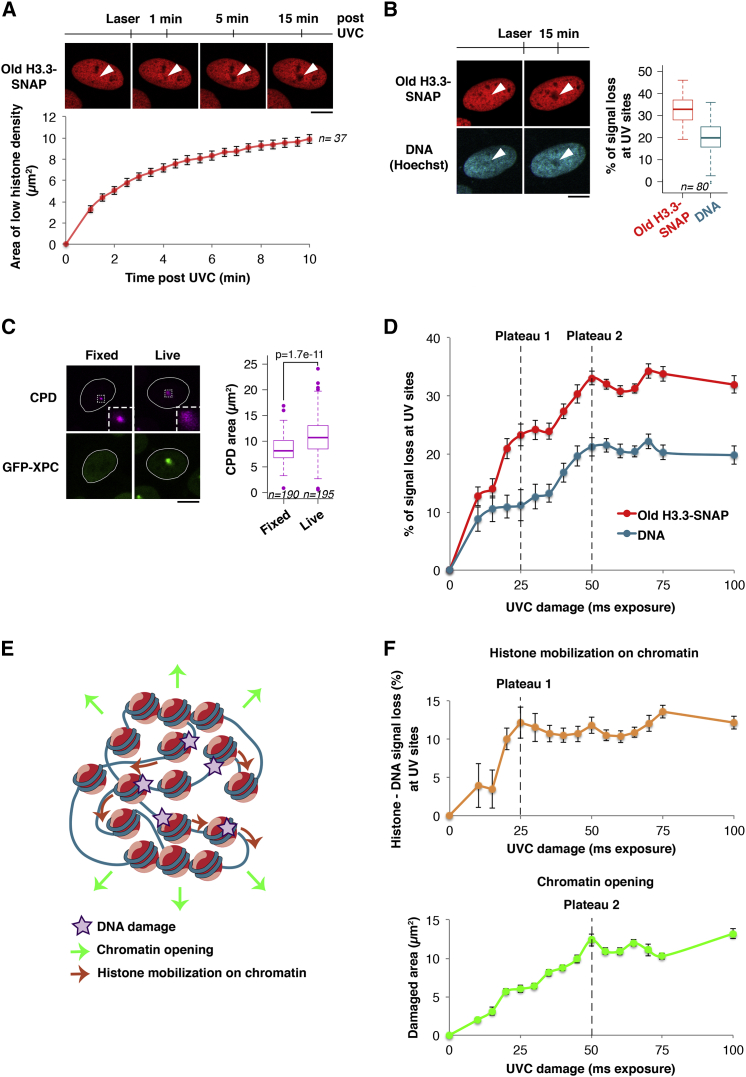
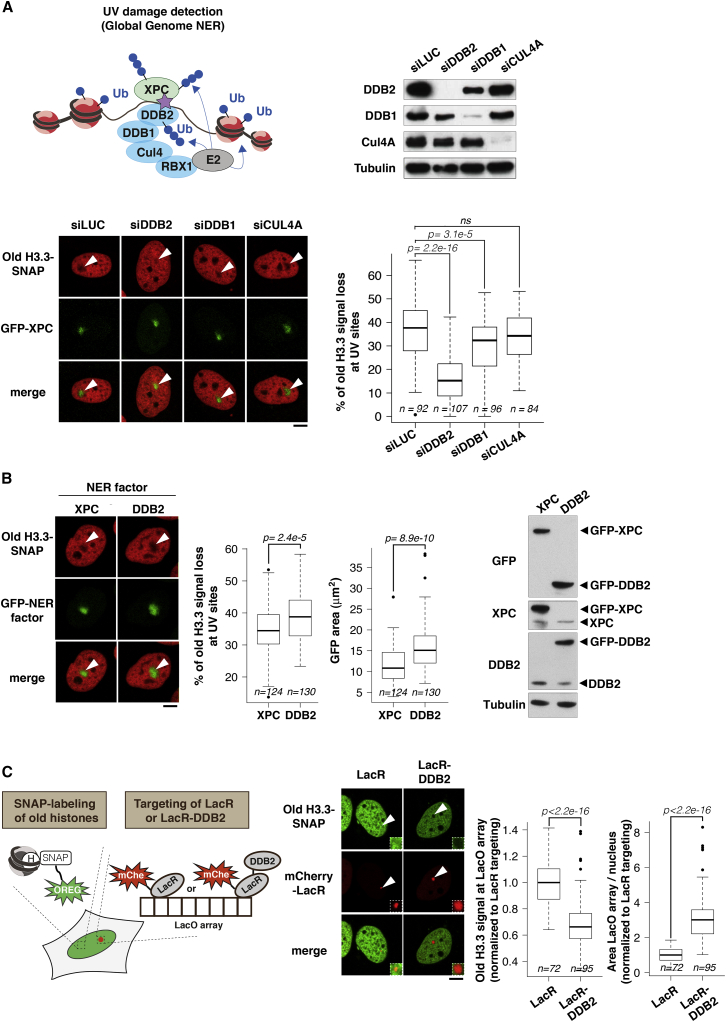
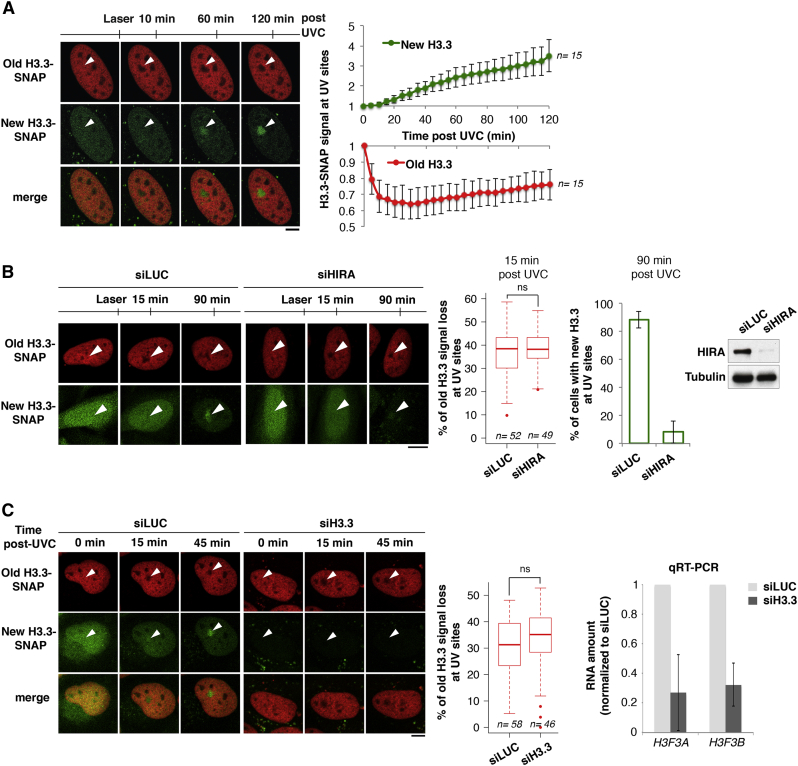
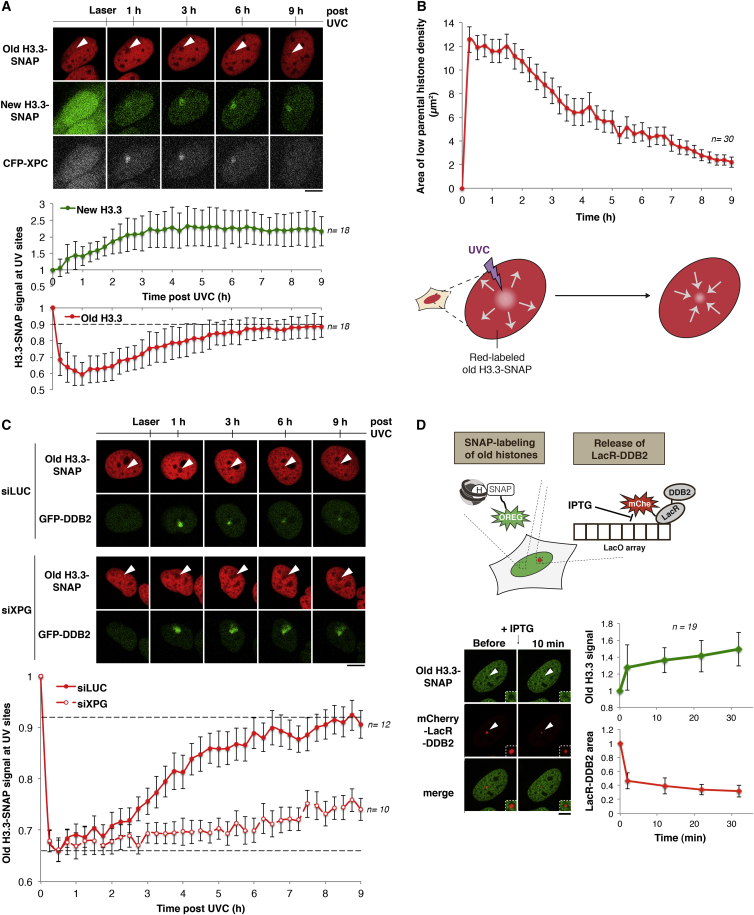
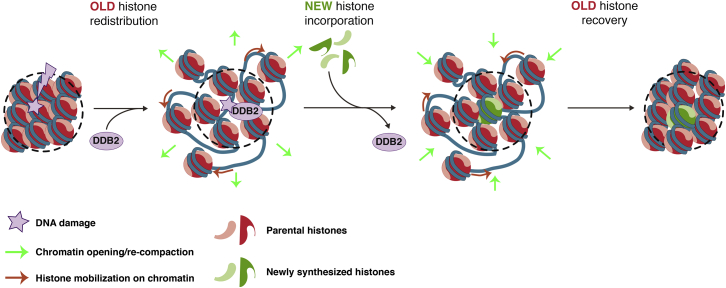
Chromatin integrity is critical for cell function and identity but is challenged by DNA damage. To understand how chromatin architecture and the information that it conveys are preserved or altered following genotoxic stress, we established a system for real-time tracking of parental histones, which characterize the pre-damage chromatin state. Focusing on histone H3 dynamics after local UVC irradiation in human cells, we demonstrate that parental histones rapidly redistribute around damaged regions by a dual mechanism combining chromatin opening and histone mobilization on chromatin. Importantly, parental histones almost entirely recover and mix with new histones in repairing chromatin. Our data further define a close coordination of parental histone dynamics with DNA repair progression through the damage sensor DDB2 (DNA damage-binding protein 2). We speculate that this mechanism may contribute to maintaining a memory of the original chromatin landscape and may help preserve epigenome stability in response to DNA damage.


Figures

Image 1
Graphical abstract
Figure 1
Figure 1
Rapid Decrease in Parental H3 Histone Density in UVC-Damaged Chromatin Regions (A) Left: current model for histone dynamics in UVC-damaged chromatin (adapted from Adam et al., 2015). The incorporation of new histones (green) raises questions about the fate of parental histones (red). Right: experimental strategy for tracking parental histone dynamics at DNA damage sites. (B) Distribution of parental histones H3.3 (red) at the indicated time points after UVC laser damage in U2OS cells stably expressing H3.3-SNAP and GFP-XPC. (C) Dynamics of parental H3.3 (red) at early time points after local UVC damage in U2OS H3.3-SNAP cells. White arrowheads, illuminated areas. Scale bars, 10 μm. Red fluorescence measured in irradiated areas is normalized to before laser. Error bars, SD from n cells scored in two independent experiments. Labeling parental histones in green instead of red gave similar results (data not shown). See also Figures S1 and S2 and Movie S1.
Figure 2
Figure 2
Conservative Redistribution of Parental Histones to the Periphery of UVC-Damaged Regions (A) Experimental procedure for measuring parental histone loss and redistribution around the UVC-damaged zone. Microscopy images show fluorescent patches of parental H3.3 (red) before and 15 min after local UVC damage (top) or photo-bleaching (bottom) in U2OS cells stably expressing H3.3-SNAP and GFP-XPC. Scale bar, 5 μm. (B) Parental H3.3 fluorescence measured in the entire nucleus and in the bleached (red) or damaged zone (purple) 15 min post-laser micro-irradiation is normalized to before laser (dotted line). n, number of cells. (C) Parental H3.3 fluorescence measured in concentric regions around the UVC (top graph) or bleaching laser impact (bottom graph) at the indicated time points is normalized to the fluorescence in the patch before laser. (D) Difference in red fluorescence distribution obtained by subtracting 0 min from 15 min values quantified in (C). The positive and negative areas under the UVC curve (purple) are equivalent. The position of the repair zone is based on GFP-XPC accumulation at 15 min. Error bars, SD from n cells scored in two independent experiments. (E) Interpretation of the results shown in (D): redistribution of old H3.3 histones to the periphery of UVC-damaged regions. Areas were converted to distances. See also Figures S2 and S3.
Figure 3
Figure 3
Chromatin Expansion and Histone Mobilization on Chromatin Contribute to Parental H3.3 Redistribution after UVC Damage (A) Distribution of parental H3.3 (red) at the indicated time points after UVC laser damage in U2OS H3.3-SNAP cells. The area of parental histone loss is measured as a function of time post-UVC. Error bars, SEM from n cells scored in two independent experiments. (B) Distribution of parental H3.3 (red) and DNA (blue, stained with Hoechst) before and 15 min after local UVC damage in U2OS H3.3-SNAP cells. The reduced Hoechst staining observed at damage sites is not due to photo-bleaching by the UVC laser (data not shown) or to DNA denaturation during UVC damage repair (Figure S3F). White arrowheads, irradiated areas. The boxplot shows quantifications of histone (red) and DNA (blue) fluorescence loss in irradiated areas (n cells scored in two independent experiments). Staining parental H3.3 in green and DNA in red with NUCLEAR-ID Red DNA stain gave similar results (data not shown). (C) UVC-damaged chromatin areas visualized by staining for cyclobutane pyrimidine dimers (CPD, purple) after UVC laser damage in U2OS cells stably expressing H3.3-SNAP and GFP-XPC. The initial damaged chromatin area was measured in paraformaldehyde-fixed cells (no expansion, no GFP-XPC recruitment) and compared to 15 min after irradiation in live cells (n cells scored in two independent experiments). Insets: zoomed-in views (×3) of dashed line boxes. Scale bars, 10 μm. (D) Quantification of parental H3.3 (red) and DNA (blue) fluorescence loss in irradiated areas as a function of UVC damage. The saturations of the two mechanisms contributing to parental histone loss (dotted lines) are obtained from the graphs in (F). (E) Working model for parental H3.3 redistribution around UVC damage sites. (F) Top: difference between parental H3.3 and DNA signal loss in irradiated areas as a function of UVC damage, which reflects histone mobilization on chromatin. Bottom: expansion of the damaged area marked by GFP-XPC as a function of UVC damage, indicative of chromatin opening. Dotted lines indicate the saturation of each mechanism. Error bars, SEM from at least 35 cells scored in three independent experiments. See also Figures S3 and S5.
Figure 4
Figure 4
Parental Histone Redistribution Is Controlled by the Repair Factor DDB2 (A) Scheme representing the main repair factors involved in UVC damage detection in the global genome NER pathway. Microscopy images show the distribution of parental H3.3 (red) 15 min after UVC laser damage in U2OS cells stably expressing H3.3-SNAP and GFP-XPC treated with the indicated siRNAs (siLUC: control). siRNA efficiencies were verified by western blot. The red fluorescence loss measured in damaged areas is normalized to before laser (n cells scored in two independent experiments). (B) Distribution of parental H3.3 (red) 15 min after UVC laser damage in U2OS cells stably expressing H3.3-SNAP and GFP-XPC or GFP-DDB2. Expression levels of exogenous XPC and DDB2 relative to the endogenous proteins are shown on the western blot. Red fluorescence loss is measured in irradiated areas relative to before laser and the area of fluorescence loss is marked by GFP-tagged NER factors. (C) Distribution of parental H3.3 (green) upon tethering of mCherry-LacR (LacR) or mCherry-LacR-DDB2 (LacR-DDB2) to the LacO array in U2OS LacO cells stably expressing H3.3-SNAP. The area of the LacO array and green fluorescence at the LacO array are displayed on the boxplots (n cells scored in two independent experiments). White arrowheads, irradiated areas or LacO array. Scale bars, 10 μm. See also Figures S4 and S5.
Figure 5
Figure 5
Parental H3.3 Redistribution Is Independent of New H3.3 Deposition (A) Dynamics of parental (red) and new H3.3 (green) at the indicated time points after UVC laser damage in U2OS H3.3-SNAP cells. Red and green signals measured in damaged areas are normalized to before laser. Error bars, SD from n cells scored in two independent experiments. (B) Distribution of parental and new H3.3 as in (A) in cells treated with the indicated siRNAs (siLUC: control). HIRA knockdown is verified by western blot and by the inhibition of new H3.3 deposition at damage sites. (C) Distribution of parental and new H3.3 as in (B). siRNA efficiency was verified by qRT-PCR. Error bars, SD from two independent experiments. Red fluorescence loss is measured in damaged areas at 15 min compared to before laser (n cells scored in two independent experiments). White arrowheads, irradiated areas. Scale bars, 10 μm. See also Movies S2 and S3.
Figure 6
Figure 6
Recovery of Parental Histones Coupled to Repair Progression (A) Dynamics of parental (red) and new H3.3 (green) at the indicated time points after UVC laser damage in U2OS cells stably expressing H3.3-SNAP and CFP-XPC. Green and red signals are quantified in irradiated areas relative to before laser. Cells that did not repair efficiently (based on CFP-XPC retention) were excluded from the analysis. Error bars, SD from n cells scored in two independent experiments. Staining parental histones in green and new histones in red gave similar results (not shown). (B) Area of parental H3.3 histone loss as a function of time post-UVC irradiation, reflecting opening and closure of the damaged zone. Error bars, SEM from n cells scored in two independent experiments. (C) Dynamics of parental H3.3 (red) at the indicated time points after UVC laser damage in U2OS cells stably expressing H3.3-SNAP and GFP-DDB2 treated with the indicated siRNAs (siLUC: control). The efficiency of XPG depletion is indicated by sustained retention of GFP-DDB2 at UV sites. Red fluorescence measured in damaged areas is normalized to before laser. Error bars, SEM from n cells scored in two independent experiments. (D) Distribution of parental H3.3 (green) upon IPTG-mediated release of mCherry-LacR-DDB2 from the LacO array in U2OS LacO cells stably expressing H3.3-SNAP. The green fluorescence at the LacO array and LacR-DDB2 area (red) measured after IPTG addition are normalized to before IPTG. Error bars, SD from n cells scored in two independent experiments. White arrowheads, irradiated areas or LacO array. Scale bars, 10 μm. See also Figure S6 and Movies S4 and S5.
Figure 7
Figure 7
Model for Parental Histone Dynamics Coupled to Repair in UVC-Damaged Chromatin UVC damage leads to the redistribution of parental histones to the periphery of damaged chromatin regions. This occurs via a decompaction of damaged chromatin, which pushes away the surrounding undamaged chromatin fibers, along with a mobilization of parental histones on chromatin away from damage sites, making room for new histone incorporation. Restoration of the overall chromatin organization proceeds by chromatin re-compaction and sliding back the nucleosomes bearing parental histones. The whole process is tightly coordinated with DNA repair progression through binding and release of the damage sensor DDB2.

References

    1. Adam S., Polo S.E., Almouzni G. Transcription recovery after DNA damage requires chromatin priming by the H3.3 histone chaperone HIRA. Cell. 2013;155:94–106. - PubMed
    1. Adam S., Dabin J., Polo S.E. Chromatin plasticity in response to DNA damage: the shape of things to come. DNA Repair (Amst.) 2015;32:120–126. - PMC - PubMed
    1. Alabert C., Groth A. Chromatin replication and epigenome maintenance. Nat. Rev. Mol. Cell Biol. 2012;13:153–167. - PubMed
    1. Alabert C., Barth T.K., Reverón-Gómez N., Sidoli S., Schmidt A., Jensen O.N., Imhof A., Groth A. Two distinct modes for propagation of histone PTMs across the cell cycle. Genes Dev. 2015;29:585–590. - PMC - PubMed
    1. Alekseev S., Coin F. Orchestral maneuvers at the damaged sites in nucleotide excision repair. Cell. Mol. Life Sci. 2015;72:2177–2186. - PMC - PubMed

Publication types

MeSH terms