. 2014 Sep;8(9):723-730.
doi: 10.1038/nphoton.2014.166. Epub 2014 Aug 3.

Through-skull fluorescence imaging of the brain in a new near-infrared window

Affiliations

Through-skull fluorescence imaging of the brain in a new near-infrared window

Guosong Hong et al. Nat Photonics. 2014 Sep.

Abstract

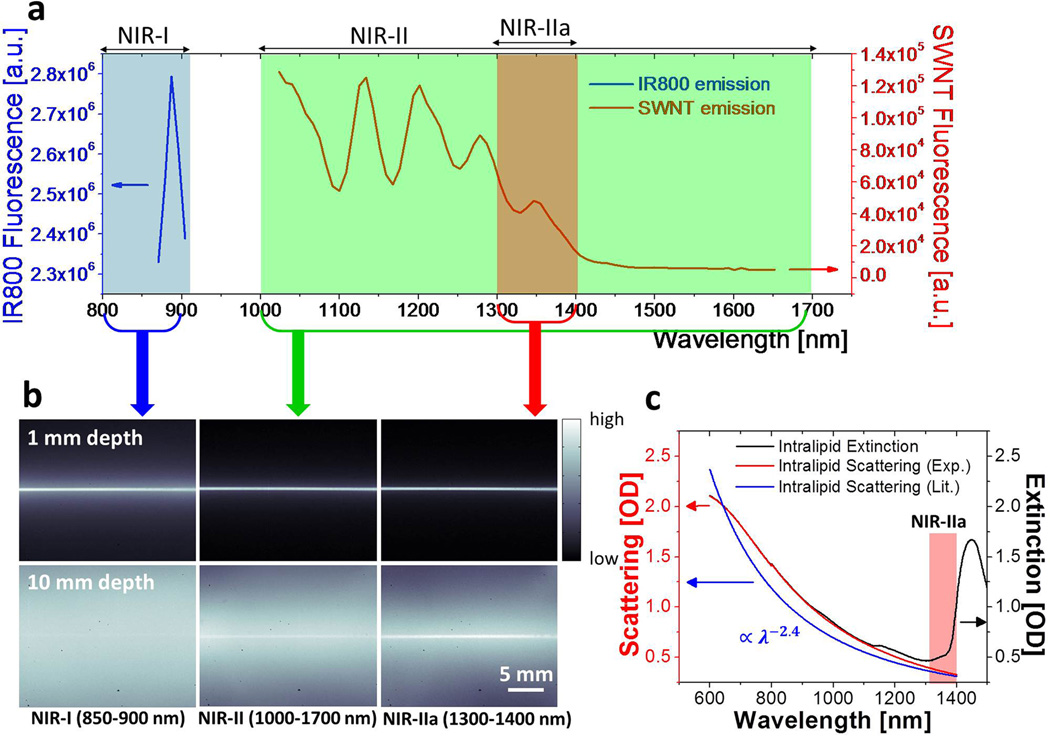
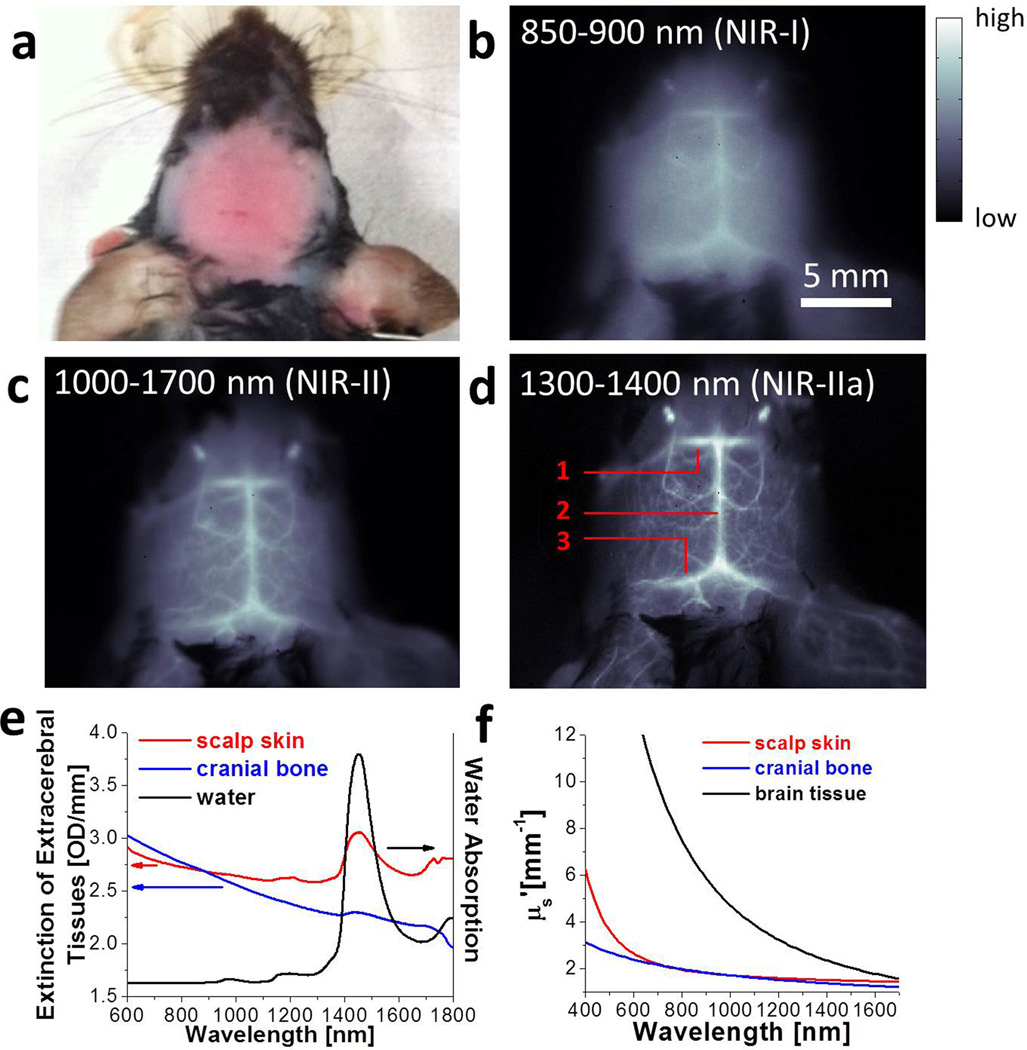
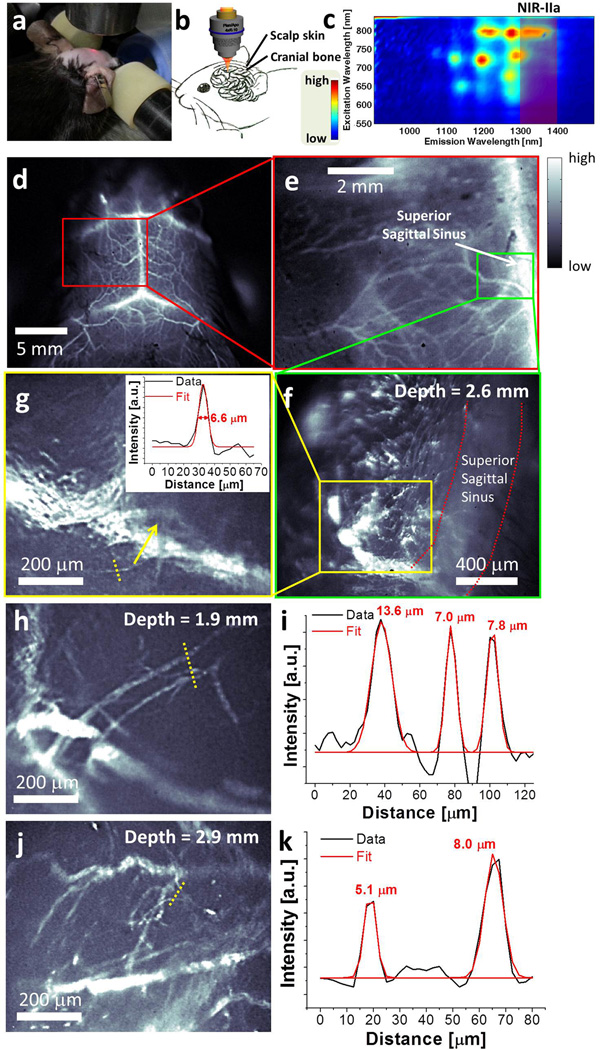
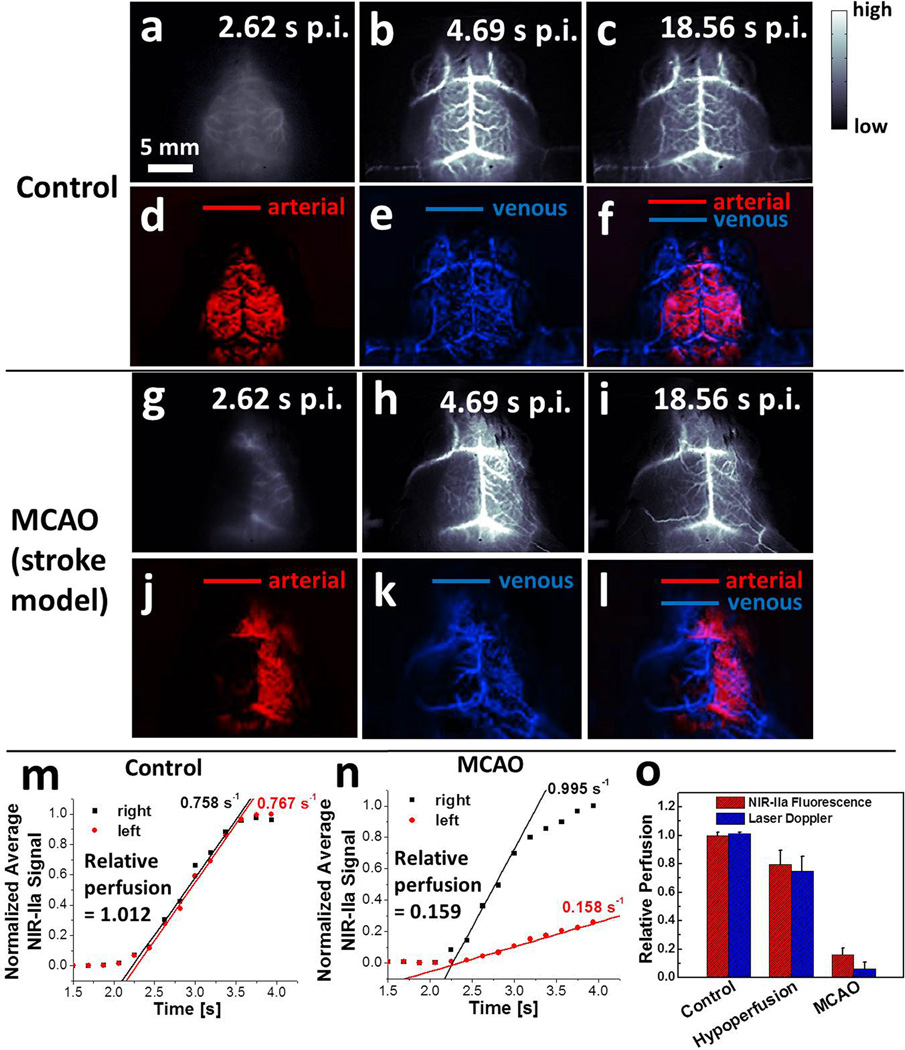
To date, brain imaging has largely relied on X-ray computed tomography and magnetic resonance angiography with limited spatial resolution and long scanning times. Fluorescence-based brain imaging in the visible and traditional near-infrared regions (400-900 nm) is an alternative but currently requires craniotomy, cranial windows and skull thinning techniques, and the penetration depth is limited to 1-2 mm due to light scattering. Here, we report through-scalp and through-skull fluorescence imaging of mouse cerebral vasculature without craniotomy utilizing the intrinsic photoluminescence of single-walled carbon nanotubes in the 1.3-1.4 micrometre near-infrared window. Reduced photon scattering in this spectral region allows fluorescence imaging reaching a depth of >2 mm in mouse brain with sub-10 micrometre resolution. An imaging rate of ~5.3 frames/s allows for dynamic recording of blood perfusion in the cerebral vessels with sufficient temporal resolution, providing real-time assessment of blood flow anomaly in a mouse middle cerebral artery occlusion stroke model.


Figures

Figure 1
Figure 1
Imaging in various NIR sub-regions. (a) A fluorescence emission spectrum of SWNT-IRDye800 conjugate in the range of 850–1650 nm under the excitation of an 808-nm laser. The emission spectra of IRDye800 and SWNT are plotted under different y axis scales to accommodate both into the same graph, due to the much higher fluorescence intensity of IRDye800 than SWNTs. (b) NIR fluorescence images of a capillary tube filled with SWNT-IRDye800 solution immersed at depths of 1 mm (top) and 10 mm (bottom) in 1% Intralipid recorded in NIR-I, NIR-II and NIR-IIa regions respectively. (c) The extinction spectrum (black curve) and scattering spectrum (red curve, measured by subtracting water and Intralipid absorptions from the extinction spectrum, see Fig. S2) of 1% Intralipid in water with path length of 1 mm measured by UV-Vis-NIR spectrometer, along with reduced scattering coefficient profile (blue) of 1% Intralipid derived from literature.
Figure 2
Figure 2
In vivo mouse brain imaging with SWNT-IRDye800 in different NIR sub-regions. (a) A C57Bl/6 mouse head with hair removed. (b-d) Fluorescence images of the same mouse head in the NIR-I, NIR-II and NIR-IIa regions. The inferior cerebral vein, the superior sagittal sinus and transverse sinus are labeled 1, 2 and 3 in d, respectively. (e) Extinction spectra of scalp (red) and skull (blue) along with the water absorption spectrum (black). (f) Reduced scattering coefficients µs' of scalp skin (red), cranial bone (blue) and brain tissue (black) plotted against wavelength, based on the previously reported scattering properties for these tissues.,,
Figure 3
Figure 3
Non-invasive, high-resolution NIR-IIa fluorescence imaging of mouse brain vasculature. (a) A photo showing the stereotactic microscopic imaging setup, where a red laser is used for alignment and shows the beam location. (b) A schematic showing the penetration of NIR-IIa fluorescence through brain tissue, skull and the scalp. (c) A photoluminescence versus excitation (PLE) spectrum of LS nanotubes in an aqueous solution. The 1.3–1.4 µm NIR-IIa region is shaded red. (d) A low-magnification cerebral vascular image taken with a field of view of 25 mm × 20 mm. (e) A cerebral vascular image of the same mouse head zoomed into the left cerebral hemisphere, with a field of view of 8 mm × 6.4 mm. (f) A cerebral vascular image of the same mouse head taken using a microscope objective, with a field of view of 1.7 mm × 1.4 mm. The depth of these in-focus vascular features was determined as 2.6 mm. (g) A zoomed-in image of a sub-region in f taken by a higher magnification objective, with a field of view of 0.80 mm × 0.64 mm. The inset shows the cross-sectional intensity profile (black) and Gaussian fit (red) along the yellow-dashed bar. (h-k) Two other high resolution cerebral vascular images with a field of view of 0.80 mm × 0.64 mm taken on another mouse (h&j), and their cross-sectional fluorescence intensity profiles (black) and Gaussian fit (red) along the yellow-dashed bars (i&k).
Figure 4
Figure 4
Dynamic NIR-IIa fluorescence imaging of mouse cerebral vasculature. (a-c) Time course NIR-IIa images of a control, healthy mouse (Mouse C1). (d-f) PCA overlaid images showing arterial (red) and venous (blue) vessels of Mouse C1. (g-i) Time course NIR-IIa images of a mouse with MCAO (Mouse M1). (j-l) PCA overlaid images showing arterial (red) and venous (blue) vessels of Mouse M1. (m-n) Normalized NIR-IIa signal in the left (red) and right (black) cerebral hemispheres of Mouse C1 (m) and M1 (n) versus time. (o) Average blood perfusion of the left cerebral hemisphere of control group (n=3), MCAO group (n=4) and cerebral hypoperfusion group (n=4), measured by NIR-II method (red) and laser Doppler blood spectroscopy (blue). Errors bars reflect the standard deviation of each group.

References

    1. Go AS, et al. Heart Disease and Stroke Statistics-2013 Update A Report From the American Heart Association. Circulation. 2013;127:E6–E245. - PMC - PubMed
    1. Schramm P, Schellinger PD, Fiebach JB, Heiland S, Jansen O, Knauth M, Hacke W, Sartor K. Comparison of CT and CT angiography source images with diffusion-weighted imaging in patients with acute stroke within 6 hours after onset. Stroke. 2002;33:2426–2432. - PubMed
    1. Wright SN, Kochunov P, Mut F, Bergamino M, Brown KM, Mazziotta JC, Toga AW, Cebral JR, Ascoli GA. Digital reconstruction and morphometric analysis of human brain arterial vasculature from magnetic resonance angiography. Neuroimage. 2013;82:170–181. - PMC - PubMed
    1. Huang CH, Chen CCV, Siow TY, Hsu SHS, Hsu YH, Jaw FS, Chang C. High-Resolution Structural and Functional Assessments of Cerebral Microvasculature Using 3D Gas Delta R-2*-mMRA. Plos One. 2013;8 - PMC - PubMed
    1. Flohr TG, et al. First performance evaluation of a dual-source CT (DSCT) system (vol 16, pg 256, 2006) Eur Radiol. 2006;16:1405–1405. - PubMed