. 2016;10(1):198-218.
doi: 10.1214/15-AOAS886. Epub 2016 Mar 25.

Persistent Homology Analysis of Brain Artery Trees

Affiliations

Persistent Homology Analysis of Brain Artery Trees

Paul Bendich et al. Ann Appl Stat. 2016.

Abstract

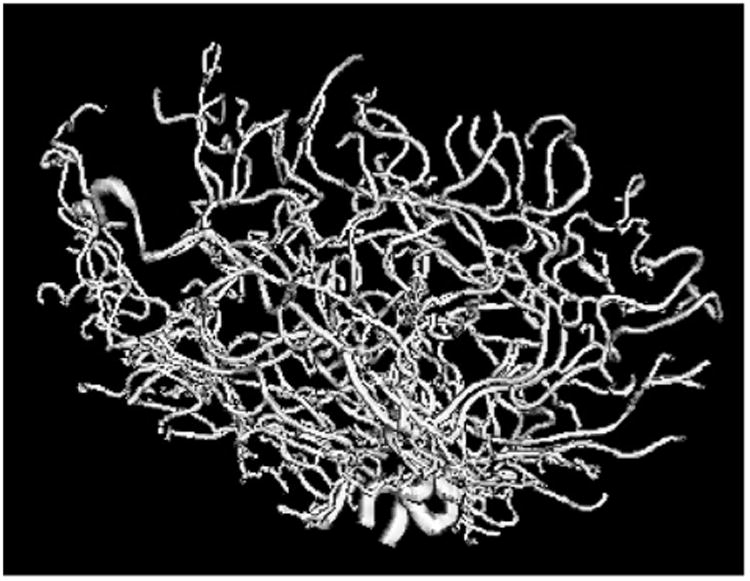
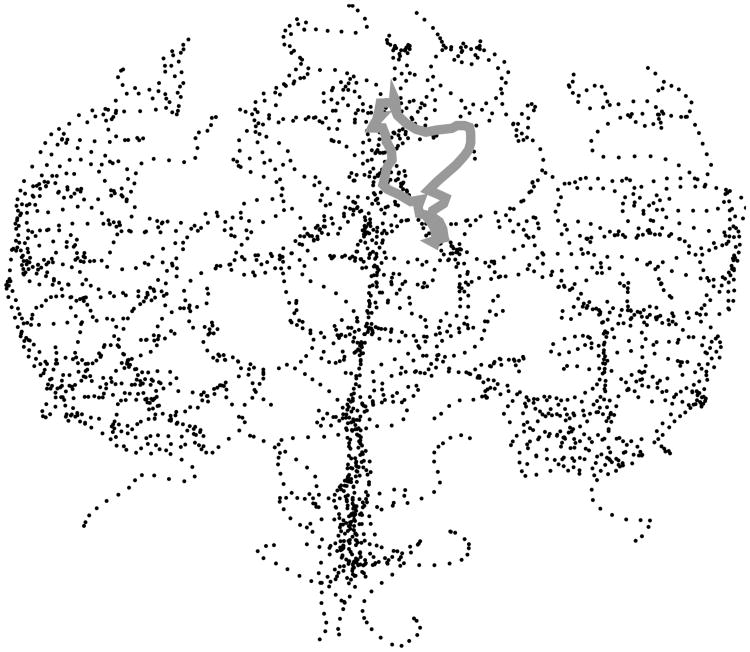
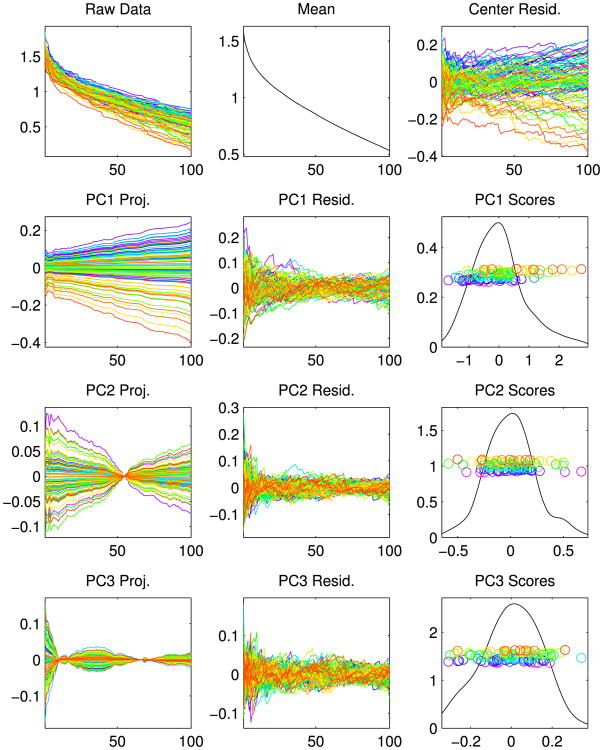
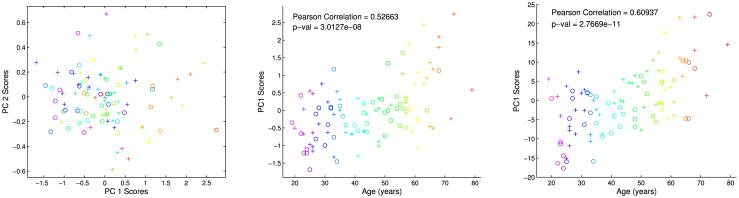
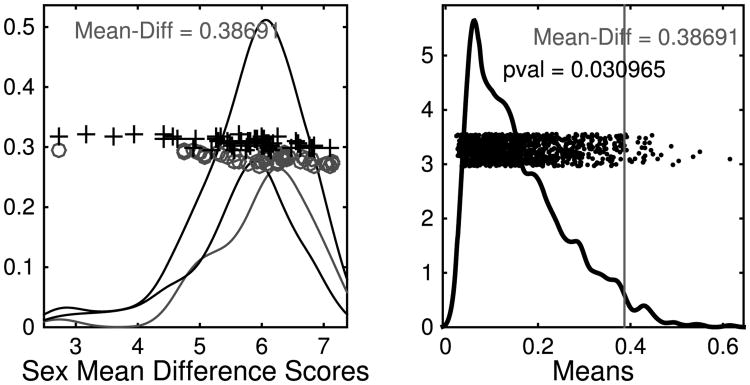
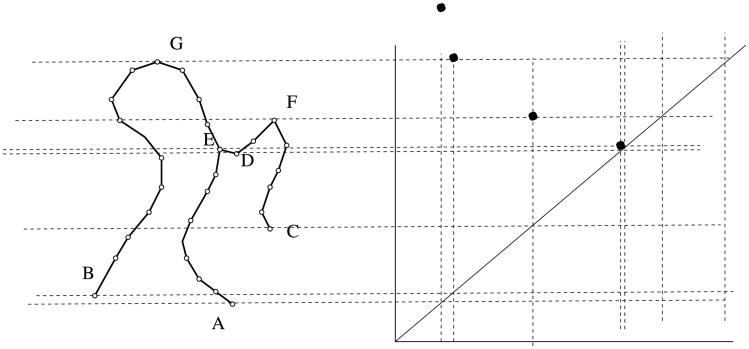
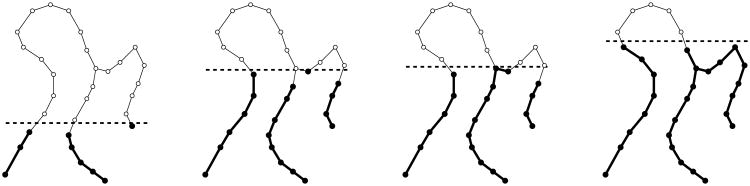
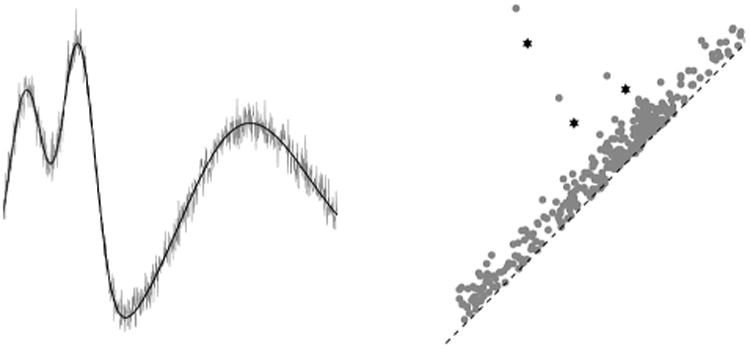
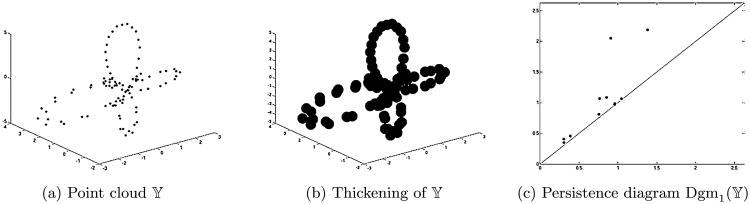
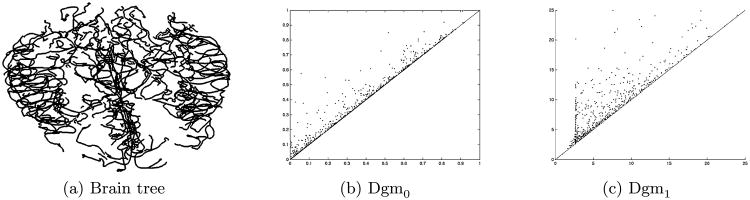
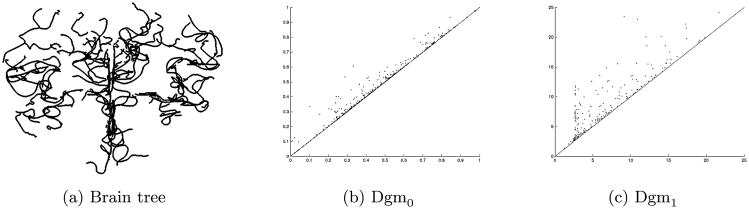
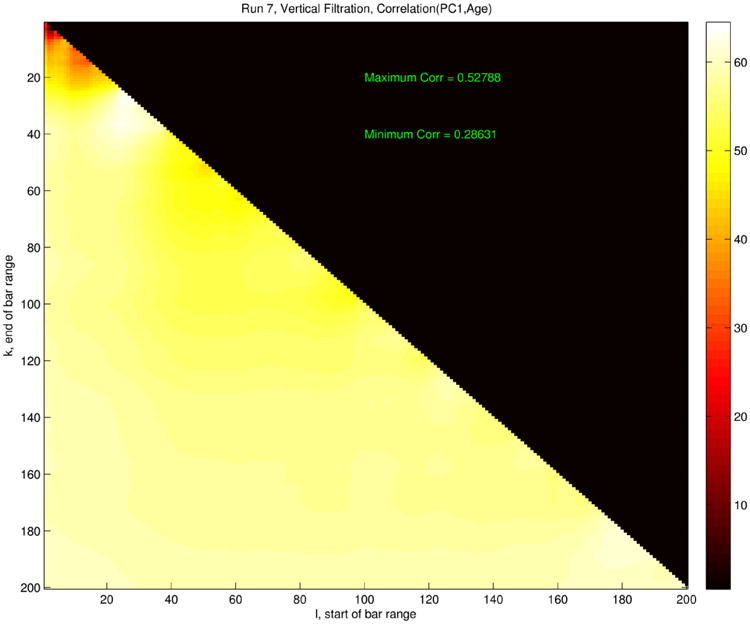
New representations of tree-structured data objects, using ideas from topological data analysis, enable improved statistical analyses of a population of brain artery trees. A number of representations of each data tree arise from persistence diagrams that quantify branching and looping of vessels at multiple scales. Novel approaches to the statistical analysis, through various summaries of the persistence diagrams, lead to heightened correlations with covariates such as age and sex, relative to earlier analyses of this data set. The correlation with age continues to be significant even after controlling for correlations from earlier significant summaries.

Keywords: Persistent homology; angiography; statistics; topological data analysis; tree-structured data.


Figures

Fig. 1
Fig. 1
Tree of arteries from the brain of one person, showing one data object. Thickest arteries appear near the bottom. Arteries bend, twist and branch through three dimensions, which results in meaningful aspects of the data being captured by persistent homology representations. The resolution is 0.5 × 0.5 × 0.8 mm3.
Fig. 2
Fig. 2
A MATLAB rendering of the brain artery tree of Patient 1. Indicated by the thick grey curve is one of the loops formed by thickening the artery tree within the brain. Also found are some of the loops and bends made by the artery tree within the 3-dimensional geometry of the brain.
Fig. 3
Fig. 3
PCA of vector representations. Raw data, mean and mean residuals are in the top row. Other rows show loadings and scores for the first 3 PCs, that is, modes of variation. Rainbow colors indicate age. Correlation of PC1 and age is apparent, with warmer colors generally at the bottom and cooler colors generally at the top.
Fig. 4
Fig. 4
Left: Scatterplot of PC1 vs. PC2. Shows joint distribution of scores. Main lesson is PC1 appears strongly correlated with age, but PC2 does not. Middle: PC1 vs. age for the zero-dimensional topological features verifies strong correlation of PC1 with age. Right: PC1 vs. age for the one-dimensional topological features exhibits even stronger correlation.
Fig. 5
Fig. 5
Illustration of DiProPerm results on the one-dimensional persistence features. The left panel shows the result of projecting the data onto the direction vector determined by the means, suggesting some difference. The results of the permutation test are shown on the right, with the proportion of simulated differences that are bigger than that observed in the original data giving an empirical p-value.
Fig. 6
Fig. 6
On the left, a graph G. The function h measures height in the vertical direction, and the persistence diagram Dgm0(h) is shown on the right. The coordinates of the dots are, reading from right to left, (h(A), ∞), (h(B), h(H)), (h(C), h(F)) and (h(D), h(E)).
Fig. 7
Fig. 7
Four threshold sets for the function shown in Figure 6, with increasing threshold value from left to right. The component born at the far left only dies as it enters the far right, while the much shorter-lived component born left of center dies entering the very next step.
Fig. 8
Fig. 8
On the left, functions f and g, shown in black and grey, respectively. On the right, their persistence diagrams: the f-diagram consists of stars and the g-diagram consists of dots. The optimal bijection between Dgm0(g) and Dgm0(f) matches the three high-persistence star-classes together, and it matches the extra low-persistence dot-classes to the black diagonal.
Fig. 9
Fig. 9
Point cloud to persistence diagram.
Fig. 10
Fig. 10
Persistent homology data objects from a 24-year-old. Left: brain tree. Middle: zero-dimensional diagram. Right: one-dimensional diagram.
Fig. 11
Fig. 11
Persistent homology data objects from a 68-year old. Left: brain tree. Middle: zero-dimensional diagram. Right: one-dimensional diagram.
Fig. 12
Fig. 12
Age correlation heat map for features extracted from zero-dimensional persistent homology analysis. Color indicates the value of the function ρ(n, N), which is the age correlation derived from the vectors pn,N, with n on the horizontal axis and N on the vertical. The upper-right black triangle is meaningless, as n > N does not lead to a vector in our scheme.
Fig. 13
Fig. 13
Sex-difference significance heat map for features extracted from one-dimensional persistent homology analysis. Color indicates the value of the function p(n, N), which is the significance, derived via permutation test, of the difference between the male and the female vectors qn,N, with n on the horizontal axis and N on the vertical. The upper-right black triangle is meaningless, as n > N does not lead to a vector in our scheme. To provide good contrast between the values, a color scheme running from 0.1 (white) to 0 (black) was chosen. A few values are actually above 0.1 and are simply shown as white in this scheme.

References

    1. Adcock A, Carlsson E, Carlsson G. The ring of algebraic functions on persistence bar codes. 2013 2013. Available at arXiv:1304.0530.
    1. Aydin B, Pataki G, Wang H, Bullitt E, Marron JS. A principal component analysis for trees. Ann Appl Stat. 2009;3:1597–1615. MR2752149.
    1. Aylward S, Bullitt E. Initialization, noise, singularities, and scale in height ridge traversal for tubular object centerline extraction. IEEE Trans Med Imag. 2002;21:61–75. - PubMed
    1. Barden D, Le H, Owen M. Central limit theorems for Fréchet means in the space of phylogenetic trees. Electron J Probab. 2013;18(25):25. MR3035753.
    1. Barden D, Le H, Owen M. Limiting behaviour of Fréchet means in the space of phylogenetic trees. 2014 Preprint. Available at arXiv:1409.7602v1.

LinkOut - more resources