. 2016 Jul;2(4):519-535.
doi: 10.1016/j.jcmgh.2016.04.002.

Necroptosis Is an Important Severity Determinant and Potential Therapeutic Target in Experimental Severe Pancreatitis

Affiliations

Necroptosis Is an Important Severity Determinant and Potential Therapeutic Target in Experimental Severe Pancreatitis

Johanna Louhimo et al. Cell Mol Gastroenterol Hepatol. 2016 Jul.

Abstract

Background and aims: Severe acute pancreatitis is characterized by acinar cell death and inflammation. Necroptosis is an aggressive and pro-inflammatory mode of cell death that can be prevented by necrostatin-1 administration or RIP3 deletion.

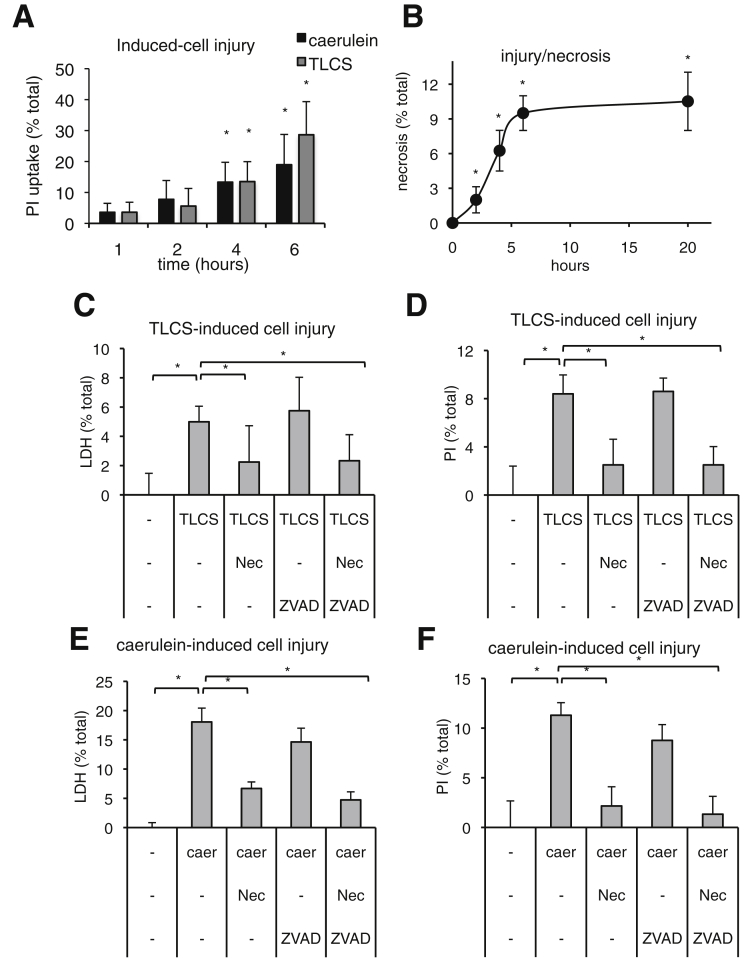
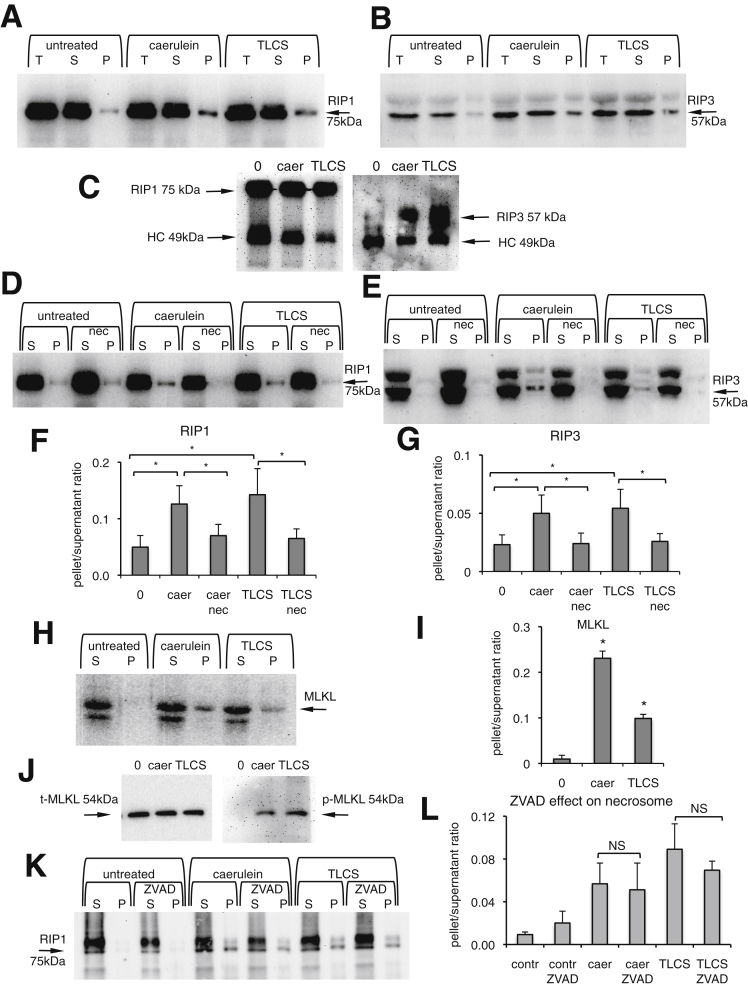
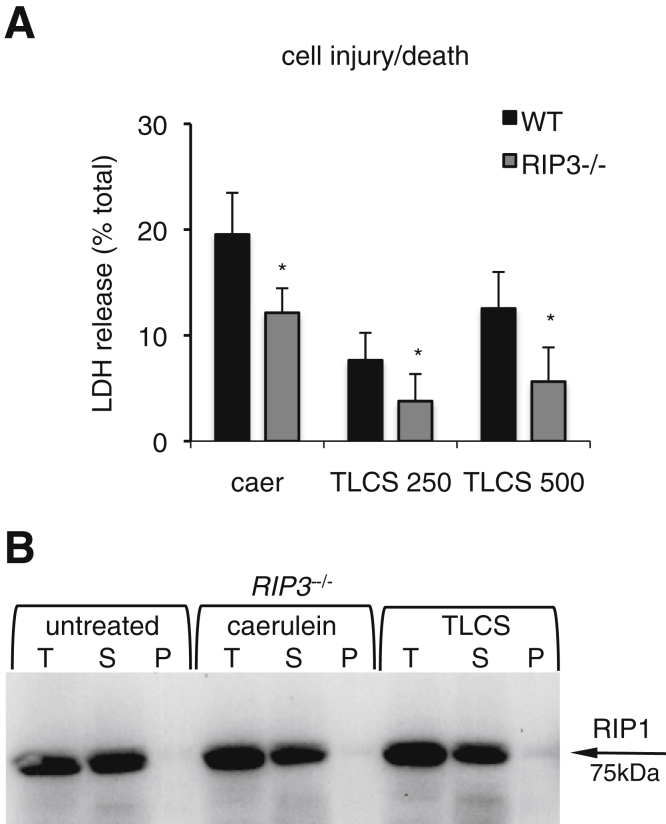
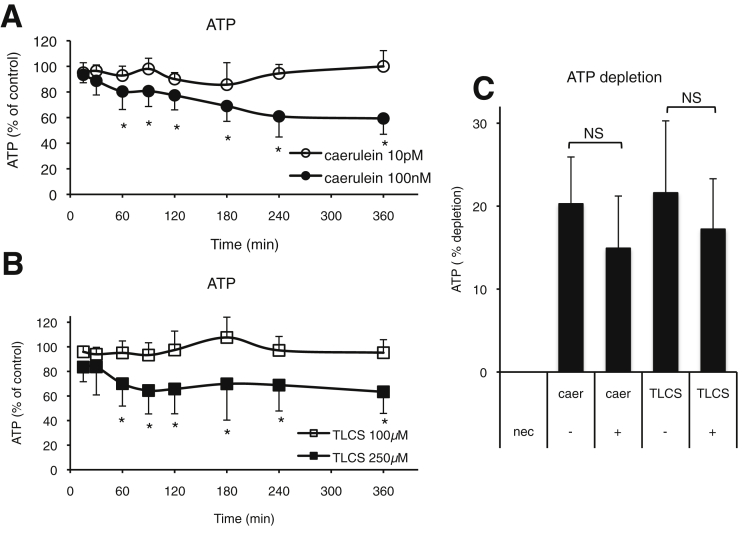
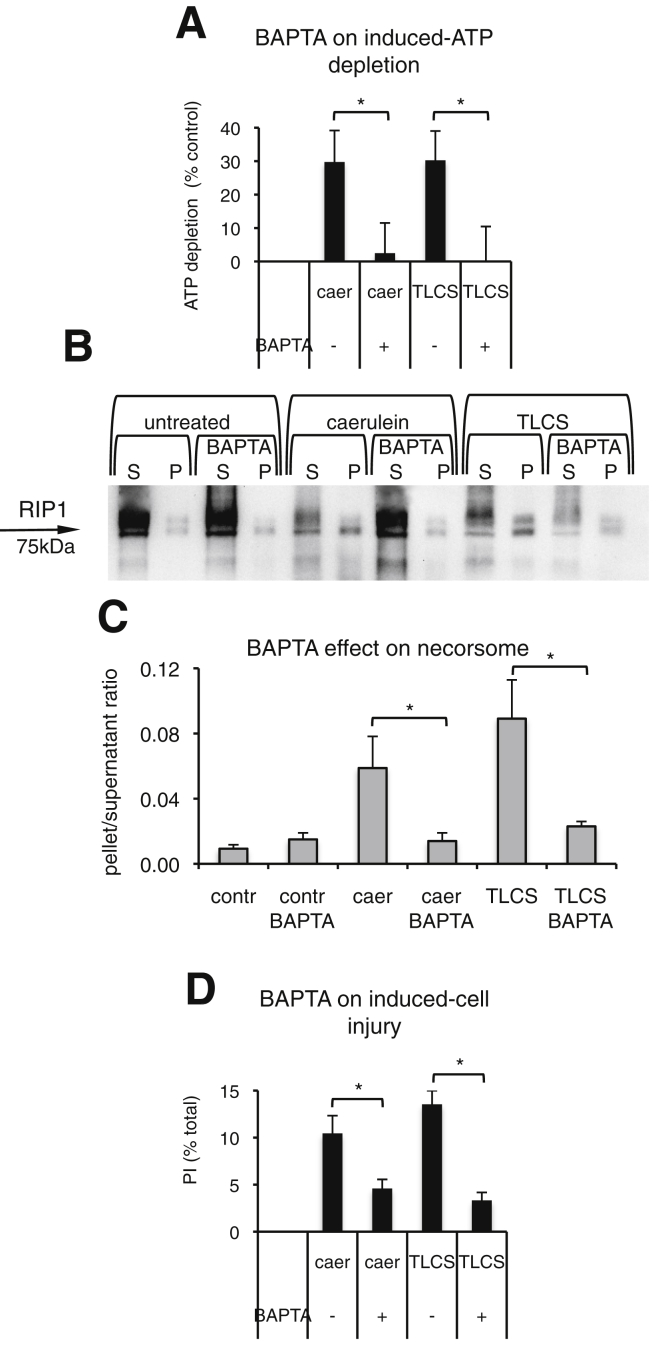
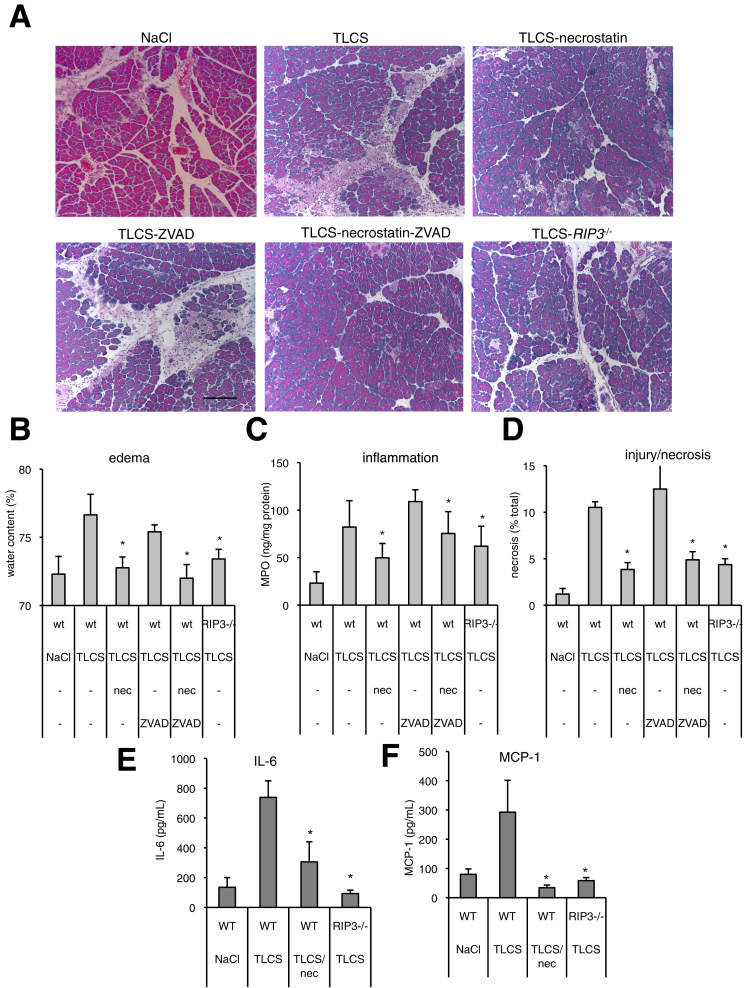
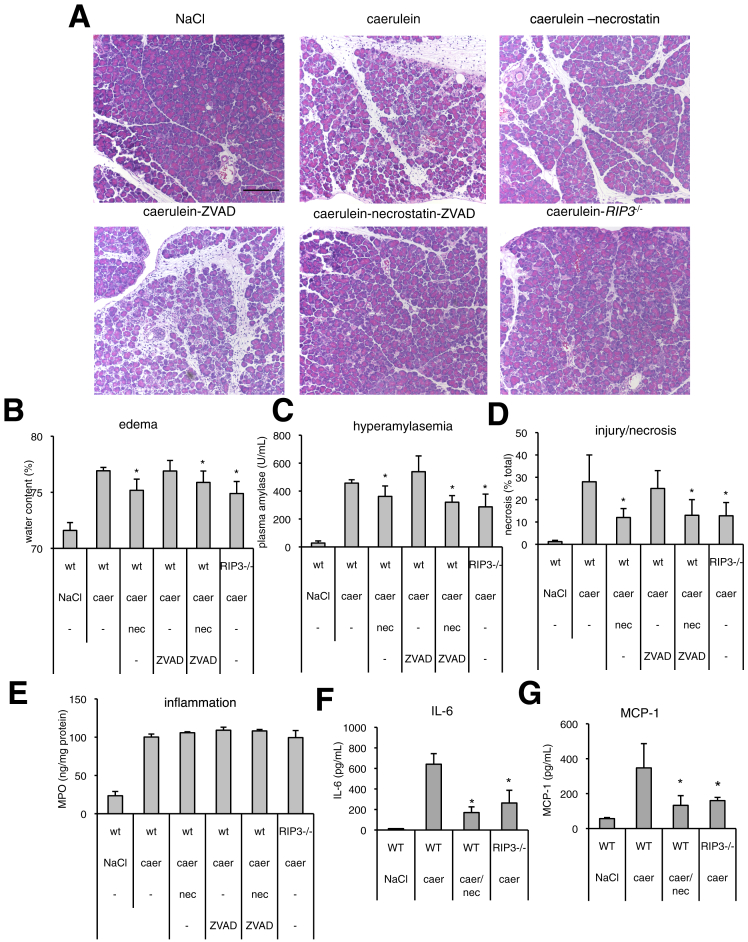
Methods: Mouse pancreatic acinar cells were incubated with supramaximally stimulating concentrations of caerulein or sub-micellar concentrations of TLCS and necroptosis was inhibited by either addition of necrostatin or by RIP3 deletion. Cell death was quantitated using either LDH leakage from acini or PI staining of nuclei. Necrosome formation was tracked and quantitated using cell fractionation or immunoprecipitation. Pancreatitis was induced in mice by retrograde intraductal infusion of TLCS or by repetitive supramaximal stimulation with caerulein.

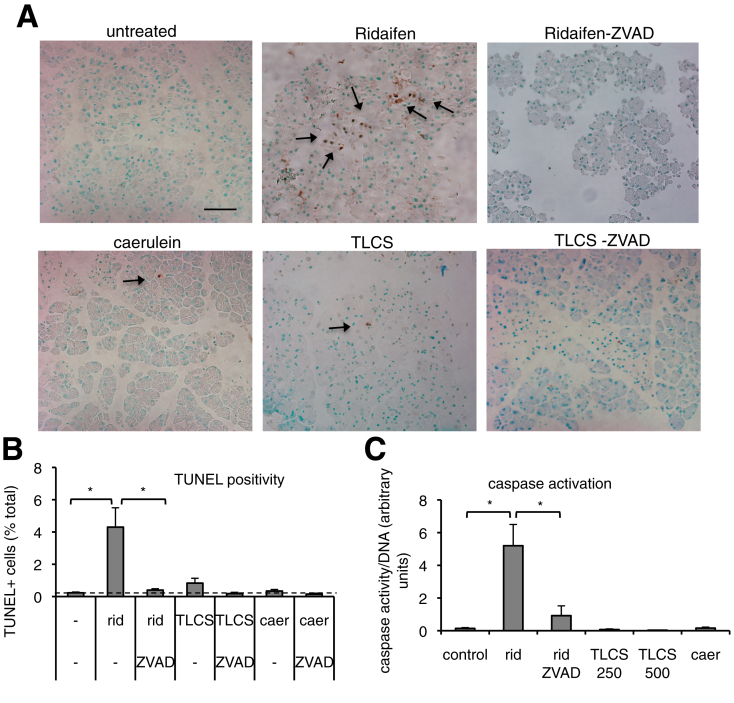
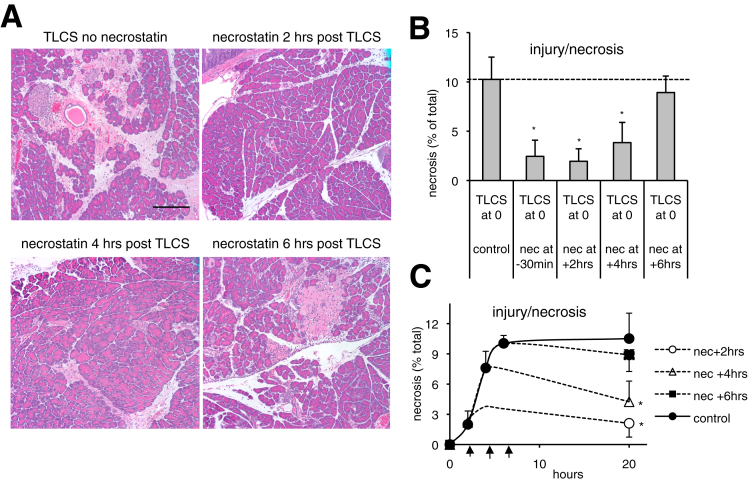
Results: Necroptosis was found to be the most prevalent mode of acinar cell in vitro death and little or no apoptosis was observed. Acinar cell death was associated with necrosome formation and prevented by either necrostatin administration or RIP3 deletion. Both of these interventions reduced the severity of TLCS- or caerulein-induced pancreatitis. Delaying necrostatin administration until after pancreatitis had already been established could still reduce the severity of TLCS-induced pancreatitis.

Conclusions: Necroptosis is the predominant mode of acinar cell death in severe experimental mouse pancreatitis. The severity of pancreatitis can be reduced by administration of necrostatin and that necrostatin can still reduce the cell injury of pancreatitis even if it is administered after the disease has already been established. Inhibition of necroptosis may be an effective strategy for the treatment of severe clinical pancreatitis.

Keywords: acute pancreatitis; apoptosis; biliary pancreatitis; necroptosis; pancreatic cell death.


Conflict of interest statement

The authors disclose no conflicts

Figures

Figure 1
Figure 1
Time dependence and mode of acinar cell injury/death after exposure to TLCS or caerulein. (A) Time dependence of in vitro acinar cell injury/death after exposure to TLCS or caerulein. Acini were incubated with 250 μmol/L TLCS or 100 nmol/L caerulein for the indicated times and PI uptake was quantitated as described in the Materials and Methods section. Asterisks indicate a P value less than .05 when compared with untreated acini. (B) Time dependence of in vivo acinar cell injury/death after retrograde ductal infusion of TLCS. Mice were infused with TLCS to induce pancreatitis as described in the Materials and Methods section, and killed at the indicated times after completion of the infusion. Acinar cell injury/death was quantitated morphometrically and expressed as the percentage of acinar tissue. Asterisks indicate a P value less than .05 when compared with zero-time value. (C–F) In vitro cell death induced by TLCS or caerulein (caer) is inhibited by necrostatin-1 (nec), but not ZVAD. Acini were incubated for 4 hours in buffer containing 250 μmol/L TLCS or 100 nmol/L caerulein along with the RIP1 inhibitor necrostatin (50 μmol/L), the pancaspase inhibitor ZVAD (25 μmol/L), or necrostatin plus ZVAD. After incubation, net TLCS- and caerulein-induced PI uptake and LDH leakage over 4 hours were quantitated as described in the Materials and Methods section and expressed as a percentage of total PI uptake or LDH leakage measured after cell lysis with Triton X-100. The PI results show the average ± SD values of 5 experiments performed in quadruplicate and the LDH results are from 3 experiments performed in duplicate. Asterisks indicate a P value less than .05 when bracketed columns were compared.
Figure 2
Figure 2
Neither TLCS nor caerulein induce apoptotic acinar cell death. (A and B) Ridaifen, but neither caerulein nor TLCS, triggers ZVAD-sensitive TUNEL positivity in acinar cells. Pancreas fragments were incubated with ridaifen (5 μmol/L), TLCS (250 μmol/L), or caerulein (100 nmol/L) with or without 25 μmol/L ZVAD for 3 hours. Sections were stained for TUNEL and counterstained with methyl green as described in the text. Arrows point to TUNEL-positive nuclei. (A) Scale bar: 50 μm. (BColumns indicate means ± SD values from 2 experiments in which at least 5 fields (10×) containing more than 2000 cells were counted. Horizontal dashed line indicates control values for samples incubated with buffer alone. Asterisks denote a P value less than .05 when bracketed columns were compared. (C) Ridaifen (rid), but neither caerulein nor TLCS, triggers ZVAD-sensitive caspase activation. Freshly prepared acini were incubated with 250 μmol/L TLCS, 100 nmol/L caerulein, or 5 μmol/L ridaifen B for 2 hours and then washed with saline. They were lysed and caspase activity in the lysed samples was measured using the fluorogenic caspase substrate DEVD-AMC as described in the Materials and Methods section. Columns indicate means ± SD values from 3 experiments performed in duplicate. Asterisks indicate a P value less than .05 when bracketed columns were compared.
Figure 3
Figure 3
TLCS- and caerulein-induced in vitro acinar cell death is associated with necrosome formation. (A and B) Effect of TLCS and caerulein on necrosome formation. Freshly prepared acini were incubated for 2 hours in buffer ± 250 μmol/L TLCS or 100 nmol/L caerulein (caer) ± necrostatin-1 (nec). After detergent lysis, samples containing the total lysate (T), the high-speed supernatant (S), and the high-speed, detergent-insoluble pellet (P) were obtained as described in the Materials and Methods section. These 3 fractions were subjected to immunoblot analysis using antibodies raised against RIP1 and RIP3. (C) Co-immunoprecipitation for RIP1 and RIP3. Samples were immunoprecipitated with anti-RIP1 antibodies and protein A/G magnetic beads as described in the Materials and Methods section. After elution from the beads the immunoprecipitants were subjected to immunoblot analysis with antibodies against RIP1 (left) and RIP3 (right) (HC points to IgG heavy chain). (D–G) Effect of necrostatin on necrosome formation. Acini were incubated with caerulein or TLCS ± necrostatin and then fractionated to yield a high-speed supernatant (S) and a high-speed, detergent-insoluble pellet (P). Those fractions then were immunoblotted using (D) anti-RIP1 antibodies or (E) anti-RIP3 antibodies. (F and G) Quantitation of immunoblots shown in panels D and E, respectively. The ratio of staining in the high-speed necrosome pellet to that in the high-speed supernatant is shown. Bracketed columns with asterisks denote differences with a P value less than .05. (H and I) Effect of caerulein and TLCS on transfer of MLKL to the necrosome. Samples were prepared and analyzed as described for panels D–G. Asterisks indicate a P value less than .05 when compared with samples not exposed to either TLCS or caerulein. (I) Quantitation of blots in panel H is shown. (J) Exposure of acini to caerulein or TLCS leads to MLKL phosphorylation. Acini were incubated for 2 hours with buffer, 100 nmol/L caerulein, or 250 μmol/L TLCS and lysed with detergent. The lysate was immunoblotted using anti-total MLKL (left) and anti–phospho-MLKL (right) antibodies. (K and L) Effect of ZVAD on TLCS or caerulein-induced necrosome formation. Samples were prepared and analyzed as described for panels D–G. Asterisks indicate a P value less than .05 when compared with samples not exposed to either TLCS or caerulein. (K) Shows immunoblot and (L) reports results of immunoblot quantitation. (F, G, I, and J) Columns indicate means ± SD values from 3 independent experiments. NS, statistically nonsignificant differences when bracketed columns were compared.
Figure 4
Figure 4
Genetic deletion of RIP3 reduces LDH leakage and necrosome formation in acinar cells exposed to either TLCS or caerulein (caer). (A) LDH leakage. Acini from wild-type and RIP3-/- mice were prepared and incubated with caerulein (100 nmol/L) or TLCS (250 or 500 μmol/L) for 4 hours. Cell injury was quantitated by measuring LDH leakage as described in the Materials and Methods section. Columns show the results of 3 independent experiments performed in duplicate. Asterisks denote a P value less than .05 when results from RIP3-/- mice are compared with wild-type animals. (B) Immunoblot. Acini from wild-type and RIP3-/- mice were incubated with TLCS or caerulein for 2 hours as described in the Materials and Methods section. Necrosome formation was evaluated using anti-RIP1 antibodies as shown in Figure 3A. The acini were lysed and fractions containing the total lysate (T), the high-speed supernatant (S), and the high-speed necrosome pellet (P) were isolated. They were subjected to immunoblot analysis using antibodies to RIP1. Note the absence of RIP1 staining in the necrosome fraction (P) of RIP3-/- cells exposed to either caerulein or TLCS compared with wild-type cells in Figure 3A.
Figure 5
Figure 5
Pancreatitis-inducing concentrations of caerulein or TLCS trigger acinar cell ATP depletion that is not prevented by necrostatin (nec). (A) ATP depletion in response to 100 nmol/L caerulein (caer). Acini were suspended in buffer containing either a secretory concentration or a pancreatitis-inducing concentration of caerulein (ie, 10 pmol/L or 100 nmol/L, respectively) and ATP levels at the indicated times were quantitated as described in the Materials and Methods section. Asterisks indicate a P value less than .05 when ATP levels noted in samples exposed to 100 nmol/L caerulein were compared with control untreated acini. (B) ATP depletion in response to TLCS. Experiments were performed as described in panel A, but using either 100 μmol/L or 250 μmol/L TLCS. ATP levels at the indicated times were quantitated as described in the Materials and Methods section. The results are from 5 independent experiments performed in quadruplicate. Asterisks indicate a P value less than .05 when the ATP level noted in 250 μmol/L TLCS was compared with the ATP level noted in control untreated acini. (C) Necrostatin does not prevent caerulein or TLCS-induced ATP depletion. Acini were incubated with 100 nmol/L caerulein or 250 μmol/L TLCS ± 50 μmol/L necrostatin for 60 minutes and ATP levels were measured as described in the Materials and Methods section. Columns show the means ± SD from 5 independent experiments performed in quadruplicate. NS over bracketed bars indicates statistically nonsignificant differences in ATP levels.
Figure 6
Figure 6
Effect of intracellular calcium chelation on ATP depletion, necrosome formation, and on cell injury. (A) BAPTA prevents caerulein (caer) and TLCS-induced ATP depletion. Acini were preincubated with or without BAPTA as described in the Materials and Methods section, and then exposed to 100 nmol/L caerulein or 250 μmol/L TLCS. ATP depletion was quantitated over 60 minutes as described in the Figure 5 legend. Columns show the means ± SD from 5 independent experiments performed in quadruplicate. Asterisks over bracketed columns indicate a P value less than .05. (B and C) BAPTA prevents caerulein and TLCS-induced necrosome formation. After preloading acini with or without BAPTA, necrosome formation was evaluated as described in Figure 3A. (B) Shows immunoblot and (C) reports results of immunoblot quantitation. Columns show the average ± SD from 3 independent experiments. (D) BAPTA prevents caerulein and TLCS-induced cell injury/death. Freshly prepared acini preloaded with or without BAPTA were exposed to caerulein (100 nmol/L) or TLCS (250 μmol/L) for 4 hours. PI uptake was quantitated as described in the Materials and Methods section and in Figure 1. Columns show the average ± SD from 5 independent experiments performed in quadruplicate. Asterisks indicate a P value less than .05 when bracketed columns were compared. Contr, control.
Figure 7
Figure 7
Inhibition of RIP1 with necrostatin or genetic deletion of RIP3 reduces the severity of TLCS-induced acute pancreatitis. Acute pancreatitis was induced by retrograde pancreatic duct infusion of TLCS in wild-type (wt) and knockout (RIP3-/-) mice as described in the Materials and Methods section, whereas control animals were infused only with saline. Randomly selected mice were pretreated with 6 mg/kg necrostatin (nec), 11.7 mg/kg ZVAD, or both. Mice were killed 20 hours after infusion. (A) Photomicrographs. Representative H&E-stained pancreas samples are shown. Scale bar: 200 μm. (B–D) Pancreatitis severity. Quantitation of edema, inflammation, and acinar cell injury/death was accomplished as described in the text. Vertical columns denote mean ± SD values from 5–9 mice in each group. Asterisks indicate statistically significant difference (P < .05) compared with wild-type mice with TLCS-induced pancreatitis that were not given necrostatin or ZVAD. (E and F) Necrostatin and genetic deletion of RIP3 reduce plasma IL6 and MCP-1 levels in TLCS-induced pancreatitis. Plasma samples were obtained at the time of death (20 hours after TLCS infusion), and MCP-1 as well as IL6 levels were measured as described in the Materials and Methods section.
Figure 8
Figure 8
Inhibition of RIP1 with necrostatin (nec) or genetic deletion of RIP3 reduces the severity of caerulein-induced acute pancreatitis. Caerulein-induced acute pancreatitis was elicited in wild-type (RIP3+/+) and RIP3-/- mice by hourly intraperitoneal injections of caerulein (caer) (50 μg/kg/injection) given for 12 hours. Randomly selected mice were pretreated with 6 mg/kg necrostatin, 11.7 mg/kg ZVAD, or both. The animals were killed 24 hours after the start of caerulein administration. (A) Photomicrographs of H&E-stained samples of pancreas. Scale bar: 200 μm. (B–E) Pancreatitis severity. Pancreatitis severity was quantitated as described in Figure 7. Columns indicate mean ± SD values from 5 mice in each group. Asterisks indicate a P value less than .05 when compared with samples from wild-type mice that were not given necrostatin or ZVAD. (F and G) Necrostatin and genetic deletion of RIP3 reduce serum IL6 and MCP-1 levels in caerulein-induced pancreatitis. Plasma MCP-1 and IL6 levels were measured from blood obtained at the time of death. wt, wild-type.
Figure 9
Figure 9
Delayed administration of necrostatin (nec) halts progression of TLCS-induced acinar cell injury/necrosis. (A) Representative photomicrographs are shown. Mice were infused with TLCS while necrostatin was administered at the indicated times before or after TLCS infusion. The mice were killed 20 hours after the start of TLCS infusion. Scale bar: 200 μm. (B) Time dependence of the necrostatin effect. Mice were infused with TLCS at zero time and given necrostatin at the indicated times either before or after TLCS infusion. They were killed 20 hours after TLCS infusion and TLCS-induced acinar cell injury/death was quantitated by morphometry. Dashed line defines extend of necrosis in control mice infused with TLCS at time 0 and never given necrostatin. (C) Necrostatin halts the progression of TLCS-induced acinar cell injury/death. Mice were infused with TLCS at zero time and killed 2, 4, or 6 hours later to quantitate TLCS-induced cell death at those times after TLCS infusion (solid line). Other mice infused with TLCS at zero time were given necrostatin at those times (2, 4, or 6 hours), but not killed at those times. Instead, they were killed 20 hours after TLCS infusion. Columns indicate mean ± SD values obtained from 5 mice in each group. Asterisks at 20 hours denote a P value less than .05 for those animals when compared with mice never given necrostatin. Dashed line allows for comparison of cell death immediately before necrostatin administration and cell death at the time of sacrifice.

Similar articles

Cited by

References

    1. Frossard J.L., Steer M.L., Pastor C.M. Acute pancreatitis. Lancet. 2008;371:143–152. - PubMed
    1. Yadav D., Lowenfels A.B. The epidemiology of pancreatitis and pancreatic cancer. Gastroenterology. 2013;144:1252–1261. - PMC - PubMed
    1. Galluzzi L., Vitale I., Abrams J.M. Molecular definitions of cell death subroutines: recommendations of the Nomenclature Committee on Cell Death 2012. Cell Death Differ. 2012;19:107–120. - PMC - PubMed
    1. Davidovich P., Kearney C.J., Martin S.J. Inflammatory outcomes of apoptosis, necrosis and necroptosis. Biol Chem. 2014;395:1163–1171. - PubMed
    1. Holler N., Zaru R., Micheau O. Fas triggers an alternative, caspase-8-independent cell death pathway using the kinase RIP as effector molecule. Nat Immunol. 2000;1:489–495. - PubMed

LinkOut - more resources