. 2016 Sep 8;1(14):e88468.
doi: 10.1172/jci.insight.88468.

In vivo disruption of latent HSV by designer endonuclease therapy

Affiliations

In vivo disruption of latent HSV by designer endonuclease therapy

Martine Aubert et al. JCI Insight. .

Abstract

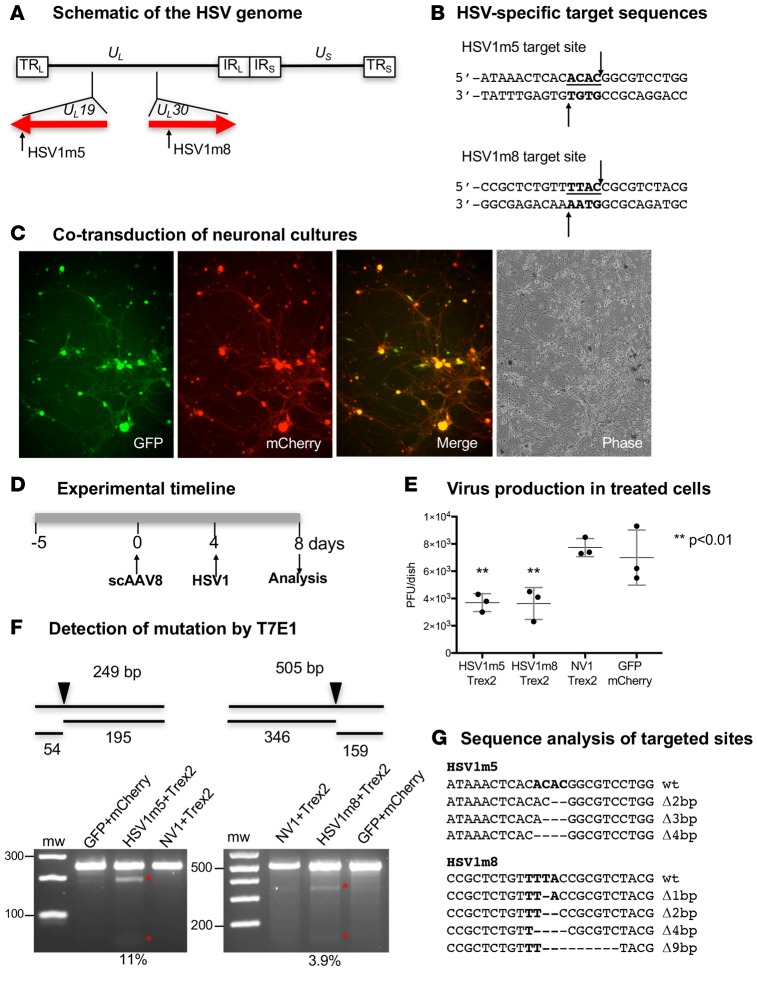
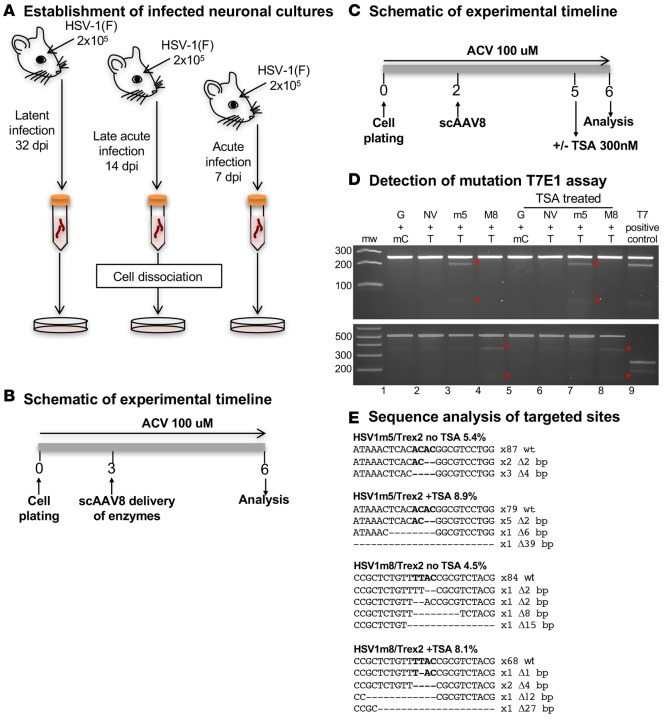
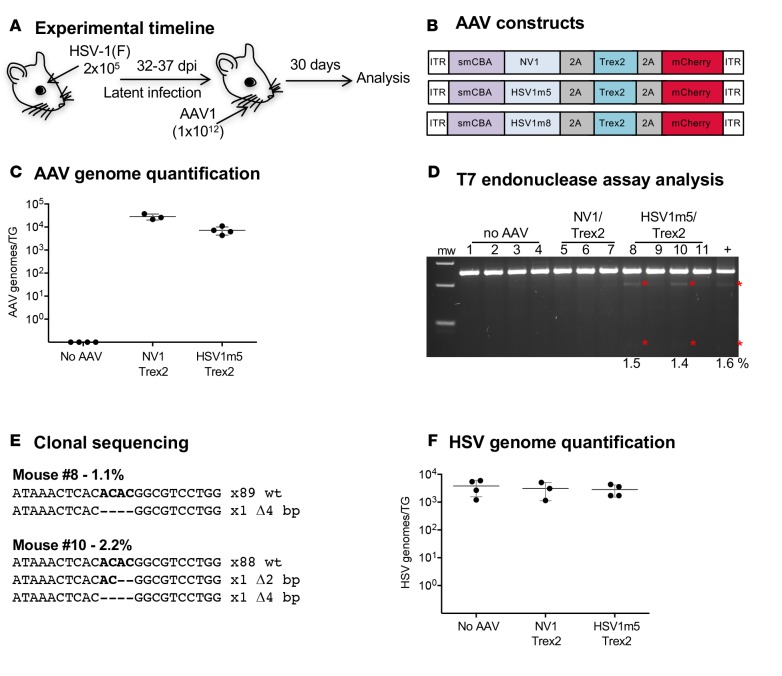
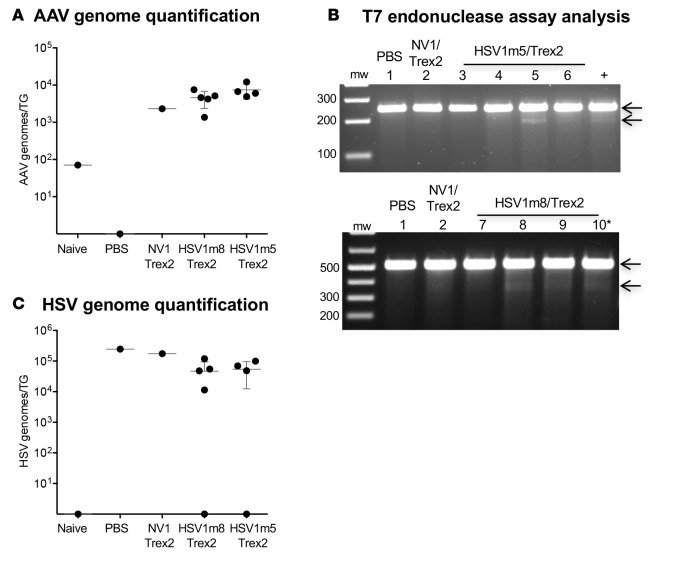
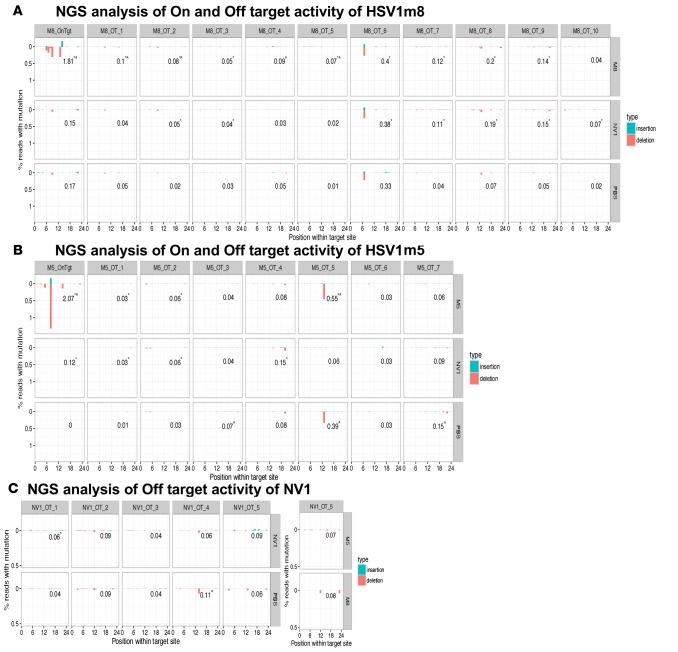
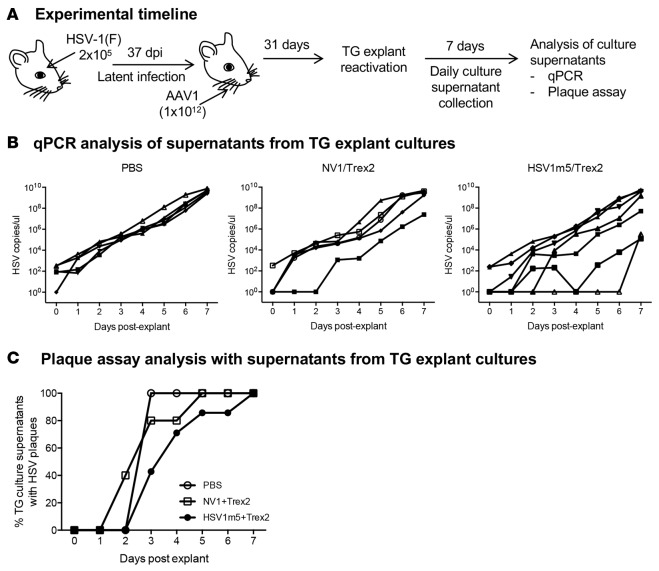
A large portion of the global population carries latent herpes simplex virus (HSV), which can periodically reactivate, resulting in asymptomatic shedding or formation of ulcerative lesions. Current anti-HSV drugs do not eliminate latent virus from sensory neurons where HSV resides, and therefore do not eliminate the risk of transmission or recurrent disease. Here, we report the ability of HSV-specific endonucleases to induce mutations of essential HSV genes both in cultured neurons and in latently infected mice. In neurons, viral genomes are susceptible to endonuclease-mediated mutagenesis, regardless of the time of treatment after HSV infection, suggesting that both HSV lytic and latent forms can be targeted. Mutagenesis frequency after endonuclease exposure can be increased nearly 2-fold by treatment with a histone deacetylase (HDAC) inhibitor. Using a mouse model of latent HSV infection, we demonstrate that a targeted endonuclease can be delivered to viral latency sites via an adeno-associated virus (AAV) vector, where it is able to induce mutation of latent HSV genomes. These data provide the first proof-of-principle to our knowledge for the use of a targeted endonuclease as an antiviral agent to treat an established latent viral infection in vivo.


Conflict of interest statement

The authors have declared that no conflict of interest exists.

Figures

Figure 1
Figure 1. Impact of HSV-specific HE exposure on HSV replication in neuronal cultures.
(A) Schematic representation of the HSV-1 genome. The long terminal and internal repeats (TRL and IRL), and the internal and terminal short repeats (TRS and IRS), bordering the unique long (UL) and unique short (US) regions are shown. The location of the target sequences recognized by HSV1m5 in the UL19 gene and HSV1m8 in the UL30 gene are indicated. (B) The sequences recognized by HSV1m5 and HSV1m8 are shown. The 4 nucleotides constituting the 3′ overhang generated by HE cleavage are bold and underlined. Arrows indicate enzyme target or cleavage sites. (C) Fluorescence images of neuronal cultures taken at 7 days after cotransduction with scAAV8-sCMV-GFP and scAAV8-sCMV-mCherry at an MOI of 1 × 10⁶ vg/AAV/neuron. Representative GFP, mCherry, merged GFP/mCherry, and phase images are shown. Magnification 100×. (D) Schematic of the experimental timeline. Triplicate neuronal cultures were established from dissociated murine TGs and cotransduced with 2 scAAV8 vectors expressing HSV1m5 and Trex2, HSV1m8 and Trex2, NV1 and Trex2, or GFP and mCherry at a MOI of 1 × 10⁶ vg/AAV/neuron. At 4 days after AAV transduction, cultures were infected with HSV-1 FΔUS5 at an MOI of 1 PFU/neuron for 4 additional days. (E) Virion release in culture media was quantified by plaque assay titration. The mean ±SD of triplicate wells is indicated. The P value was calculated using a 1-sided t test. (F) Mutagenic event detection by T7E1 assay. Schematic representation of PCR amplicon with full-size and T7 endonuclease cleavage product sizes indicative of HSV-specific HE cleavage and mutagenesis. The arrow indicates the location of the HE target site in the PCR product. The HSV regions containing the target site were PCR amplified from total genomic DNA obtained from pooled triplicate dishes and subjected to T7E1 digestion before separation on a 3% agarose gel. mw, molecular weight size ladder; red asterisks indicate cleavage products. The relative mutation frequency was determined using ImageJ. (G) Target site–containing PCR amplicons were cloned and sequenced from individual bacterial colonies. Δ, deletion. Bold indicates the 4 nucleotides constituting the 3′ overhang generated upon HE target site cleavage.
Figure 2
Figure 2. In vitro–targeted mutagenesis in neurons isolated from HSV-infected mice.
(A) Schematic of neuronal culture generation. Five mice were infected with 2 × 10⁵ PFU of HSV-1(F) in the right eye following corneal scarification for each time point and left for 7, 14, or 32 days prior to collection of the right TGs. After tissue dissociation by enzymatic digestion, neuronal cultures were established, and cells were cultured in medium supplemented with 100 μM ACV. (B) Experimental timeline. Cells were cotransduced in quadruplicate with either scAAV8-sCMV-HSV1m5 and scAAV8-sCMV-Trex2 or scAAV8-sCMV-HSV1m8 and scAAV8-sCMV-Trex2 at an MOI of 1 × 10⁶ vg/AAV/neuron for 3 days prior to analysis. (C) Timeline for the evaluation of the effect of TSA. Nine mice were infected with 2 × 10⁵ PFU in the right eye following corneal scarification and, 7 days later, the right TGs were collected. After tissue dissociation by enzymatic digestion, neuronal cultures were established and cells were cultured in medium supplemented with 100 μM ACV. Eight wells per condition were cotransduced with scAAV8 vectors expressing HSV1m5 and Trex2, HSV1m8 and Trex2, NV1 and Trex2, or GFP and mCherry at an MOI of 1 × 10⁶ vg/AAV/neuron for 3 days, after which 4 wells were left untreated while the other 4 were treated with 300 nM TSA for 1 day prior to analysis. (D) Mutagenic event detection by T7E1 assay. The HSV regions containing the target site were PCR amplified from total genomic DNA obtained from pooled quadruplicate wells, subjected to T7E1 digest, and separated on a 3% agarose gel. mw, molecular weight size ladder; red asterisks indicate cleavage products. G, GFP ; NV, NV1; mC, mCherry; T, Trex2; M8, HSV1m8, m5, HSV1m5; T7, T7E1. (E) HSV target sequences from enzyme-treated neurons with and without TSA. ACV, Acyclovir.
Figure 3
Figure 3. HE-directed mutagenesis of latent HSV in vivo.
(A) Experimental timeline. Mice were infected with 2 × 10⁵ PFU HSV-1(F) in the right eye following corneal scarification and, 32–37 days later, were injected in the right whiskerpad with 1 × 10¹² vector genomes of ssAAV1-smCBA-HSV1m5-Trex2-mCherry or ssAAV1-smCBA-NV1-Trex2-mCherry. Analysis was performed at 30 days after AAV exposure. (B) Schematic representation of the ssAAV constructs used here and Figure 6. (C) Levels of AAV genomes were quantified by ddPCR in right (ipsilateral) TGs from infected mice. Mean ±SD are indicated. (D) Mutagenic event detection by T7E1 assay. The HSV regions containing the target site were PCR amplified from total genomic DNA obtained from the right TG. Products were subjected to T7E1 digestion and separated on a 3% agarose gel. mw, molecular weight size ladder; red asterisks indicate cleavage products. (E) Clonal sequencing of PCR amplicons from TG of treated animals. (F) Levels of latent HSV genomes were quantified by ddPCR in right (ipsilateral) TGs from infected mice. Mean ±SD are indicated.
Figure 4
Figure 4. IHC and histological staining of TG from mice exposed to HSV-specific HE.
(A) IHC staining for NeuN and mCherry. Left and middle panels scale bar: 1 mm; right panels scale bar: 300 μM. (B) H&E staining of TGs from naive control mice injected with either 1 × 10¹² ssAAV1-smCBA-NV1-Trex2-mCherry, ssAAV1-smCBA-NV1-Trex2-mCherry, or 50 μl PBS. Left panels scale bar: 1 mm; right panels scale bar: 300 μM
Figure 5
Figure 5. HE-directed mutagenesis of latent HSV in vivo.
(A) Levels of AAV genomes were quantified by ddPCR in right (ipsilateral) TGs from infected and naive mice. Mean ±SD are indicated. (B) Mutagenic event detection by T7E1 assay. The HSV regions containing the target site for HSV1m5 (top panel) or HSV1m8 (bottom panel) were PCR amplified from total genomic DNA obtained from the right (ipsilateral) TG. Products were subjected to T7E1 digestion and separated on a 3% (HSV1m5) or 1% (HSV1m8) agarose gel. mw, molecular weight size ladder. (C) Levels of latent HSV genomes were quantified by ddPCR in right (ipsilateral) TGs from infected and naive mice. Mean ±SD are indicated.
Figure 6
Figure 6. NGS analysis of HSV-specific HE off-target activity in vivo.
Graphical representation of the percent mutations detected at the enzyme target site (On) and off-target sites (Off) for the HSV-specific enzymes HSV1m8 (A) and HSV1m5 (B), as well as the nonviral enzyme NV1 (C). The numbers in each plot indicate the total percent reads with mutation. The analysis was performed using TG genomic DNA from mice of the experiment described in Figure 5 and Tables 3–4: mouse 1 (PBS), mouse 2 (NV1), mouse 5 (HSV1m5), and mouse 10 (HSV1m8). Statistical analysis was performed using χ2 test of proportions. *P ≤ 0.05 compared with PBS and ^P ≤ 0.05 compared with NV1.
Figure 7
Figure 7. Impact of HE-directed mutagenesis of latent HSV on viral reactivation.
(A) Experimental timeline for viral reactivation studies. Mice were infected with 2 × 10⁵ PFU HSV-1(F) in the right eye following corneal scarification and, 37 days later, were injected in the right whiskerpad with 1 × 10¹² vector genomes of ssAAV1-smCBA-HSV1m5-Trex2-mCherry or ssAAV1-smCBA-NV1-Trex2-mCherry. Individual ipsilateral TGs were explanted into culture wells containing monolayers of Vero cells, and culture media was collected and replaced daily for 7 days. (B) HSV DNA released into the culture media over the 7-day period was quantified by qPCR for control animals (PBS, left panel, n = 5), animals treated with the nonviral enzyme (NV1/Trex2, middle panel, n = 5), or animals treated with HSV-specific HE (HSV1m5/Trex2, right panel, n = 7). For each treatment group (PBS, NV1/Trex2, and HSV1m5/Trex2), 3 animals had no reactivable HSV and, therefore, were not depicted on the corresponding graph. Statistics using a log-rank test showed that the differences between controls and treated animals was not significant (P = 0.12). (C) Presence of infectious virus released into the culture media over the 7-day period was detected by plaque assay on Vero cell monolayers for control animals (PBS, left panel, n = 5), animals treated with the nonviral enzyme (NV1/Trex2, middle panel, n = 5), or animals treated with HSV-specific HE (HSV1m5/Trex2, right panel, n = 7). Statistics using a log-rank test showed that the differences between controls and treated animals was not significant (P = 0.2).

References

    1. Roizman B, Knipe DM, Whitley RJ. 2007. Herpes Simplex Viruses. In: Knipe DM, Howley PM, eds. Fields Virology. Wolters Kluwer Health/Lippincott Williams & Wilkins; 2007:2502–2599.
    1. Wald A, Zeh J, Selke S, Ashley RL, Corey L. Virologic characteristics of subclinical and symptomatic genital herpes infections. N Engl J Med. 1995;333(12):770–775. doi: 10.1056/NEJM199509213331205. - DOI - PubMed
    1. Crespi CM, Cumberland WG, Wald A, Corey L, Blower S. Longitudinal study of herpes simplex virus type 2 infection using viral dynamic modelling. Sex Transm Infect. 2007;83(5):359–364. doi: 10.1136/sti.2006.022020. - DOI - PMC - PubMed
    1. Wald A, Corey L, Cone R, Hobson A, Davis G, Zeh J. Frequent genital herpes simplex virus 2 shedding in immunocompetent women. Effect of acyclovir treatment. J Clin Invest. 1997;99(5):1092–1097. doi: 10.1172/JCI119237. - DOI - PMC - PubMed
    1. Fife KH, et al. Effect of valacyclovir on viral shedding in immunocompetent patients with recurrent herpes simplex virus 2 genital herpes: a US-based randomized, double-blind, placebo-controlled clinical trial. Mayo Clin Proc. 2006;81(10):1321–1327. doi: 10.4065/81.10.1321. - DOI - PubMed