. 2016 Sep 8;1(14):e88328.
doi: 10.1172/jci.insight.88328.

Lack of immunoediting in murine pancreatic cancer reversed with neoantigen

Lack of immunoediting in murine pancreatic cancer reversed with neoantigen

Rebecca A Evans et al. JCI Insight. .

Abstract

In carcinogen-driven cancers, a high mutational burden results in neoepitopes that can be recognized immunologically. Such carcinogen-induced tumors may evade this immune response through "immunoediting," whereby tumors adapt to immune pressure and escape T cell-mediated killing. Many tumors lack a high neoepitope burden, and it remains unclear whether immunoediting occurs in such cases. Here, we evaluated T cell immunity in an autochthonous mouse model of pancreatic cancer and found a low mutational burden, absence of predicted neoepitopes derived from tumor mutations, and resistance to checkpoint immunotherapy. Spontaneous tumor progression was identical in the presence or absence of T cells. Moreover, tumors arising in T cell-depleted mice grew unchecked in immune-competent hosts. However, introduction of the neoantigen ovalbumin (OVA) led to tumor rejection and T cell memory, but this did not occur in OVA immune-tolerant mice. Thus, immunoediting does not occur in this mouse model - a likely consequence, not a cause, of absent neoepitopes. Because many human tumors also have a low missense mutational load and minimal neoepitope burden, our findings have clinical implications for the design of immunotherapy for patients with such tumors.


Conflict of interest statement

The authors have declared that no conflict of interest exists.

Figures
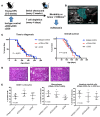
Figure 1
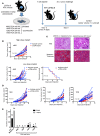
Figure 1. T cell dependency of KPC pancreatic cancer.
(A) Experimental design for survival studies of syngeneic KPC mice treated with an isotype control antibody, depleted of CD4 and CD8 T cells (αCD4/αCD8), or depleted of CD8 T cells alone (αCD8) beginning at 3–5 weeks of age. n = 19–21 mice per cohort. Starting at 7–8 weeks of age, mice were monitored by ultrasound every other week for tumor development and examined daily for morbidity. (B) Representative image of a tumor at the time of diagnosis by abdominal ultrasound (volume = 19 mm3). IVC, inferior vena cava. (C) Tumor-free survival according to ultrasound monitoring (time to diagnosis) and overall survival according to daily monitoring for the 3 cohorts described in A. P values were determined by log-rank (Mantel-Cox) analysis. (D) H&E staining of a representative pancreatic tumor from each treatment cohort (original magnification, ×10). (E) Flow cytometric analysis of tumors at the time of euthanasia (4–6 mice per cohort) to assess infiltration by leukocytes (CD45+ cells as percentage of viable cells), macrophages (CD45+CD19F4/80+ as percentage of viable CD45+ cells), and immature myeloid cells (CD45+CD19Gr-1+CD11b+ as percentage of viable CD45+ cells). Data are shown as whisker plots (symbols represent individual experimental measurements; center line, mean; outer lines; 1 SD), with P values determined by 2-way ANOVA.
Figure 2
Figure 2. KPC-derived tumor cell lines grow progressively upon implantation, regardless of donor or host T cell status.
(A) Experimental design using syngeneic pancreatic ductal adenocarcinoma (PDA) cell lines generated from immune-competent KPC mice or KPC mice serially depleted of CD4/CD8 T cells beginning at 3–5 weeks of age, as shown in Figure 1A. Cell lines were implanted subcutaneously (S.C.) in syngeneic mice predepleted of CD4 and CD8 T cells or administered an isotype control antibody (n = 8–10 mice per cohort). Tumor growth was measured by caliper over time, and mice were monitored for overall survival. (B) Subcutaneous tumor growth of 4662 PDA cells in immune-competent syngeneic hosts (Isotype control) or immune-compromised mice (αCD4/αCD8), shown with high inoculum (5 × 10⁵ tumor cells) or low inoculum (105 cells). For the lower dose, mice were also monitored for overall survival. Growth data are shown as spaghetti plots of individual mice, and P values indicate analysis by 2-way ANOVA. Survival data were analyzed by log-rank (Mantel-Cox) test. (C) Histology of 4662 implanted tumor after 3 weeks of growth (left panels) stained by H&E and Masson’s trichrome. Right panels show H&E and trichrome staining of an autochthonous KPC tumor. Original magnification, ×10. (D) Subcutaneous growth of CD4- and CD8-depleted KPC cell lines (1262, 1493, and 1638; generated as described in A) in immune-competent syngeneic isotype control or αCD4/αCD8 mice. n = 8–10 mice per cohort. P values shown were generated by 2-way ANOVA. (E) Numbers of predicted neoepitopes for the B16 murine melanoma cell line, the 4662 PDA cell line derived from an immune-competent KPC mouse, and 3 cell lines derived from T cell–depleted KPC mice (1262, 1493, and 1638). Predictions are shown for both the 50 nM binding threshold (black bars) and 100 nM threshold (gray bars).
Figure 3
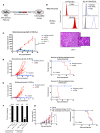
Figure 3. Expression of a strong antigen in a KPC tumor induces CD8-dependent tumor elimination.
(A) Parental 4662 cells were retrovirally transduced with a Td-Tomato/ovalbumin-expressing (Tdt/OVA-expressing) construct and sorted to generate single-cell clones. (B) Flow cytometric analysis of the parental 4662 cell line compared to the V6.Ova clone. Cells were assessed for expression of Td-tomato, incubated with or without IFN-γ, and stained using a mAb against SIINFEKL-bound H2-Kb (MHC class I) and gated on viable (Live/Dead aqua-negative) cells. Data are representative of 3 independent experiments. (C) A high dose of the V6.Ova clone (106 cells) was subcutaneously implanted in syngeneic mice treated with an isotype control antibody, CD8-depleting antibody (αCD8), CD4-depleting antibody (αCD4), or an NK cell–depleting antibody (αNK1.1) and monitored for growth over time by caliper. n = 7–8 mice per cohort (mean tumor volume was plotted with error bars representing + 1 SD; ****P < 0.0001 by 2-way ANOVA) (left). H&E staining of an implant at day 8 of an isotype-treated mouse showing presence of tumor cells with marked infiltration of lymphocytes (original magnification, ×10; inset, ×40) (right). (D) Tumor growth at a lower inoculum of 0.75 × 10⁶ V6.Ova cells was assessed in isotype-treated and CD8-depleted cohorts, which were also monitored for overall survival (n = 12–13 mice per cohort; P value by log-rank [Mantel-Cox] test). (E) Growth of V6.Ova tumor cells implanted orthotopically in mice treated with isotype control or αCD8 with an inoculum of 0.125 × 10⁶ cells. Mice were monitored for tumor growth by ultrasound and assessed for overall survival. n = 9–10 mice per cohort; data shown are pooled from 2 independent experiment experiments. P values were determined by 2-way ANOVA (tumor growth) and log-rank (Mantel-Cox) (overall survival). (F) A summary of subcutaneous and orthotopic growth of parental 4662 cells and isotype-treated or CD8-depleted V6.Ova-implanted cohorts. Numbers above bars indicate the number of mice growing tumors over the total number of mice tested. (G) C57BL/6 mice that rejected a subcutaneous V6.Ova implant after 6 weeks were either CD4/CD8 depleted or administered an isotype control and then rechallenged with parental 4662 on the opposite flank. A third naive cohort was simultaneously challenged with parental 4662 cells at the same dose of 105 cells. n = 9–10 mice per cohort. Mice were followed by caliper for tumor growth and monitored for overall survival. P values represent analysis by 2-way ANOVA or log-rank (Mantel-Cox) tests, respectively; **P < 0.05; ***P < 0.001.
Figure 4
Figure 4. Selective outgrowth of Ova tumors in immune-competent mice.
(A) Experimental design of a competition assay between V6.Ova cells and negatively sorted (OvaNeg) cells subcutaneously implanted at the following ratios in immune-competent or CD8-depleted cohorts (n = 5 mice per cohort): 100% V6.Ova (7.5 × 10⁵ V6.Ova cells); 90% V6.Ova/10%OvaNeg (6.75 × 10⁵ V6.Ova cells and 0.75 × 10⁵ OvaNeg cells); 80% V6.Ova/20%OvaNeg (6.0 × 10⁵ V6.Ova cells and 1.5 × 10⁵ OvaNeg cells); and 100%OvaNeg (7.5 × 10⁵ OvaNeg cells). (B) Implants containing either a combination of Ova+ and Ova cells (90% V6.Ova and 80% V6.Ova) or a 100% population of V6.Ova or OvaNeg cells were assessed for tumor growth. Data are shown as the individual growth curves for each mouse per cohort (n = 5 mice per cohort). Three independent experiments were performed. P values represent 2-way ANOVA. Overall survival was assessed by log-rank (Mantel-Cox) for each cohort.
Figure 5
Figure 5. Immunity is dependent on cytotoxic Ova-specific CD8 T cells.
(A) From the experimental schema in Figure 4A, Ova-specific CD8+ T cells in 80% V6.OVA tumors at day 14 were compared with spleens and quantified in the tumor in all cohorts. n = 5–7 mice per cohort; data are representative of 3 independent experiments. ***P < 0.001 by unpaired 2-tailed Student’s t test. ****P < 0.0001 by 2-way ANOVA. Data are shown as whisker plots (symbols represent individual experimental measurements; center line, mean; outer lines; 1 SD). (B) Intratumoral CD8+ T cells in 80% V6.Ova-implanted mice were assessed by flow cytometry for intracellular levels of granzyme B and Tbet at day 21. Ki67 and IFN-γ expression was also assessed with or without stimulation with PMA/ionomycin. n = 6 mice per cohort. Data are representative of 2 independent experiments. ***P < 0.001 by unpaired 2-tailed Student’s t test. ****P < 0.0001 by 2-way ANOVA. (C) Tumor-enriched live cells (CD45CD31CD90) were assessed for Td-Tomato expression by flow cytometry; Td-tomato+ cells are shown as a percentage of this tumor-enriched population across cohorts. n = 5–7 mice per cohort. Data are representative of 3 independent experiments. ****P < 0.0001 calculated by 2-way ANOVA. Representative data are shown as a histogram of Td-tomato expression for each cohort. (D) H&E stain of an isotype-treated 80% V6.Ova tumor (original magnification, ×10).

References

    1. Sharma P, Allison JP. The future of immune checkpoint therapy. Science. 2015;348(6230):56–61. doi: 10.1126/science.aaa8172. - DOI - PubMed
    1. Shankaran V, et al. IFNgamma and lymphocytes prevent primary tumour development and shape tumour immunogenicity. Nature. 2001;410(6832):1107–1111. doi: 10.1038/35074122. - DOI - PubMed
    1. Matsushita H, et al. Cancer exome analysis reveals a T-cell-dependent mechanism of cancer immunoediting. Nature. 2012;482(7385):400–404. doi: 10.1038/nature10755. - DOI - PMC - PubMed
    1. Zhang B, et al. Immune surveillance and therapy of lymphomas driven by Epstein-Barr virus protein LMP1 in a mouse model. Cell. 2012;148(4):739–751. doi: 10.1016/j.cell.2011.12.031. - DOI - PMC - PubMed
    1. Willimsky G, Blankenstein T. Sporadic immunogenic tumours avoid destruction by inducing T-cell tolerance. Nature. 2005;437(7055):141–146. doi: 10.1038/nature03954. - DOI - PubMed

Publication types