. 2016 Oct;18(10):1031-42.
doi: 10.1038/ncb3411. Epub 2016 Sep 19.

iPSC-derived cardiomyocytes reveal abnormal TGF-β signalling in left ventricular non-compaction cardiomyopathy

Affiliations

iPSC-derived cardiomyocytes reveal abnormal TGF-β signalling in left ventricular non-compaction cardiomyopathy

Kazuki Kodo et al. Nat Cell Biol. 2016 Oct.

Abstract

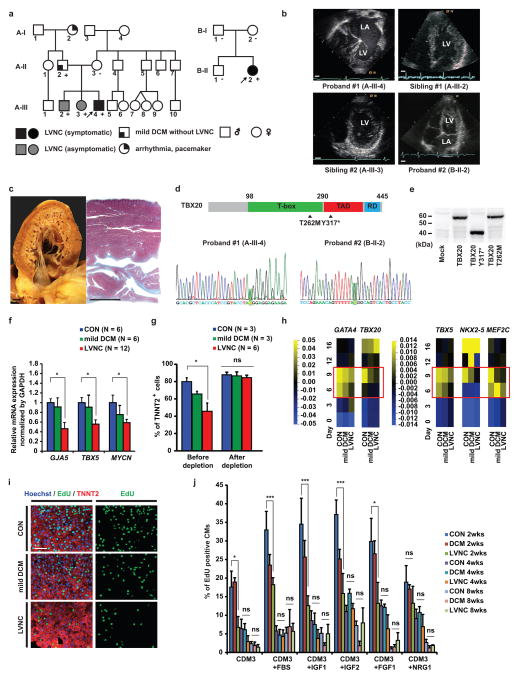
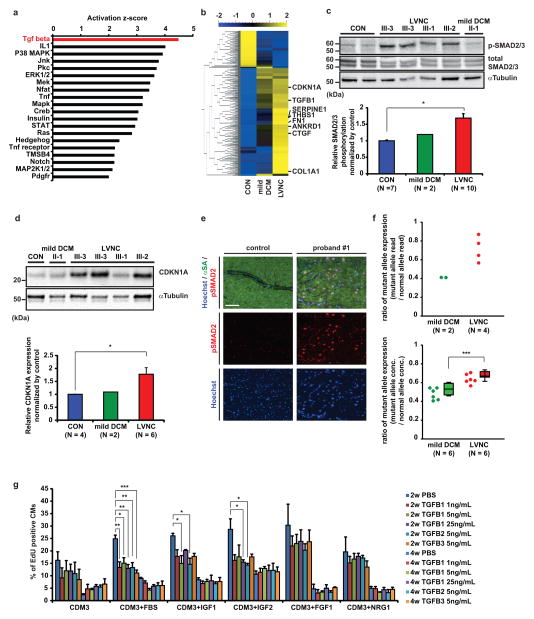
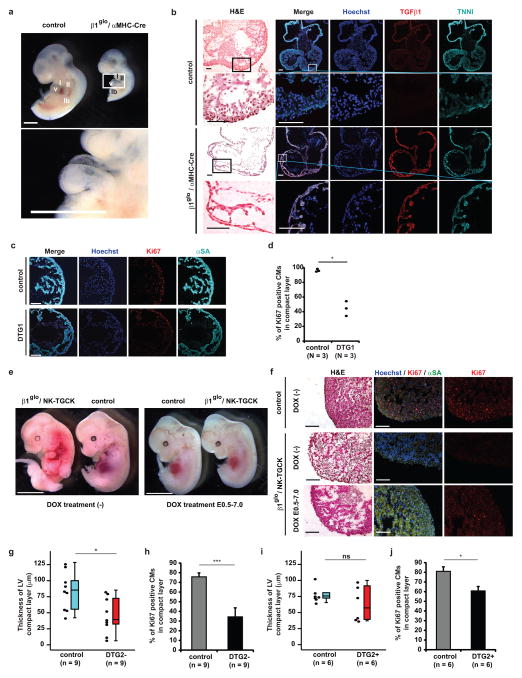
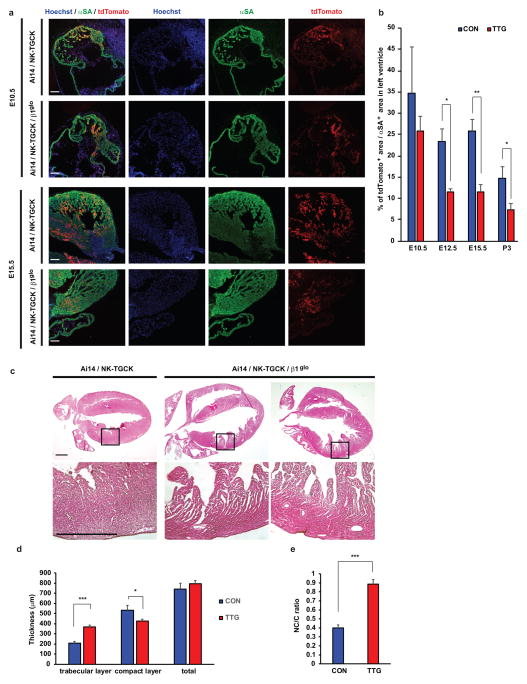
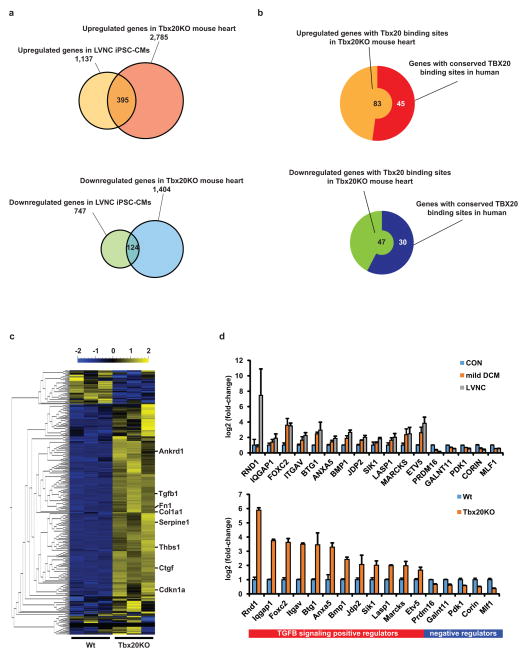
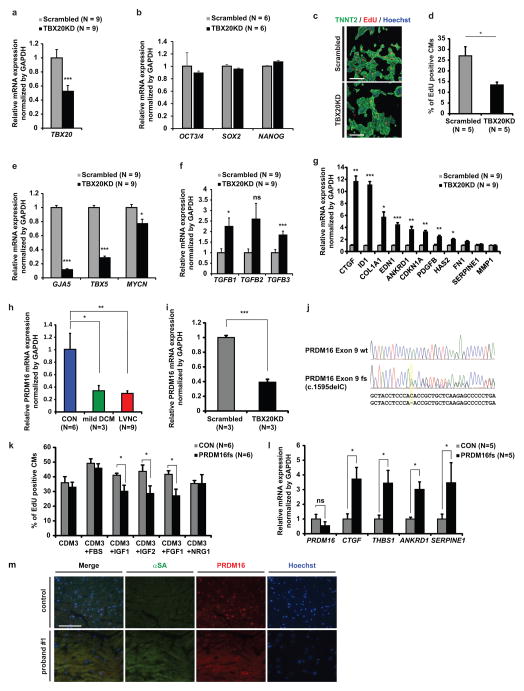
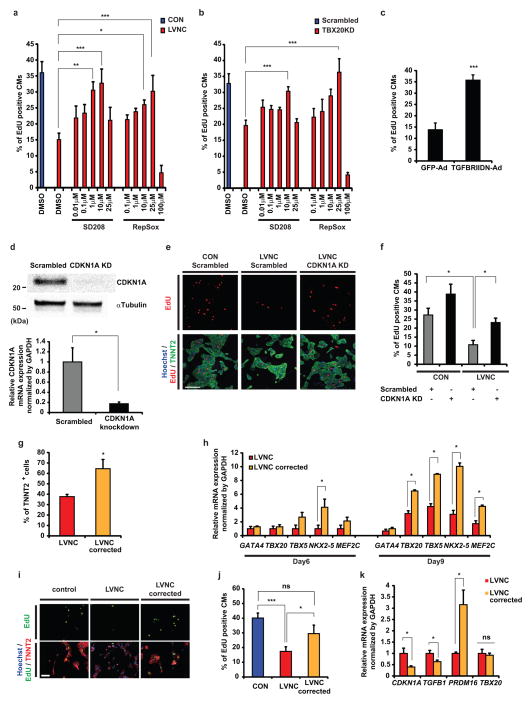
Left ventricular non-compaction (LVNC) is the third most prevalent cardiomyopathy in children and its pathogenesis has been associated with the developmental defect of the embryonic myocardium. We show that patient-specific induced pluripotent stem cell-derived cardiomyocytes (iPSC-CMs) generated from LVNC patients carrying a mutation in the cardiac transcription factor TBX20 recapitulate a key aspect of the pathological phenotype at the single-cell level and this was associated with perturbed transforming growth factor beta (TGF-β) signalling. LVNC iPSC-CMs have decreased proliferative capacity due to abnormal activation of TGF-β signalling. TBX20 regulates the expression of TGF-β signalling modifiers including one known to be a genetic cause of LVNC, PRDM16, and genome editing of PRDM16 caused proliferation defects in iPSC-CMs. Inhibition of TGF-β signalling and genome correction of the TBX20 mutation were sufficient to reverse the disease phenotype. Our study demonstrates that iPSC-CMs are a useful tool for the exploration of pathological mechanisms underlying poorly understood cardiomyopathies including LVNC.


Conflict of interest statement

The authors declare no competing financial interests.

Figures

Figure 1
Figure 1. Characterization of patient-specific LVNC iPSC-CMs carrying TBX20 mutation
a, Schematic pedigree of two families with LVNC. The probands are indicated by arrow (A-III-4 and B-II-2). “+” and “−” signs indicate presence and absence of the TBX20 Y317* mutation in the family A and T262M mutation in the family B, respectively. b, LVNC phenotype of the proband #1 (A-III-4), two siblings (A-III-2 and A-III-3), and an isolated proband #2 (B-II-2) are assessed by echocardiography. LA, left atrium; LV, left ventricle. Scale bars, 1 cm. c, The proband #1’s explanted heart (left) and Masson’s trichrome staining of the left ventricle (right). Scale bars, 1 cm. d, Schema of TBX20 and position of Y317* and T262M mutations (Upper). Confirmation of the Y317* (c. 951C>A) and T262M (c. 785C>T) mutation on the TBX20 gene (highlighted in green) (Lower). TAD, transactivation domain; RD repression domain. e, Western blot of FLAG tagged wild-type, Y317* and T262M TBX20 mutant protein overexpressed in HEK293 cells. f, Significant downregulation of TBX20 downstream target gene mRNA expression in LVNC iPSC-CMs. g, The efficiency of cardiac differentiation of patient-specific iPSC lines validated by FACS sorting. h, Heat map showed mRNA expression of cardiac transcription factors in iPSCs from day 0 to day 16 after induction of cardiac differentiation. The LVNC iPSCs showed significant decrease of cardiac transcription factors in day 6 and day 9 (red boxes). n=6 independent experiments. Mean=0. i, Immunostaining of nuclear (blue), TNNT2 (red), and EdU (green) in iPSC-CMs at 2 weeks. Scale bars, 100 μm. j, Percentage of EdU+ cardiomyocytes in control, mild DCM, and LVNC iPSC-CMs with or without serum (n=10, 10 and 30 for CON, mild DCM and LVNC independent experiments respectively at 2 weeks; n=4 independent experiments per each group at 4 and 8 weeks) or with growth factors (n=4 independent experiments per each group at 2, 4, and 8 weeks). CON, unrelated controls. *p < 0.05, ***p < 0.005; ns, not significant in one-way ANOVA followed by Tukey post hoc test. The bar graphs show the mean and error bars represent s.e.m. Statistics source data can be found in Supplementary Table 12. Unprocessed original scans of blots are shown in Supplementary Fig. 8.
Figure 2
Figure 2. Upregulation of TGFβ signaling in LVNC phenotype
a, Upstream regulator analysis of signaling pathway comparing LVNC and control iPSC-CMs at 2 weeks after induction of cardiac differentiation. The p-value measures whether there is a statistically significant overlap between the dataset genes and the genes that are regulated by a transcription regulator. b, Heat map showing upregulation of TGFβ signaling pathway in LVNC (III-2, 3, 4; mean of four samples) and mild DCM (II-2; mean of two samples) compared to control iPSC-CMs (unrelated controls; mean of two samples). Mean=0, variance=1. c, Western blot of total and phospho-SMAD2/3 in control and patient-specific iPSC-CMs (upper) and densitometry analysis, normalized against α-tubulin (lower). d, Western blot of CDKN1A protein in control and patient-specific iPSC-CMs (upper) and densitometry analysis, normalized against α-tubulin (lower). e, Immunostaining of nuclear (blue), alpha-sarcomeric actin (green), and phospho-SMAD2 (red) in LV of control donor heart tissue vs. explanted heart of proband #1. f, Allele-specific mRNA expression analysis by mRNA-sequencing (upper panel) and digital droplet PCR (lower panel) showed a higher ratio of TBX20 mutant allele expression in LVNC iPSC-CMs compared to mild DCM iPSC-CMs. n=6 independent experiments. g, The effect of TGFβ isoform treatments on the percentage of EdU+ cardiomyocytes in control iPSC-CMs with or without growth factors. PBS treated control; n = 4 independent experiments, TGFβ treated samples; n = 3 independent experiments. CON, unrelated controls. *p < 0.05, **p < 0.01, ***p < 0.005 in unpaired two-tailed t-test or one-way ANOVA followed by Tukey post hoc test. The bar graphs show the mean and error bars represent s.e.m. Scale bars, 100 μm. Statistics source data can be found in Supplementary Table 12. Unprocessed original scans of blots are shown in Supplementary Fig. 8.
Figure 3
Figure 3. Developmental arrest in cardiomyocyte-specific TGFβ1 overexpression mouse embryo heart
a, Lateral view of double transgenic embryo (β1glo/αMHC-Cre) at embryonic day (E) 10.5 compared to wild-type littermate (control). The lower panel shows higher magnification view of the double transgenic embryo heart (white box in upper panel). Scale bars, 1 mm. b, Hematoxylin and eosin (H&E) staining and immunostaining of nuclear (blue), Ki67 (red), and αSA (cyan) in control and β1glo/αMHC-Cre double transgenic (DTG1) embryo hearts at E10.5. Scale bars, 100 μm. c, Immunostaining for nuclear (blue), TGFβ1 (red), and TNNI (cyan) in coronal sections of control and DTG1 hearts at E10.5. Higher magnification pictures of compact layer (indicated by white box in upper panels) are shown in lower lane. Scale bars, 100 μm. d, Percentage of Ki67+ cardiomyocytes in compact layer of control and DTG1 embryo hearts at E10.5. e, The systemic phenotypes of partially TGFβ1-overexpressed double transgenic embryo (β1glo/NE-TGCK) at E12.5 compared to wild-type littermate (control) with or without doxycycline (DOX) treatment. Scale bars, 5 mm. f, H&E and immunostaining of nuclear (blue), Ki67 (red), and αSA (cyan) in wild-type (control) and β1glo/NE-TGCK double transgenic embryo hearts at E12.5. Scale bars, 100 μm. g, Dot and box plot of thickness of left ventricle (LV) compact layer in control and β1glo/NE-TGCK double transgenic embryo (DTG2−) hearts without DOX treatment at E12.5. h, DTG2− embryo hearts showed significant decrease of percentage of Ki67+ cardiomyocytes in compact layer at E12.5. i, Dot and box plot of thickness of left ventricle (LV) compact layer in control and DOX-treated β1glo/NE-TGCK double transgenic embryo (DTG2+) hearts at E12.5. j, DTG2+ embryo hearts showed significant decrease of percentage of Ki67+ cardiomyocytes in compact layer at E12.5. v, ventricle; I, 1st pharyngeal arch; II, 2nd pharyngeal arch; lb, limb bud. *p < 0.05, ***p < 0.005; ns, not significant in unpaired two-tailed t-test. The bar graphs show the mean and error bars represent s.e.m. The box plot shows the median, with upper and lower percentiles, and the bars show maxima and minima values. Statistics source data can be found in Supplementary Table 12.
Figure 4
Figure 4. Disturbed expansion of embryonic cardiomyocytes and trabecular/compact layer ratio in left ventricle of TGFβ1-overexpression mouse
a, Immunostaining of nuclear (blue), tdTomato (red), and αSA (green) in coronal sections of control (Ai14/NK-TGCK) and Ai14/NK-TGCK/β1glo triple transgenic embryo hearts with doxycycline treatment at E10.5 and E15.5. Scale bars, 100 μm. b, Percentage of tdTomato positive area per αSA positive area in compact layer of control and Ai14/NK-TGCK/β1glo triple double transgenic mouse hearts with doxycycline treatment at E10.5 (control; n=5 hearts, triple transgenic; n=5 hearts), E12.5 (control; n=6 hearts, triple transgenic; n=5 hearts), E15.5 (control; n=6 hearts, triple transgenic; n=5 hearts), and postnatal day 3 (P3) (control; n=18 hearts, triple transgenic; n=8 hearts). c, Hematoxylin and eosin staining in coronal sections of control (CON: Ai14/NK-TGCK) and Ai14/NK-TGCK/β1glo triple double transgenic mouse (TTG) hearts with doxycycline treatment at postnatal day (P) 3. Lower panels show hyper-magnified views of areas indicated by the black box in the upper panels. d, Thickness of trabecular and compact layer and total myocardium in control (n=8 hearts) and Ai14/NK-TGCK/β1glo triple transgenic mouse (n=11 hearts) hearts with doxycycline treatment at P3. e, Trabecular layer/compact layer (NC/C) ratio in control (n=8 hearts) and Ai14/NK-TGCK/β1glo triple transgenic mouse hearts (n=11 hearts) with doxycycline treatment at P3. Scale bars, 0.5 mm. *p < 0.05, **p < 0.01, ***p < 0.005 in unpaired two-tailed t-test. The bar graphs show the mean and error bars represent s.e.m. Statistics source data can be found in Supplementary Table 12.
Figure 5
Figure 5. TBX20 regulates the expression of TGFβ signaling modifier genes in developing cardiomyocytes
a, Venn diagram to show the overlap between genes upregulated (upper) or downregulated (lower) in LVNC iPSC-CMs compared to control iPSC-CMs (q<0.05), and upregulated (upper) or downregulated (lower) in Tbx20 knockout mouse heart compared to wild type (q<0.05). The mouse data were obtained from NCBI GEO database (http://www.ncbi.nlm.nih.gov/geo). b, Predicted number of upregulated (left) or downregulated (right) genes with Tbx20 binding sites in Tbx20KO mouse heart and number of genes with conserved Tbx20 binding site between mouse and human. The ChIP-sequencing data were obtained from NCBI GEO database (http://www.ncbi.nlm.nih.gov/geo/query/acc.cgi?acc=GSM734426). c, The heat map of TGFβ signaling pathway showing upregulation of TGFβ signaling pathway in Tbx20 knockout mouse heart compared to wild-type mouse heart. Mean=0, variance=1. d, Significant mRNA expression changes of TBX20 downstream target genes that are involved in TGFB signaling pathway as validated by RNA-sequencing. These genes were found to have conserved binding sites in both human (LVNC vs. control iPSC-CMS: upper) and mouse (Tbx20 knockout vs. wild type mouse heart: lower). The bar graphs show the mean and error bars represent s.e.m.
Figure 6
Figure 6. PRDM16 is a candidate target gene of TBX20 in cardiomyocytes
a, Validation of TBX20 shRNA knockdown efficiency in lentiviral TBX20 shRNA-transduced H7 ESC-CMs (TBX20KD) compared to scrambled shRNA-transduced H7 ESC- CMs (Scrambled) at 2 weeks. n=9 independent experiments per each group. b, Validation of pluripotent gene expression profile in TBX20KD and scrambled ESCs by qRT-PCR. c, Immunostaining of nuclear (blue), TNNT2 (green), and EdU (red) in scrambled and TBX20KD ESC-CMs at 2 weeks. d, Percentage of EdU+ ESC-CMs in scrambled and TBX20KD ESC-CMs at 2 weeks. e, Significant decrease of TBX20 downstream target gene (GJA5, TBX5, and MYCN) expressions in TBX20KD ESC-CMs compared to scrambled ESC-CMs at 2 weeks. fg Significant increase of TGFβ isoforms (f) and TGFβ downstream target gene (g) expression in TBX20KD ESC-CMs compared to scrambled ESC-CMs at 2 weeks. hi, Significant decrease of PRDM16 mRNA expression in LVNC iPSC-CMs compared to control iPSC-CMs (h) and in TBX20KD-H7-CMs compared to scrambled H7-CMs (i). j, CRISPR/Cas9-based frame shift mutation in exon 9 of PRDM16 gene in control iPSC lines (PRDM16 p.T532fs*8, c.1595delC: highlighted in yellow). k, Percentage of EdU+ cardiomyocytes in control and PRDM16 frame shift mutation-created iPSC-CMs (PRDM16fs) with or without growth factors. l, Significant increase of TGFβ downstream target gene expressions in PRDM16fs iPSC-CMs. m, Immunostaining of nuclear (blue), alpha-sarcomeric actin (green), and PRDM16 (red) in LV of donor’s control heart tissue and explanted heart of proband #1. CON, unrelated controls. *p < 0.05. **p < 0.01. ***p < 0.001; ns, not significant in unpaired two-tailed t-test or one-way ANOVA followed by Tukey post hoc test. The bar graphs show the mean and error bars represent s.e.m. Scale bars, 100 μm. Statistics source data can be found in Supplementary Table 12.
Figure 7
Figure 7. Rescue of pathological features of LVNC iPSC-CMs
a–b, Percentage of EdU+ control and LVNC iPSC-CMs (a) or scramble control and TBX20 knock-down ESC-CMs (b) at 2 weeks after induction of cardiac differentiation with or without treatment of TGFβ receptor-1 inhibitors (SD208 or RepSox) for 2 continuous days. n=7 independent experiments. c, Adenoviral mediated overexpression of dominant negative form of TGFβ receptor-2 (TGFBRIIDN) significantly restored proliferative potential in LVNC iPSC-CMs compared to control (adenoviral mediated GFP overexpression; GFP-Ad). n=8 independent experiments. d, Knockdown efficiency of CDKN1A protein (upper) and mRNA (lower) in iPSC-CMs by siRNA. n=6 independent experiments. e, Immunostaining for nuclear (blue), TNNT2 (green), and EdU (red) in control and LVNC iPSC-CMs with CDKN1A or scramble siRNA knockdown. f, Percentage of EdU+ iPSC-CMs at 2 weeks after induction of cardiac differentiation with CDKN1A or scramble siRNA knockdown. n=6 independent experiments. g, The efficiency of cardiac differentiation of LVNC and mutation corrected LVNC iPSC lines before glucose deprivation as validated by FACS for TNNT2. n=5 independent experiments per each group. h, mRNA expression of cardiac transcription factors in differentiating LVNC and mutation corrected LVNC iPSCs at day 6 and day 9 after induction of cardiac differentiation. LVNC n=6 independent experiments; LVNC corrected n=5 independent experiments. i, Immunostaining for nuclear (blue), TNNT2 (green), and EdU (red) in control, LVNC, and TBX20 mutation corrected (LVNC corrected) iPSC-CMs. j, Percentage of EdU+ iPSC-CMs at 2 weeks in control, LVNC, and LVNC corrected group. n=6 independent experiments. k, Reversible CDKN1A, TGFB1, and PRDM16 mRNA expression abnormality in LVNC corrected iPSC-CMs compared to LVNC iPSC-CMs. n=6 independent experiments. CON, unrelated controls. Scale bars, 100 μm. *p < 0.05, **p < 0.01, ***p < 0.005; ns, not significant in unpaired two-tailed t-test or one-way ANOVA followed by Tukey post hoc test. The bar graphs show the mean and error bars represent s.e.m. Statistics source data can be found in Supplementary Table 12. Unprocessed original scans of blots are shown in Supplementary Fig. 8.

References

    1. Kohli SK, et al. Diagnosis of left-ventricular non-compaction in patients with left-ventricular systolic dysfunction: time for a reappraisal of diagnostic criteria? Eur Heart J. 2008;29:89–95. - PubMed
    1. Nugent AW, et al. The epidemiology of childhood cardiomyopathy in Australia. The N Engl J Med. 2003;348:1639–1646. - PubMed
    1. Sedmera D, Pexieder T, Vuillemin M, Thompson RP, Anderson RH. Developmental patterning of the myocardium. Anat Rec. 2000;258:319–337. - PubMed
    1. Chin TK, Perloff JK, Williams RG, Jue K, Mohrmann R. Isolated noncompaction of left ventricular myocardium. A study of eight cases. Circulation. 1990;82:507–513. - PubMed
    1. Kosaka Y, et al. 14-3-3epsilon plays a role in cardiac ventricular compaction by regulating the cardiomyocyte cell cycle. Mol Cell Biol. 2012;32:5089–5102. - PMC - PubMed

Publication types

MeSH terms

Substances

Supplementary concepts