. 2016 Oct;18(10):1078-1089.
doi: 10.1038/ncb3408. Epub 2016 Sep 19.

Induction of LIFR confers a dormancy phenotype in breast cancer cells disseminated to the bone marrow

Affiliations

Induction of LIFR confers a dormancy phenotype in breast cancer cells disseminated to the bone marrow

Rachelle W Johnson et al. Nat Cell Biol. 2016 Oct.

Erratum in

Abstract

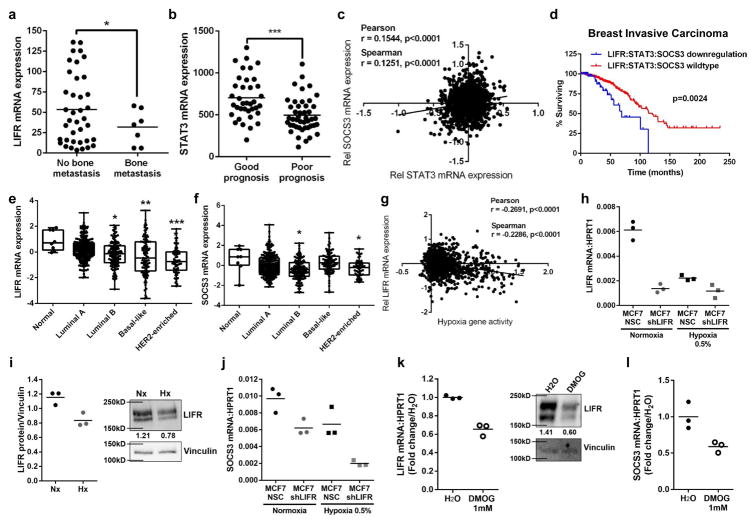
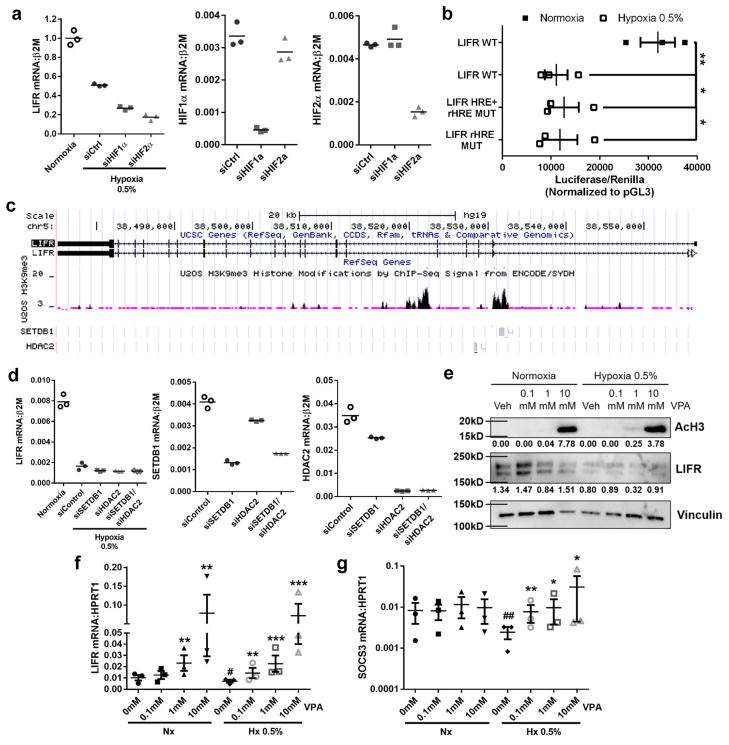
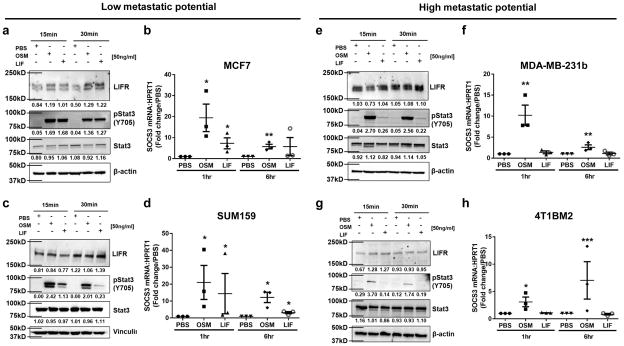
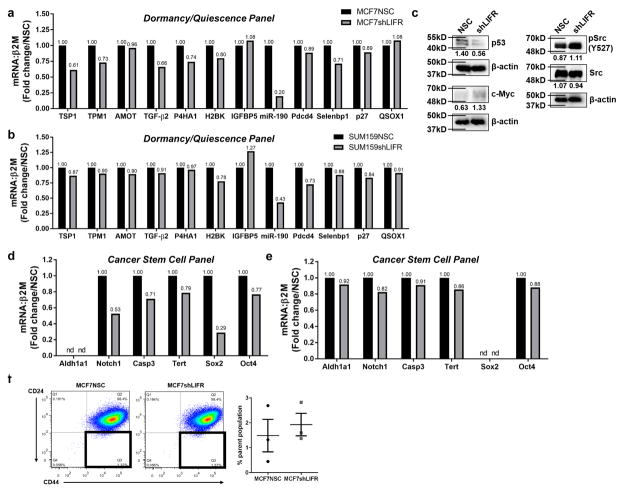
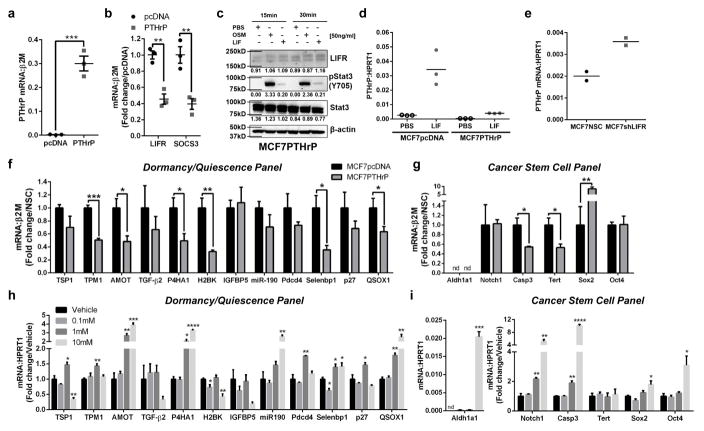
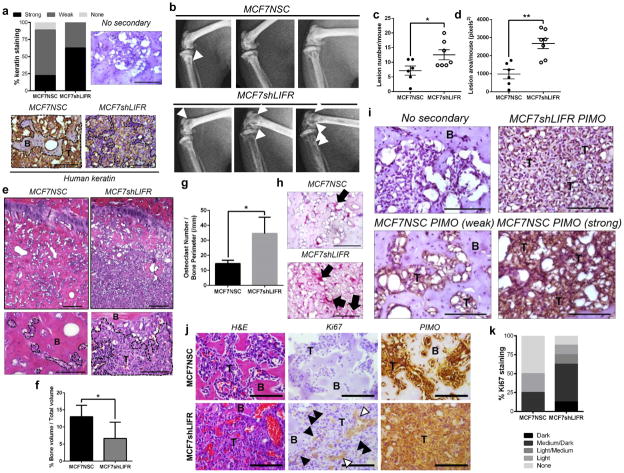
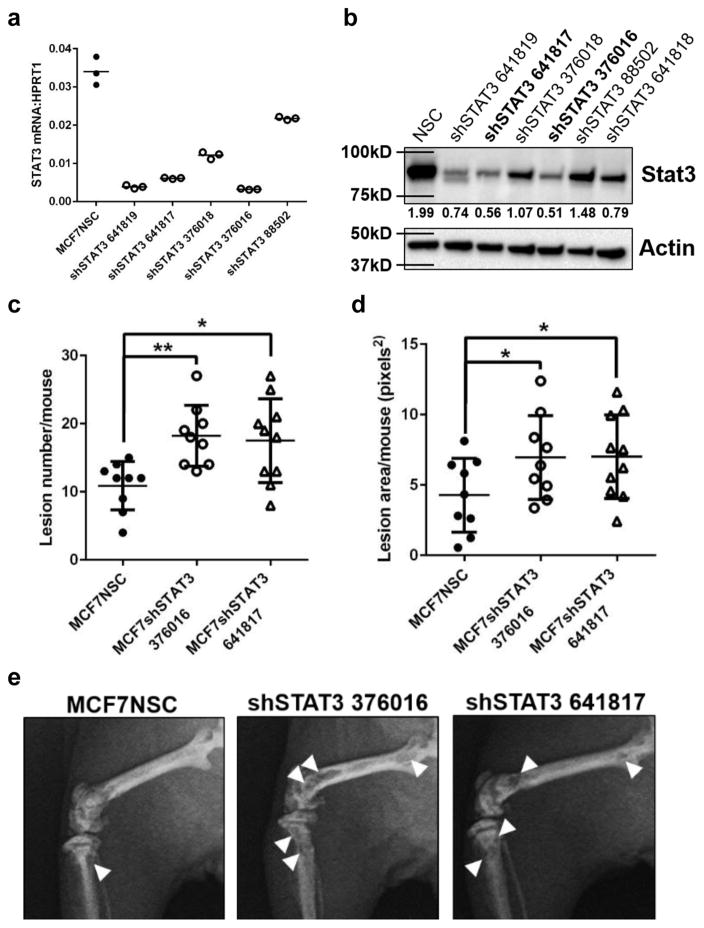
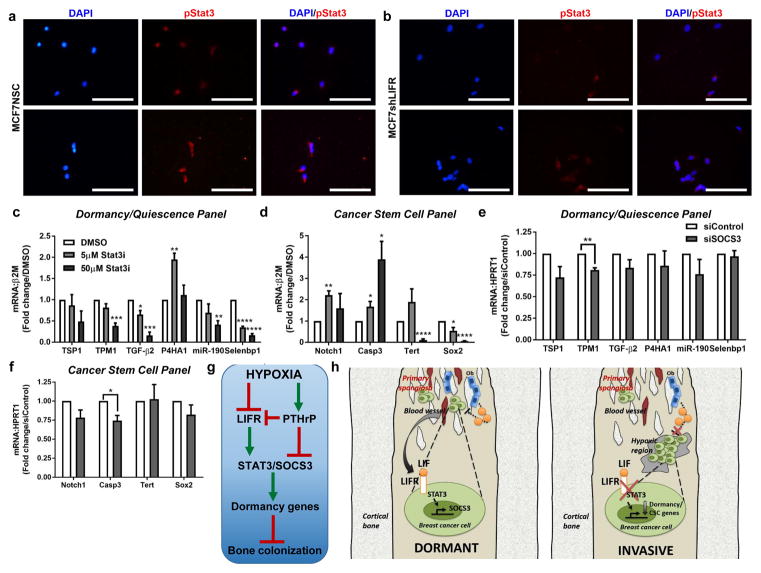
Breast cancer cells frequently home to the bone marrow, where they may enter a dormant state before forming a bone metastasis. Several members of the interleukin-6 (IL-6) cytokine family are implicated in breast cancer bone colonization, but the role for the IL-6 cytokine leukaemia inhibitory factor (LIF) in this process is unknown. We tested the hypothesis that LIF provides a pro-dormancy signal to breast cancer cells in the bone. In breast cancer patients, LIF receptor (LIFR) levels are lower with bone metastases and are significantly and inversely correlated with patient outcome and hypoxia gene activity. Hypoxia also reduces the LIFR:STAT3:SOCS3 signalling pathway in breast cancer cells. Loss of the LIFR or STAT3 enables otherwise dormant breast cancer cells to downregulate dormancy-, quiescence- and cancer stem cell-associated genes, and to proliferate in and specifically colonize the bone, suggesting that LIFR:STAT3 signalling confers a dormancy phenotype in breast cancer cells disseminated to bone.


Conflict of interest statement

Competing financial interests

The authors declare no competing financial interests.

Figures

Figure 1
Figure 1. LIFR:STAT3 signaling is down-regulated in patients with bone metastases and repressed by hypoxia
(a) LIFR mRNA levels (Minn et al. dataset) in breast tumors from patients with a poor prognosis based on Van’t Veer signature (n=38 patients with no bone metastasis, n=7 patients with bone metastasis). Student’s unpaired t-test with Welch’s Correction. (b) STAT3 mRNA levels (Minn et al. dataset) in breast tumors (n=37 good prognosis, n=45 poor prognosis). Student’s unpaired t-test. (c) Correlation of STAT3 and SOCS3 mRNA levels in The Cancer Genome Atlas (TCGA) provisional dataset, n=999 patients. Pearson and Spearman Correlation. (d) Analysis of TCGA invasive breast carcinoma (Nature 2012 dataset) patient samples for LIFR, STAT3, and SOCS3 mRNA down-regulation (n=682 patients with no mRNA down-regulation, n=55 patients with mRNA down-regulation). Logrank test. (e,f) LIFR and SOCS3 mRNA levels in TCGA invasive breast carcinoma (Nature 2012 dataset) samples stratified by PAM50 breast cancer subtype (Normal n=8, Luminal A n=230, Luminal B n=125, Basal-like n=98, HER2-enriched n=58 patients). Kruskal-Wallis test. Minima=25% percentile, maxima=75% percentile, center=median. (g) Correlation of Li et al. hypoxia gene signature with LIFR mRNA levels in TCGA invasive breast carcinoma patient dataset, as in (c). Pearson and Spearman Correlation. n=998 patients. (h) LIFR mRNA levels following 24hrs in normoxia or hypoxia. 3 technical replicates from a single experiment representative of 2 independent experiments. (i) Quantification of 3 Western blots, representative LIFR blot after 24hrs in normoxia or hypoxia. 3 technical replicates from a single experiment. (j) SOCS3 mRNA levels following 24hr culture in normoxia or hypoxia. 3 technical replicates from a single experiment representative of 2 independent experiments. (k) LIFR mRNA levels in MCF7 cells following 16hr treatment with PHD inhibitor DMOG (1mM) and LIFR Western blot representative of 3 technical replicates from a single experiment. PCR: 3 technical replicates from a single experiment. (l) SOCS3 mRNA levels in MCF7 cells following 16hr treatment with DMOG (1mM). 3 technical replicates from a single experiment. Source data for 1h–l in Supplementary Table 1 and unprocessed blots in Supplementary Fig. 9. Graphs represent mean/group and error bars=SEM. *p<0.05, **p<0.01, and ***p<0.001.
Figure 2
Figure 2. Hypoxic regulation of LIFR:STAT3 signaling is independent of HIF1α or HIF2α
(a) LIFR mRNA levels in MCF7 cells in normoxia or hypoxia for 24hrs and transfected with HIF1α or HIF2α siRNA. HIF1α and HIF2α mRNA knockdown levels shown as controls. 3 technical replicates from a single experiment representative of 3 independent experiments. (b) LIFR promoter activity of wildtype promoter (WT) or promoter with mutations in hypoxia responsive elements + reverse hypoxia element (LIFR HRE+rHRE mut) or reverse hypoxia element mutated only (LIFR rHRE mut) following culture for 48hrs in normoxia or hypoxia. Student’s unpaired t-test. n=3 biological replicates, one each from 3 independent experiments. (c) UCSC genome browser tracks for LIFR gene variants 1 and 2, H3K9me3 histone modifications by ChIP-Seq analysis from ENCODE database, and SETDB1 and HDAC2 binding sites on the LIFR gene. (d) LIFR mRNA levels in MCF7 cells in 24hrs normoxia or hypoxia and transfected with SETDB1 or HDAC2 siRNA. SETDB1 and HDAC2 mRNA knockdown levels shown as controls. 3 technical replicates from a single experiment representative of 3 independent experiments. (e) Western blot for acetylated histone H3 (AcH3) and LIFR protein levels in MCF7 cells treated with vehicle (Veh), 0.1mM, 1mM, or 10mM valproic acid (VPA), a histone deacetylase (HDAC) inhibitor, for 24hrs with actin loading control. Representative of 2 independent biological replicates. (f) LIFR mRNA levels after 24hrs treatment with 0, 0.1mM, 1mM, or 10mM VPA in normoxia or hypoxia. n=3 biological replicates, each being an average from 3 independent experiments. Student’s unpaired t-test. (g) SOCS3 mRNA levels after 24hrs treatment with 0, 0.1mM, 1mM, or 10mM VPA in normoxia or hypoxia. Student’s unpaired t-test. n=3 biological replicates, each being an average from 3 independent experiments. Source data for 2a,d available in Supplementary Table 1 and unprocessed blots in Supplementary Fig. 9. Graphs represent the mean/group and error bars represent standard error of the mean (SEM). *p<0.05, **p<0.01, ***p<0.001, and ****p<0.0001. #p<0.05 versus 0mM Nx.
Figure 3
Figure 3. The LIFR:STAT3 signaling pathway is intact in breast cancer cells with low metastatic potential and not high metastatic potential
(a,c,e,g) Western blot for LIFR, pSTAT3 (Y705), total Stat3, and β-actin (loading control) after 15 or 30 minute treatment with PBS (vehicle control), recombinant OSM (50ng/ml) or recombinant LIF (50ng/ml) in (a,c) MCF7 and SUM159 cells with low metastatic potential and (e,g) MDA-MB-231b and 4T1BM2 cells with high metastatic potential. Blots represent 3 independent biological replicates. (b,d,f,h) SOCS3 mRNA levels after 1 or 6 hour treatment with PBS, recombinant OSM (50ng/ml) or recombinant LIF (50ng/ml). b,f: Student’s unpaired t-test. d,h: Mann-Whitney test. n=3 biological replicates, each being an average from 3 independent experiments. Unprocessed blots in Supplementary Fig. 9. Graphs represent the mean/group and error bars represent standard error of the mean (SEM). *p<0.05 and **p<0.01.
Figure 4
Figure 4. Inhibition of LIFR signaling alters dormancy, quiescence and cancer stem cell-associated genes
(a) mRNA levels of genes associated with dormancy and quiescence in MCF7NSC and MCF7shLIFR cells. 3 technical replicates from a single experiment. (b) mRNA levels of genes associated with dormancy and quiescence in SUM159NSC and SUM159shLIFR cells. 3 technical replicates from a single experiment. (c) Western blot for signaling pathways associated with tumor dormancy (p53, Myc, Src). β-actin is loading control for each blot. (d) mRNA levels of genes associated with a cancer stem cell phenotype in MCF7NSC and MCF7shLIFR cells. 3 technical replicates from a single experiment. (e) mRNA levels of genes associated with a cancer stem cell phenotype in SUM159NSC and SUM159shLIFR cells. 3 technical replicates from a single experiment. (f) Representative FACS plot and graph of % parent population from n=3 biological replicates, each being an average from 3 independent experiments. Q3 = CD44High/CD24Low cancer stem cell population. Student’s unpaired t-test. Source data for 4a,b,d,e available in Supplementary Table 1 and unprocessed blots in Supplementary Fig. 9. Mean indicated on graph. Graphs represent the mean/group and error bars represent standard error of the mean (SEM). *p<0.05, **p<0.01, and ****p<0.0001.
Figure 5
Figure 5. Elevated PTHrP signaling blocks LIFR signaling and reduces dormancy, quiescence and cancer stem cell-associated genes
(a) Parathyroid hormone-related protein (PTHrP) mRNA levels in MCF7 cells overexpressing PTHrP (MCF7PTHrP). Student’s unpaired t-test. n=3 biological replicates, one each from 3 independent experiments. (b) LIFR and SOCS3 mRNA levels in MCF7PTHrP over-expressing cells. Student’s unpaired t-test. n=3 biological replicates, one each from 3 independent experiments. (c) Western blot for LIFR, pSTAT3 (Y705), total Stat3, and β-actin (loading control) in MCF7PTHrP over-expressing whole cell lysates. (d) SOCS3 mRNA levels in MCF7pcDNA and MCF7PTHrP over-expressing cells after 1 hour treatment with PBS (vehicle control) or recombinant LIF (50ng/ml). 3 technical replicates from a single experiment representative of 2 independent experiments. (e) PTHrP mRNA levels (1–139aa) inn MCF7NSC and MCF7shLIFR cells. 2 biological replicates, each being an average from 2 independent experiments. (f,g) mRNA levels of genes associated with (f) dormancy and quiescence, and (g) cancer stem cells in MCF7pcDNA (control) and MCF7PTHrP over-expressing cells. Mann-Whitney test. n=3 biological replicates, one each from 3 independent experiments. (h,i) mRNA levels of genes associated with (h) dormancy and quiescence, and (i) cancer stem cells in MCF7 cells treated for 24 hours with 0, 0.1mM, 1mM, or 10mM valproic acid (VPA). Multiple t-test with Holm-Sidak post-test. n=3 biological replicates, one each from 3 independent experiments. Source data for 5d,e available in Supplementary Table 1 and unprocessed blots in Supplementary Fig. 9. Graphs represent the mean/group and error bars represent standard error of the mean (SEM). *p<0.05, **p<0.01, ***p<0.001, and ****p<0.0001.
Figure 6
Figure 6. LIFR knockdown results in greater bone destruction via increased osteoclastogenesis and proliferation in vivo
(a) Percent of animals with strong, weak or no human keratin staining in bone marrow of mouse tibiae (7 mice/group). Representative human keratin staining in the bone marrow for MCF7NSC and MCF7shLIFR tumor-bearing mouse. Brown = human keratin positive. Black dashed line outlines tumor burden. B=bone, T=tumor. Scale bar=100μm. (b) Radiographic images of mouse tibiae and femora 10 weeks after MCF7NSC (n=6 mice) or MCF7shLIFR (n=7 mice) intracardiac tumor cell inoculation. White arrowheads indicate osteolytic lesions. (c) Total lesion number/mouse and (d) total lesion area/mouse in MCF7NSC (n=6 mice) and MCF7shLIFR (n=7 mice) tumor-bearing bones. Student’s unpaired t-test. (e) Representative H&E images of MCF7NSC (6 mice) and MCF7shLIFR (7 mice) tumor-bearing tibiae. B=bone, T=tumor. Histological analysis and (f) quantification of bone volume/total volume (%BV/TV) in MCF7NSC and MCF7shLIFR tumor-bearing tibiae (n=6 mice/group). Mann-Whitney test. Scale bar (top)=200μm. Scale bar (bottom)=100μm. (g) Quantification of osteoclast number/bone perimeter (OcN/BPm) in millimeters (n=7 mice/group). Student’s unpaired t-test. (h) Representative images of TRAP-positive osteoclasts in MCF7NSC (n=6 mice) and MCF7shLIFR (n=7 mice) tumor-bearing bones. Scale bar=100μm. (i) Immunohistochemistry for pimonidazole (hypoxia probe) in MCF7shLIFR (representative of 2 mice) and MCF7NSC (representative of 4 mice) tumor-bearing mice. B=bone, T=tumor. Upper left image=no secondary control. Upper right image representative of weak pimonidazole staining where MCF7shLIFR tumor cells have infiltrated the bone. Lower right image representative of strong pimonidazole staining with extensive tumor infiltration in MCF7NSC mouse and lower left image representative of weak pimonidazole staining in a pocket with little tumor infiltration in the same MCF7NSC tumor-bearing limb. Scale bar=100μm. (j) Histology/immunostaining for H&E, Ki67 (negative controls Supplementary Figure 8a), and PIMO in MCF7NSC and MCF7shLIFR tumor-bearing tibiae (8 mice/group). White arrows indicate blood vessels; black arrows indicate Ki67-positive tumor cells. T=tumor, B=bone. Scale bar=100μm. (k) Quantification of Ki67 percent staining (8 mice/group). Source data for 6c,d,f,g available in Supplementary Table 1. Graphs represent mean/group and error bars=SEM. *p<0.05 and **p<0.01.
Figure 7
Figure 7. Loss of Stat3 signaling results in greater bone destruction in vivo
(a) STAT3 mRNA levels in MCF7 cells infected with STAT3 lentiviral clones tested for knockdown efficiency. 3 technical replicates from a single experiment. (b) Western blot for Stat3 protein levels in MCF7 cells infected with STAT3 lentiviral clones tested for knockdown efficiency. (c) Lesion number (Total number from both tibiae and femora from each mouse) and (d) lesion area (Total area from both tibiae and femora from each mouse) in the tibiae and femora of MCF7NSC (n=9 mice) or MCF7shSTAT3 tumor-bearing mice (shSTAT3 clone 376016 n =9 mice, shSTAT3 clone 641817 n=10 mice). Student’s unpaired t-test. (e) Representative images of osteolytic bone destruction in MCF7NSC (n=9 mice), MCF7shSTAT3 376016 (n=9 mice), and MCF7shSTAT3 641817 (n=10 mice) tumor-bearing mice. Source data for 7a,c,d available in Supplementary Table 1. Graphs represent the mean/group and error bars represent standard error of the mean (SEM). *p<0.05 and **p<0.01.
Figure 8
Figure 8. Targeting STAT3 or SOCS3 mimics effects of loss of LIFR signaling on dormancy genes
(a,b) Immunocytochemistry for basal pStat3 (Y705) protein levels in (a) MCF7NSC (2 biological replicates) and (b) MCF7shLIFR cells (2 biological replicates). Images representative of 3 independent replicates/group. Scale bar = 100μm. (c,d) mRNA levels of dormancy/quiescence and cancer stem cell-associated genes in MCF7 cells following 24 hour treatment with 5μM or 50μM of the small molecule Stat3 inhibitor ML116 (Stat3i). Multiple t-tests with Holm-Sidak method. n=3 biological replicates, one each from 3 independent experiments. (e,f) mRNA levels of dormancy/quiescence and cancer stem cell-associated genes in MCF7 cells transfected with siRNA against SOCS3 for 48 hours. Multiple t-tests with Holm-Sidak method. n=3 biological replicates, one each from 3 independent experiments. (g) Flow chart indicating hypoxia differentially regulates LIFR and PTHrP, which signal via STAT3 and SOCS3 to regulate dormancy-associated genes and thus influence bone colonization. (h) Working model for LIFR:STAT3 signaling in disseminated breast cancer cells transitioning from a dormant to invasive phenotype in strongly hypoxic regions of the bone marrow. Graphs represent the mean/group and error bars represent standard error of the mean (SEM).*p<0.05, **p<0.01, ***p<0.001, and ****p<0.0001.

Similar articles

Cited by

References

    1. Sosa MS, Bragado P, Aguirre-Ghiso JA. Mechanisms of disseminated cancer cell dormancy: an awakening field. Nature reviews Cancer. 2014;14:611–622. - PMC - PubMed
    1. Croucher PI, McDonald MM, Martin TJ. Bone metastasis: the importance of the neighbourhood. Nature reviews Cancer. 2016;16:373–386. - PubMed
    1. Wang H, et al. The osteogenic niche promotes early-stage bone colonization of disseminated breast cancer cells. Cancer cell. 2015;27:193–210. - PMC - PubMed
    1. Ghajar CM, et al. The perivascular niche regulates breast tumour dormancy. Nature cell biology. 2013;15:807–817. - PMC - PubMed
    1. Price TT, et al. Dormant breast cancer micrometastases reside in specific bone marrow niches that regulate their transit to and from bone. Sci Transl Med. 2016;8:340ra373. - PMC - PubMed